Thread: libpq debug log
Hi,

I'm going to propose libpq debug log for analysis of queries on the application side.
I think that it is useful to determine whether the cause is on the application side or the server side when a slow
queryoccurs.


The provided information is "date and time" at which execution of processing is started, "query", "application side
processing",which is picked up information from PQtrace(), and "connection id", which is for uniquely identifying the
connection.


To collect the log, set the connection string or environment variable.
- logdir or PGLOGDIR : directory where log file written
- logsize or PGLOGSIZE : maximum log size

What do you think about this?  Do you think that such feature is necessary?

Regards,
Aya Iwata
"Iwata, Aya" <iwata.aya@jp.fujitsu.com> writes:
> I'm going to propose libpq debug log for analysis of queries on the application side.
> I think that it is useful to determine whether the cause is on the application side or the server side when a slow
queryoccurs.

Hm, how will you tell that really?  And what's the advantage over the
existing server-side query logging capability?

> The provided information is "date and time" at which execution of processing is started, "query", "application side
processing",which is picked up information from PQtrace(), and "connection id", which is for uniquely identifying the
connection.

PQtrace() is utterly useless for anything except debugging libpq
internals, and it's not tremendously useful even for that.  Don't
bother with that part.

Where will you get a "unique connection id" from?

How will you deal with asynchronously-executed queries --- either
the PQgetResult style, or the single-row-at-a-time style?

            regards, tom lane
On Fri, 24 Aug 2018 04:38:22 +0000
"Iwata, Aya" <iwata.aya@jp.fujitsu.com> wrote:

> Hi,
>
> I'm going to propose libpq debug log for analysis of queries on the application side.
> I think that it is useful to determine whether the cause is on the application side or the server side when a slow
queryoccurs.


Do you mean you want to monitor the protocol message exchange at
the client side to analyze performance issues, right?  Actually,
this might be useful to determin where is the problem, for example,
the client application, the backend PostgreSQL, or somewhere in the
network.

Such logging can be implemented in the application, but if libpq
provides the standard way, it would be helpful to resolve a problem
without modifying the application code.

> The provided information is "date and time" at which execution of processing is started, "query", "application side
processing",which is picked up information from PQtrace(), and "connection id", which is for uniquely identifying the
connection.


I couldn't image how this is like. Could you show us a sample of log lines
in your head?

> To collect the log, set the connection string or environment variable.
> - logdir or PGLOGDIR : directory where log file written
> - logsize or PGLOGSIZE : maximum log size

How we can specify the log file name?  What should happen if a file size
exceeds to PGLOGSIZE?

Regards,
--
Yugo Nagata <nagata@sraoss.co.jp>
On Fri, Aug 24, 2018 at 9:48 AM, Tom Lane <tgl@sss.pgh.pa.us> wrote:
> PQtrace() is utterly useless for anything except debugging libpq
> internals, and it's not tremendously useful even for that.  Don't
> bother with that part.

I think that improving the output format could help with that a lot.
What it current produces is almost unreadable; adjusting it to emit
one line per protocol message would, I think, help a lot.  There are
probably other improvements that could be made at the same time.

--
Robert Haas
EnterpriseDB: http://www.enterprisedb.com
The Enterprise PostgreSQL Company
Robert Haas <robertmhaas@gmail.com> writes:
> On Fri, Aug 24, 2018 at 9:48 AM, Tom Lane <tgl@sss.pgh.pa.us> wrote:
>> PQtrace() is utterly useless for anything except debugging libpq
>> internals, and it's not tremendously useful even for that.  Don't
>> bother with that part.

> I think that improving the output format could help with that a lot.
> What it current produces is almost unreadable; adjusting it to emit
> one line per protocol message would, I think, help a lot.  There are
> probably other improvements that could be made at the same time.

I wouldn't mind throwing it out and reimplementing it ;-) ... tracing
at the logical message level rather than the byte level would help.
But still, I'm not really convinced that it has very much to do with
what you'd want in a user-level debug log.

Part of what's really bad about the PQtrace output is that in v2 protocol
the same output can be repeated several times as we try to parse a message
and conclude we don't have it all yet.  I believe that problem is gone
in v3, but it may be hard to do a consistent redesign until we nuke libpq's
v2 support.  Still, it might be past time for the latter, seeing that
we no longer promise pre-7.4 compatibility in either psql or pg_dump.

            regards, tom lane
> "Iwata, Aya" <iwata.aya@jp.fujitsu.com> writes:
> > I'm going to propose libpq debug log for analysis of queries on the application
> side.
> > I think that it is useful to determine whether the cause is on the application
> side or the server side when a slow query occurs.
>
> Hm, how will you tell that really?  And what's the advantage over the existing
> server-side query logging capability?

The log I would like to propose is used when the performance issue happen,
system administrator knows the process of application internally and check if there is any problem.
"debug" is not the correct description of the feature. The correct one should be "trace". Should I create another
thread?


> > The provided information is "date and time" at which execution of processing
> is started, "query", "application side processing", which is picked up
> information from PQtrace(), and "connection id", which is for uniquely
> identifying the connection.
>
> PQtrace() is utterly useless for anything except debugging libpq internals,
> and it's not tremendously useful even for that.  Don't bother with that part.

My initial intention was to get only useful information from PQTrace () since it acquires a lot of information.
Is there another way to obtain application side information besides PQTrace() ?

> Where will you get a "unique connection id" from?

When collecting trace log file in the application side,
I think it is necessary to identify different connection.
In order to do this, when new empty PQconn structure is created, new connection id is also created.
Then we output it in the trace log file for one application.

> How will you deal with asynchronously-executed queries --- either the
> PQgetResult style, or the single-row-at-a-time style?

In my understanding, PQgetResult style outputs logs of multiple result queries at once,
While the single-row-at-a-time style outputs log for each query. Is this correct?
I think PQgetResult style is better,
because this style traces the internal process of the application.

Regards,
Aya Iwata
> > I'm going to propose libpq debug log for analysis of queries on the application
> side.
> > I think that it is useful to determine whether the cause is on the application
> side or the server side when a slow query occurs.
>
> Do you mean you want to monitor the protocol message exchange at the client
> side to analyze performance issues, right?  Actually, this might be useful to
> determin where is the problem, for example, the client application, the backend
> PostgreSQL, or somewhere in the network.
>
> Such logging can be implemented in the application, but if libpq provides the
> standard way, it would be helpful to resolve a problem without modifying the
> application code.

Since I'd like to monitor the information the server and the client exchange,
I think monitoring protocol messages is good.

When a slow query is occurs, we check this client side trace log.
The purpose of this log acquisition I thought is to identify where is the problem:
server side, application side or traffic.
And if the problem is in application side, checking the trace log to identify what is the problem.

> > The provided information is "date and time" at which execution of processing
> is started, "query", "application side processing", which is picked up
> information from PQtrace(), and "connection id", which is for uniquely
> identifying the connection.
>
> I couldn't image how this is like. Could you show us a sample of log lines in
> your head?

I am roughly thinking as follows;

...
START : 2018/09/03 18:16:35.357 CONNECTION(1)
STATUS : Connection
SEND MESSAGE : 2018/09/03 18:16:35.358
<information send to backend...>
RECEIVE MESSAGE : 2018/09/03 18:16:35.359
<information receive from backend...>
END : 2018/09/03 18:16:35.360
...
START : 2018/09/03 18:16:35.357 CONNECTION(1)
QUERY : DECLARE myportal CURSOR FOR select * from pg_database
SEND MESSAGE : 2018/09/03 18:16:35.358
<information send to backend...>
RECEIVE MESSAGE : 2018/09/03 18:16:35.359
<information receive from backend...>
END : 2018/09/03 18:16:35.360
...

> > To collect the log, set the connection string or environment variable.
> > - logdir or PGLOGDIR : directory where log file written
> > - logsize or PGLOGSIZE : maximum log size
>
> How we can specify the log file name?  What should happen if a file size exceeds
> to PGLOGSIZE?

The log file name is determined as follow.
libpq-%ApplicationName-%Y-%m-%d_%H%M%S.log

When the log file size exceeds to PGLOGSIZE, the log is output to another file.

Regards,
Aya Iwata
"Iwata, Aya" <iwata.aya@jp.fujitsu.com> writes:
> The purpose of this log acquisition I thought is to identify where is the problem:
> server side, application side or traffic.

TBH, I think the sort of logging you're proposing would be expensive
enough that *it* would be the bottleneck in a lot of cases.  A lot
of people find that the existing server-side "log_statement" support
is too expensive to keep turned on in production --- and that logs only
received SQL queries, not the returned data, and certainly not every
message passed over the wire.

            regards, tom lane
On 04/09/2018 02:29, Iwata, Aya wrote:
> Since I'd like to monitor the information the server and the client exchange,
> I think monitoring protocol messages is good.
>
> When a slow query is occurs, we check this client side trace log.
> The purpose of this log acquisition I thought is to identify where is the problem:
> server side, application side or traffic.
> And if the problem is in application side, checking the trace log to identify what is the problem.

Between perf/systemtap/dtrace and wireshark, you can already do pretty
much all of that.  Have you looked at those and found anything missing?

--
Peter Eisentraut              http://www.2ndQuadrant.com/
PostgreSQL Development, 24x7 Support, Remote DBA, Training & Services
Let me explain this trace log in a bit more detail.

This log is not turned on in the system by default.
Turn it on when an issue occurs and you want to check the information in the application in order to clarify the
cause.

I will present three use cases for this log.

1. Confirmation on cause of out-of-memory
We assume that Out-of-memory occurred in the process of storing the data received from the database.
However, the contents or length of the data is not known.
A trace log is obtained to find these out and what kind of data you have in which part (i.e. query result when
receivingfrom database).


2. Protocol error confirmation
When there is an error in the protocol transmitted from the client and an error occurs in the database server, the
protocolsent by the client is checked.

When the network is unstable, log is checked whether the database server is receiving protocol messages.

3. Processing delay survey
If the processing in the application is slow and the processing in the database is fast, investigate the cause of the
processingdelay.

4 kind of time can be obtained by the log;

 Timestamp when SQL started
 Timestamp when information began to be sent to the backend
 Timestamp when information is successfully received in the application
 Timestamp when SQL ended

Then the difference between the time is checked to find out which part of process takes time.


I reconfirm the function I proposed.

If get the trace log, set PGLOGDIR/logdir and PGLOGSIZE/logsize.
These parameters are set in the environment variable or the connection service file.
- logdir or PGLOGDIR : directory where log file written
- logsize or PGLOGSIZE : maximum log size. When the log file size exceeds to PGLOGSIZE, the log is output to another
file.

The log file name is determined as follow.
libpq-%ConnectionID-%Y-%m-%d_%H%M%S.log

This is a trace log example;

...
Start: 2018-09-03 18:16:35.357 Connection(1)
Status: Connection
Send message: 2018-09-03 18:16:35.358
<information send to backend...>
Receive message: 2018-09-03 18:16:35.359
<information receive from backend...>
End: 2018-09-03 18:16:35.360
...
Start: 2018-09-03 18:16:35.357 Connection(1)            ...(1), (2)
Query: DECLARE myportal CURSOR FOR select * from pg_database    ...(3)
Send message: 2018-09-03 18:16:35.358                ...(4)
<information send to backend...>                    ...(5)
Receive message: 2018/09/03 18:16:35.359                ...(6)
<information receive from backend...>                ...(7)
End: 2018-09-03 18:16:35.360                    ...(8)
...


(1) Timestamp when SQL started
(2) Connection ID (Identify the connection)
(3) SQL statement
(4) Timestamp when information began to be sent to the backend
(5) send message to backend (Result of query, Protocol messages)
(6) Timestamp when information is successfully received in the application
(7) receive message from backend (Result of query, Protocol messages)
(8) Timestamp when SQL ended


Regards,
Iwata Aya
Hi,

Sorry for my late response.

> Between perf/systemtap/dtrace and wireshark, you can already do pretty much
> all of that.  Have you looked at those and found anything missing?

These commands provide detailed information to us.
However, I think the trace log is necessary from the following point.

1. ease of use for users
It is necessary to take information that is easy to understand for database users.
This trace log is retrieved on the application server side.
Not only the database developer but also application developer will get and check this log.
Also, some of these commands return detailed PostgreSQL function names.
The trace log would be useful for users who do not know the inside of PostgreSQL (e.g. application developers)


2. obtain the same information on all OS
Some commands depend on the OS.
I think that it is important that the trace log information is compatible to each OS.

Regards,
Aya Iwata
Hi,

I create a first libpq trace log patch.

In this patch,
- All message that PQtrace() gets are output to the libpq trace log file
  (I maybe select more effective message in the future patch)
- Trace log output style is changed slightly from previously proposed

This patch not include documentation,
but you can see parameter detail and how to use it by looking at my previous e-mail.

 If get the trace log, set PGLOGDIR/logdir and PGLOGSIZE/logsize.
 These parameters are set in the environment variable or the connection service
 file.
 - logdir or PGLOGDIR : directory where log file written
 - logsize or PGLOGSIZE : maximum log size(M). When the log file size exceeds to
 PGLOGSIZE, the log is output to another file.

 The log file name is determined as follow.
 libpq-%ProcessID-%Y-%m-%d_%H%M%S.log

Trace log example;
Start :  2018/10/30 08:02:24.433                    ... time(a)
Query: SELECT pg_catalog.set_config('search_path', '', false)
To backend> Msg Q
To backend> "SELECT pg_catalog.set_config('search_path', '', false)"
To backend> Msg complete, length 60
Start sending message to backend:  2018/10/30 08:02:24.433        ... time(b)
End sending message to backend:  2018/10/30 08:02:24.433        ... time(c)
Start receiving message from backend:  2018/10/30 08:02:24.434    ... time(d)
End receiving message from backend:  2018/10/30 08:02:24.434    ... time(e)
From backend> T
From backend (#4)> 35
From backend (#2)> 1
From backend> "set_config"
From backend (#4)> 0
From backend (#2)> 0
From backend (#4)> 25
From backend (#2)> 65535
From backend (#4)> -1
From backend (#2)> 0
From backend> D
From backend (#4)> 10
From backend (#2)> 1
From backend (#4)> 0
From backend> C
From backend (#4)> 13
From backend> "SELECT 1"
From backend> Z
From backend (#4)> 5
From backend> Z
From backend (#4)> 5
From backend> I
End :  2018/10/30 08:02:24.435                    ... time(f)

From time(a) to time(b): time for libpq processing
From time(b) to time(c): time for traffic
From time(c) to time(d): time for backend processing
From time(d) to time(e): time for traffic
From time(e) to time(f): time for libpq processing

Regards,
Aya Iwata
Attachment
Greetings,

This is my first attempt at a patch review, so I will take a pass at the
low hanging fruit.

Initial Pass
============

+ Patch applies
+ Patch builds
+ Patch behaves as described in the thread

I tried a few small things:

When I set a relative path for `PGLOGDIR`, the files were correctly
written to the directory.

When I set a path for `PGLOGDIR` that didn't exist or was not
write-able, the patch writes no files, and does not alert the user that
no files are being written.

Performance
===========

I ran two permutations of make check, one with the patch applied but not
activated, and the other with with the files being written to disk. Each
permutation was run ten times, and the stats are below (times are in
seconds):

              min  max  median  mean
not logging  50.4 57.6    53.3  53.4
    logging  58.3 77.7    65.0  65.8


Cheers,
Jim Doty
On Tue, Oct 30, 2018 at 2:39 AM Iwata, Aya <iwata.aya@jp.fujitsu.com> wrote:
> I create a first libpq trace log patch.

Couple additional thoughts from a read-through of the patch:

- PQtrace() and the new trace-logging machinery overlap in some places
but not others -- and if both are set, PQtrace() will take precedence.
It seems like the two should not be separate.
- It isn't immediately clear to me how the new information in the logs
is intended to be used in concert with the old information. Maybe this
goes back to the comments by Tom and Robert higher in the thread --
that an overhaul of the PQtrace system is due. This patch as presented
would make things a little worse before they got better, I think.

That said, I think the overall idea -- application performance
information that can be enabled via the environment, without requiring
debugging privileges on a machine or the need to manually correlate
traces made by other applications -- is a good one, and something I
would use.

--Jacob
On Tue, Oct 30, 2018 at 8:38 PM Iwata, Aya <iwata.aya@jp.fujitsu.com> wrote:
Hi,
I create a first libpq trace log patch.
In this patch,
- All message that PQtrace() gets are output to the libpq trace log file
(I maybe select more effective message in the future patch)
- Trace log output style is changed slightly from previously proposed
This patch not include documentation,
but you can see parameter detail and how to use it by looking at my previous e-mail.
If get the trace log, set PGLOGDIR/logdir and PGLOGSIZE/logsize.
These parameters are set in the environment variable or the connection service
file.
- logdir or PGLOGDIR : directory where log file written
- logsize or PGLOGSIZE : maximum log size(M). When the log file size exceeds to
PGLOGSIZE, the log is output to another file.
The log file name is determined as follow.
libpq-%ProcessID-%Y-%m-%d_%H%M%S.log
Trace log example;
Start : 2018/10/30 08:02:24.433 ... time(a)
Query: SELECT pg_catalog.set_config('search_path', '', false)
To backend> Msg Q
To backend> "SELECT pg_catalog.set_config('search_path', '', false)"
To backend> Msg complete, length 60
Start sending message to backend: 2018/10/30 08:02:24.433 ... time(b)
End sending message to backend: 2018/10/30 08:02:24.433 ... time(c)
Start receiving message from backend: 2018/10/30 08:02:24.434 ... time(d)
End receiving message from backend: 2018/10/30 08:02:24.434 ... time(e)
From backend> T
From backend (#4)> 35
From backend (#2)> 1
From backend> "set_config"
From backend (#4)> 0
From backend (#2)> 0
From backend (#4)> 25
From backend (#2)> 65535
From backend (#4)> -1
From backend (#2)> 0
From backend> D
From backend (#4)> 10
From backend (#2)> 1
From backend (#4)> 0
From backend> C
From backend (#4)> 13
From backend> "SELECT 1"
From backend> Z
From backend (#4)> 5
From backend> Z
From backend (#4)> 5
From backend> I
End : 2018/10/30 08:02:24.435 ... time(f)
From time(a) to time(b): time for libpq processing
From time(b) to time(c): time for traffic
From time(c) to time(d): time for backend processing
From time(d) to time(e): time for traffic
From time(e) to time(f): time for libpq processing
Thanks for the patch.
I have some comments related to the trace output that is getting
printed. The amount of log it is generating may not be understood
to many of the application developers. IMO, this should print
only the necessary information that can understood by any one
by default and full log with more configuration?
Regards,
Haribabu Kommi
Fujitsu Australia
Hi Jim Doty san,

Thank you for review! I'm sorry my late reply...

> Initial Pass
> ============
>
> + Patch applies
> + Patch builds
> + Patch behaves as described in the thread
Thank you for your check.

> When I set a path for `PGLOGDIR` that didn't exist or was not write-able,
> the patch writes no files, and does not alert the user that no files are being
> written.
I understand. I think it means that it is necessary to confirm how the setting is going well.
There is no warning method when connection string or the environment variable is wrong.

So I added following document:
+   If the setting of the file path by the connection string or the environment variable is
+   incorrect, the log file is not created in the intended location.
+   The maximum log file size you set is output to the beginning of the file, so you can check it.
And I added the process. Please see my v2 patch.

> Performance
> ===========
>
> I ran two permutations of make check, one with the patch applied but not
> activated, and the other with with the files being written to disk. Each
> permutation was run ten times, and the stats are below (times are in
> seconds):
>
>               min  max  median  mean
> not logging  50.4 57.6    53.3  53.4
>     logging  58.3 77.7    65.0  65.8
Thank you for your measurement.
I'm thinking about adding a logging level so that only the necessary information can be printed by default. It was
pointedout by Haribabu san's e-mail.

This minimizes the impact of logging on performance.

Regards,
Aya Iwata
Attachment
Hi Hari san,
Thank you for your comment! And sorry my late reply…
>I have some comments related to the trace output that is getting
>printed. The amount of log it is generating may not be understood
>to many of the application developers. IMO, this should print
>only the necessary information that can understood by any one
>by default and full log with more configuration?
I understand. And I agree your opinion.
I will add feature called “log level” that changes the amount of log output information with my future version patch.
Regards,
Aya Iwata
Hi Jacob san,

Thank you for your comment! And sorry for late reply...

> Couple additional thoughts from a read-through of the patch:
>
> - PQtrace() and the new trace-logging machinery overlap in some places but
> not others -- and if both are set, PQtrace() will take precedence.
> It seems like the two should not be separate.
I understand. This log is acquired for the purpose of investigating the cause part (server side or application side)
whenperformance is bad.

So I will search whether getting other place of PQtrace() is necessary or not.
And I will reply after the research, please wait for a while a little.

> - It isn't immediately clear to me how the new information in the logs is
> intended to be used in concert with the old information. Maybe this goes back
> to the comments by Tom and Robert higher in the thread -- that an overhaul
> of the PQtrace system is due. This patch as presented would make things a
> little worse before they got better, I think.
>
> That said, I think the overall idea -- application performance information
> that can be enabled via the environment, without requiring debugging
> privileges on a machine or the need to manually correlate traces made by other
> applications -- is a good one, and something I would use.
Thank you. I think so, too. Some applications cannot be stopped to add the PQtrace() code.

Regards,
Aya Iwata
Hi,

I created a new version patch. Please find attached my patch.

Changes:
Since v2 patch
I forgot to write the detail of v2 patch changes. So I write these.
- Fixed the " Start receiving message from backend:" message location. Because I found that message located at outside
of"retry4".

- Changed location where output "start :" / "end :" messages and timestamp. The reason of the change is that v1 patch
didnot correspond to Asynchronous Command Processing.

- Added documentation
- Added documentation how to check mistake of logdir and/or logsize. (Based on review comment of Jim san's)
Since v3 patch
- Fixed my mistake on fe-connect.c. Time and message were output at the place where does not output in originally
PQtrace().These messages are needed only new trace log. So I fixed it.

- Fixed two points so that new trace log overlaps all places in PQtrace(). (Based on review comment of Jacob san's)

TODO:
I will add the feature called "logging level" on next version patch. I will attach it as soon as possible.

I'm marking it as "Needs review".

Regards,
Aya Iwata
Attachment
On 27/11/2018 08:42, Iwata, Aya wrote:
> I created a new version patch. Please find attached my patch.

This does not excite me.  It seems mostly redundant with using tcpdump.

If I were to debug networking problems, I wouldn't even trust this very
much because it relies on the willpower of all future PostgreSQL
developers to keep this accurately up to date, whereas tcpdump gives me
the truth from the kernel.

--
Peter Eisentraut              http://www.2ndQuadrant.com/
PostgreSQL Development, 24x7 Support, Remote DBA, Training & Services
Hi Peter,

Thank you for your reply!

> On 27/11/2018 08:42, Iwata, Aya wrote:
> > I created a new version patch. Please find attached my patch.
>
> This does not excite me.  It seems mostly redundant with using tcpdump.
I will develop "log level". I'm planning not to output redundant message at the default level.

> If I were to debug networking problems, I wouldn't even trust this very much
> because it relies on the willpower of all future PostgreSQL developers to
> keep this accurately up to date, whereas tcpdump gives me the truth from the
> kernel.
I agree your concern about log trusty. It would be a good choice for only
skilled users to use tcpdump. I think libpq trace log will be used many users,
it includes users who not familiar with PostgreSQL protocols. The log would be easier to use
because it shows "start time" and "end time". On tcpdump also shows
the starting time and ending time but people need to know PostgreSQL protocol
to get them.

And this log also is useful for Windows users.
Windows does not have originally networking trace tool.

If you have any ideas about maintain this feature, I would like to know it.


Regards,
Aya Iwata
Hi,

> TODO:
> I will add the feature called "logging level" on next version patch. I will
> attach it as soon as possible.
I created v4 patch. Please find attached the patch.
This patch developed "logminlevel" parameter. level1 and level2 can be set, level1 is the default.
If level1 is set, it outputs the time in the functions. It helps to find out where it takes time.
If level2 is set, it outputs information on the protocol being exchanged in addition to level1 information.

I would appreciate if you could review my latest patch.

Regards,
Aya Iwata
Attachment
Hi,

I created v5 patch. Please find attached the patch.

This patch updated following items;
- Changed "else if" to "if" in traceLog_fprintf(). This means that both PQtrace() and new trace log are set, you can
getboth log result.

- Implemented loglevel with enum. This change makes it easier if you want to add new log levels.
- Checked http://commitfest.cputube.org/, I modified the code slightly.

I would appreciate if you could review my latest patch.


Regards,
Aya Iwata
Attachment
Hi,

I have developed a new libpq trace logging aimed at checking which side (server or client) is causing the performance
issue.

The new libpq trace log can do the following things;
- Setting whether to get log or not by using connection strings or environment variables. It means that application
sourcecode changes is not needed to get the log.

- Getting time when receive and send process start/end. Functions too.
- Setting log level; When level1(default) is set, it outputs the time in the function and connection time. When level2
isset, it outputs information on the protocol message being exchanged, in addition to level1 information.


I updated patch, but I am not sure if these changes and implementation are correct or not. So I need your comment and
advice.
I would appreciate your advice and develop/fix my patch further.

Regards,
Aya Iwata
Hi Iwata-san,

I used your patch for my private work, so I write my opinion and four feedback below.
On Fri, Jan 18, 2019 at 8:19 AM, Iwata, Aya wrote:
> - Setting whether to get log or not by using connection strings or environment
> variables. It means that application source code changes is not needed to get
> the log.
> - Getting time when receive and send process start/end. Functions too.
This merit was very helpful for my use, so I want your proposal function in postgres.

The followings are feedback from me.

1)
It would be better making the log format the same as the server log format, I think.
Your log format:
    2019/01/22 04:15:25.496 ...
Server log format:
    2019-01-22 04:15:25.496 UTC ...
There are two differences:
    One is separator character of date, "/" and "-".
    The another is standard time information.

2)
It was difficult for me to understand the first line message in the log file.
"Max log size is 10B, log min level is LEVEL1"
Does this mean as follows?
"The maximum size of this file is 10 Bytes, the parameter 'log min level' is set to LEVEL 1."

3)
Under the circumstance that the environment variables "PGLOGDIR" and "PGLOGSIZE" are set correctly,
the log file will also be created when the user connect the server with "psql".
Does this follow the specification you have thought?
Is there any option to unset only in that session when you want to connect with "psql"?

4)
Your patch affects the behavior of PQtrace().
The log of the existing PQtrace() is as follows:
From backend> "id"
From backend (#4)> 16387
From backend (#2)> 1
From backend (#4)> 23
...
Your patch makes PQtrace() including the following log in addition to the above.
To backend> Msg complete, length 27
Start sending message to backend:End sending message to backend:PQsendQuery end :PQgetResult start :Start receiving
messagefrom backend:End receiving message from backend:From backend> T

...


For your information.
Best regards,
---------------------
Ryohei Nagaura
Hi Nagaura-san,

Thank you for your review and advice.

> This merit was very helpful for my use, so I want your proposal function in
> postgres.
Thank you.

> 1)
> It would be better making the log format the same as the server log format,
> I think.
> Your log format:
>     2019/01/22 04:15:25.496 ...
> Server log format:
>     2019-01-22 04:15:25.496 UTC ...
> There are two differences:
>     One is separator character of date, "/" and "-".
>     The another is standard time information.
Sure. I will change separator character to "-" and add timezone information.

> 2)
> It was difficult for me to understand the first line message in the log file.
> "Max log size is 10B, log min level is LEVEL1"
> Does this mean as follows?
> "The maximum size of this file is 10 Bytes, the parameter 'log min level'
> is set to LEVEL 1."
Yes. The purpose of the line message is to check the value of the set parameter.
I will change it to you suggest.

> 3)
> Under the circumstance that the environment variables "PGLOGDIR" and
> "PGLOGSIZE" are set correctly, the log file will also be created when the
> user connect the server with "psql".
> Does this follow the specification you have thought?
> Is there any option to unset only in that session when you want to connect
> with "psql"?
There are no option to not output log when connected by "psql".
It is not good to create lots of empty files. I think that the cause of this issue is that the initialization location
ofthe new trace log is not good.

I will fix it so that logs are not output when connected to "psql".

> 4)
> Your patch affects the behavior of PQtrace().
> The log of the existing PQtrace() is as follows:
> From backend> "id"
> From backend (#4)> 16387
> From backend (#2)> 1
> From backend (#4)> 23
> ...
> Your patch makes PQtrace() including the following log in addition to the
> above.
> To backend> Msg complete, length 27
> Start sending message to backend:End sending message to backend:PQsendQuery
> end :PQgetResult start :Start receiving message from backend:End receiving
> message from backend:From backend> T ...
Thank you for finding it. I will fix not to affect PQtrace().

Regards,
Aya Iwata
Hi,

On 2018-11-28 23:20:03 +0100, Peter Eisentraut wrote:
> This does not excite me.  It seems mostly redundant with using tcpdump.

I think the one counter-argument to this is that using tcpdump in
real-world scenarios has become quite hard, due to encryption. Even with
access to the private key you cannot decrypt the stream.  Wonder if the
solution to that would be an option to write out the decrypted data into
a .pcap or such.

Greetings,

Andres Freund
On Thu, Feb 14, 2019 at 10:17 AM Andres Freund <andres@anarazel.de> wrote:
> On 2018-11-28 23:20:03 +0100, Peter Eisentraut wrote:
> > This does not excite me.  It seems mostly redundant with using tcpdump.
>
> I think the one counter-argument to this is that using tcpdump in
> real-world scenarios has become quite hard, due to encryption.

+1. Another difficulty is having the OS permissions to do the raw
packet dumps in the first place.

--Jacob
On February 14, 2019 6:16 PM +0000, Andres Freund wrote:

> Hi,

> On 2018-11-28 23:20:03 +0100, Peter Eisentraut wrote:
> > This does not excite me.  It seems mostly redundant with using tcpdump.

> I think the one counter-argument to this is that using tcpdump in real-world
> scenarios has become quite hard, due to encryption. Even with access to the
> private key you cannot decrypt the stream.  Wonder if the solution to that
> would be an option to write out the decrypted data into a .pcap or such.

I agree that network debug trace logs would be useful for users not knowledgeable
of postgres internals, so I understand the value of the feature,
as long as only necessary/digestible information is outputted.
I'll also check the patch later.

For Andres, I haven't looked into tcpdump yet, but I'd like to ask whether
or not the decrypted output to .pcap (if implemented) may be useful to
application users. What could be the limitations?
Could you explain a bit further on the idea?

Regards,
Kirk Jamison
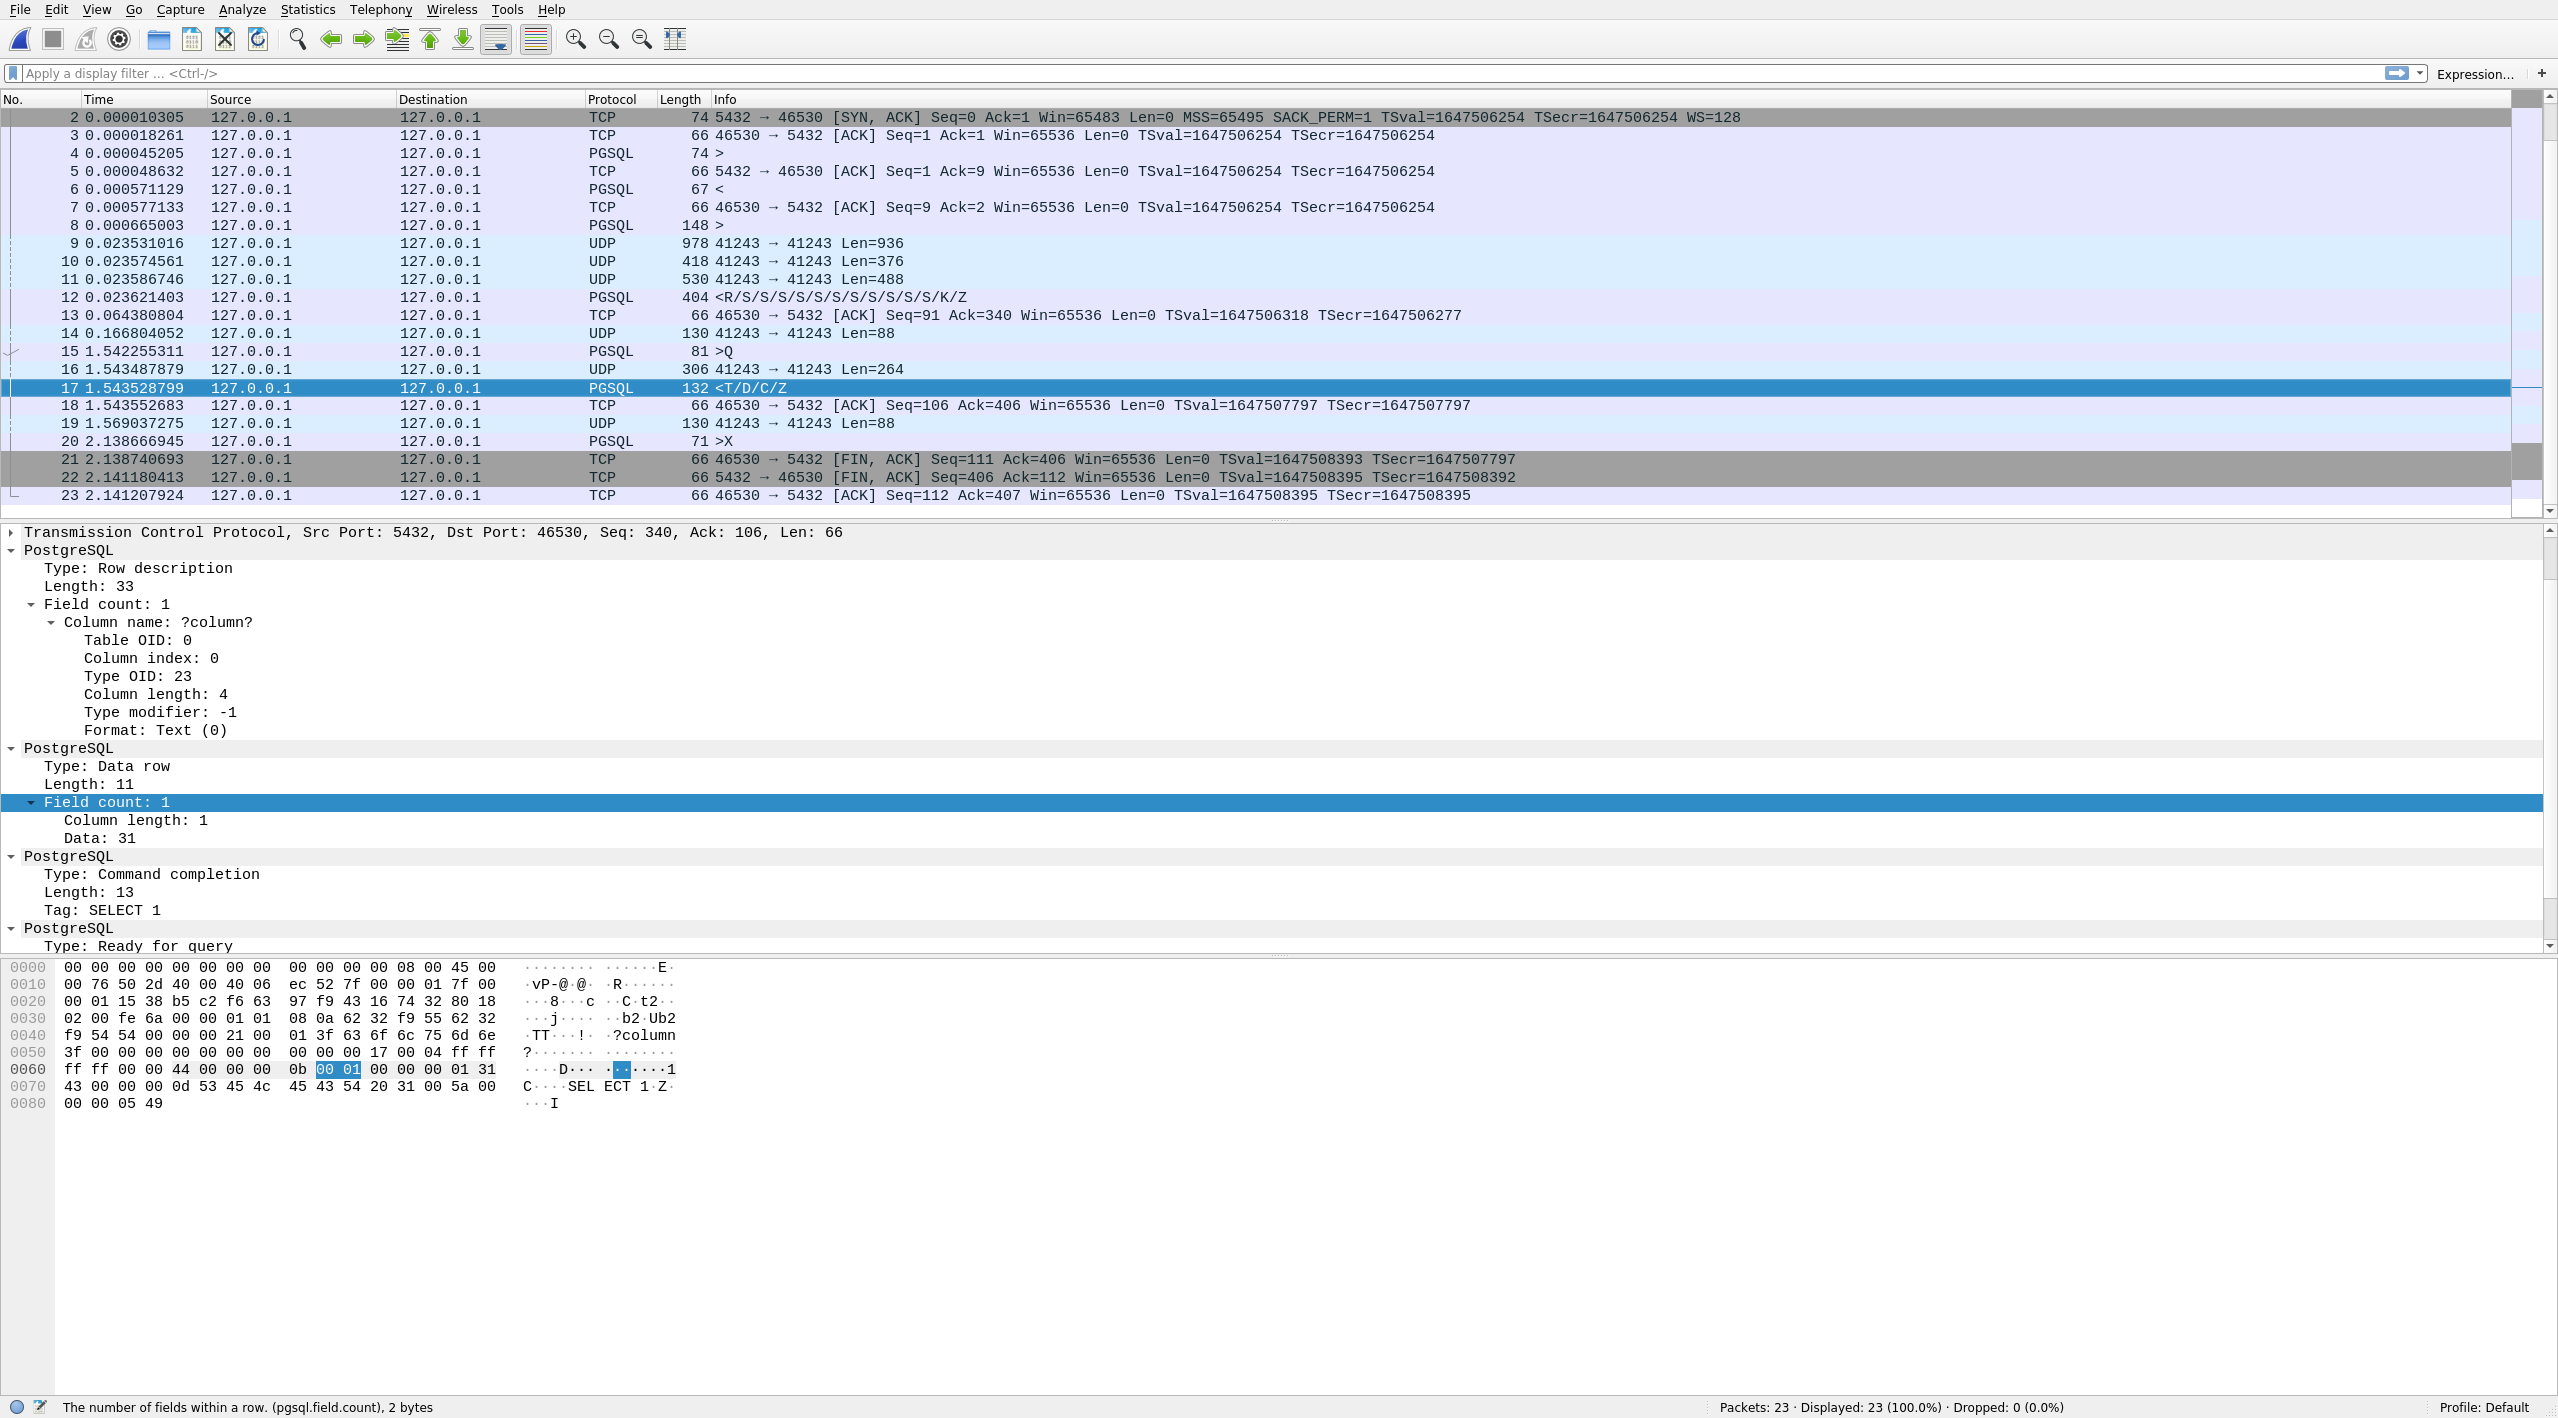
Hi,

On 2019-02-18 02:23:12 +0000, Jamison, Kirk wrote:
> For Andres, I haven't looked into tcpdump yet, but I'd like to ask whether
> or not the decrypted output to .pcap (if implemented) may be useful to
> application users. What could be the limitations?
> Could you explain a bit further on the idea?

Well, wireshark (and also tcpdump in a less comfortable manner) has a
dissector for the postgresql protocol. That allows to dig into various
parts. See e.g. the attached as an example of what you can see as the
response to a SELECT 1;

Right now that's not usable if the connection is via TLS, as pretty much
all encrypted connection use some form of forward secrecy, so even if
you had access the the private key, we'd not be able to parse it into an
unencrypted manner.

Greetings,

Andres Freund
Attachment
Hi,

Because I mistook something about how to reply to e-mails,
my last reply is not reflected in the thread.

Response to Nagaura san's review point, I fixed all his review notes, except for pointing out about psql.
Please see the attached updated patch.

> 1)
> It would be better making the log format the same as the server log format,
I changed date style and added timezone.

> 2)
> It was difficult for me to understand the first line message in the log file.
I changed the message as "The maximum size of this log is 3 Bytes, the parameter 'logminlevel' is set to level2  ".

> 3)
> Under the circumstance that the environment variables "PGLOGDIR" and
> "PGLOGSIZE" are set correctly, the log file will also be created when the
> user connect the server with "psql".
> Does this follow the specification you have thought?
> Is there any option to unset only in that session when you want to connect
> with "psql"?
By separating session using Tera Term or screen command, you can do what you want.
So I didn't make the code complicated by implementing the option.

> 4)
> Your patch affects the behavior of PQtrace().
Thank you. I fixed.

Regards,
Aya Iwata
Attachment
Hi,
I have tested the trace log implementation.Please find my feedback for the same.
Issues found while testing
---------------------------------
1) If invalid value is given to PGLOGMINLEVEL, empty log file is created which should not happen.
2) If log file size exceeds the value configured in PGLOGSIZE, new log file is not getting created.
3) If PGLOGSIZE is greater than 2048 bytes, log file is not created.Is this expected behaviour?
4) In the log file, an extra new line is present whenever the query is printed.Is this intentional?
5)Documentation for this feature is having grammatical errors and some spelling errors which can be looked into.
Feedback in the code
----------------------------------
1) if else statement should be used for checking log levels rather than multiple if statements
2) Across the code, sufficient space need to be left between parameters in functions and while using comparison operators
3) In libpq-fe.h in the comments section it should trace rather than trce
Suggestions
----------------------
-> Will it better if the logs of all processes are written to a single log file with the log message containing the process id rather than one log file per process?
Hi Iwata-san,

Currently, the patch fails to build according to CF app.
As you know, it has something to do with the misspelling of function.
GetTimezoneInformation --> GetTimeZoneInformation

It sounds more logical to me if there is a parameter that switches on/off the logging
similar to other postgres logs. I suggest trace_log as the parameter name.
Like, this parameter needs to be enabled for logdir, logsize and loglevel, etc. to work.
The default is off.

If you're going to introduce that parameter, then the docs should be updated as well.
i.e. "When <literal>trace_log</literal> is enabled, this parameter..."

How about changing the following parameter names:
logdir --> log_directory
logsize --> log_size
logminlevel --> log_min_level

If it's helpful, you might want to look into how the other postgres logs (i.e. syslogger)
allow setting either absolute or relative path for log directory, and how the parameters
cover some of the comments above by Ramanarayana.

Regards,
Kirk Jamison
On Mon, Feb 18, 2019 at 10:06 PM Jamison, Kirk <k.jamison@jp.fujitsu.com> wrote:
> It sounds more logical to me if there is a parameter that switches on/off the logging
> similar to other postgres logs. I suggest trace_log as the parameter name.

I'm not really sure that I like the design of this patch in any way.
But leaving that aside, trace_log seems like a poor choice of name,
because it's got two words telling you what kind of thing we are doing
(tracing, logging) and zero words describing the nature of the thing
being traced or logged (the wire protocol communication with the
client).  A tracing facility for the planner, or the executor, or any
other part of the system would have an equally good claim on the same
name.  That can't be right.

--
Robert Haas
EnterpriseDB: http://www.enterprisedb.com
The Enterprise PostgreSQL Company
Hi Ramanarayana,

Thank you for your review and suggestion. Please see the attached updated patch.

> Issues found while testing
>1) If invalid value is given to PGLOGMINLEVEL, empty log file is created which should not happen.
Thank you for your test. However in my dev environment, empty log file is not created.
Could you explain more detail about 1)? I will check it again.

>2) If log file size exceeds the value configured in PGLOGSIZE, new log file is not getting created.
About 2) (and may be 1) ), perhaps is this something like that?

There are my mistake about first line information of created log file
"The maximum size of this log is %s *Bytes*, the parameter 'logminlevel' is set to %s\n".
- Maximum size is not bytes but megabytes.
- Display logminlevel which set by user. Internally, an invalid value is not set to logminlevel.

So trust the created log file first line info, if you set PGLOGSIZE=1000 as the meaning of "set maximum log size to
1000Bytes",

a new file was not created even if it exceeds 1000 bytes.
If it is correct, I fixed the comment to output internal setting log maximum size and user setting value.

And if you set PGLOGMINLEVEL to invalid value (ex. "aaa"), it is not set to the parameter; The default value (level1)
isset internally.

I fixed first line comment to output notification " if invalid value, level1(default) is set".

>3) If PGLOGSIZE is greater than 2048 bytes, log file is not created. Is this expected behavior?
Yes. I limit log file size.

>4) In the log file, an extra new line is present whenever the query is printed. Is this intentional?
Thank you, I fixed.

>5)Documentation for this feature is having grammatical errors and some spelling errors which can be looked into.
Thank you. I am checking my documentation now. I will fix it.

> Feedback in the code
Thank you. I fixed my code issue.

> Suggestions
I'll consider that...
Could you explain more about the idea?

Regards,
Aya Iwata
Attachment
Hi Kirk,

> Currently, the patch fails to build according to CF app.
> As you know, it has something to do with the misspelling of function.
> GetTimezoneInformation --> GetTimeZoneInformation
Thank you. I fixed it. Please see my v7 patch.

Regards,
Aya Iwata
Hi Robert,

> I'm not really sure that I like the design of this patch in any way.
Aside from problems with my current documentation which I will fix,
could you explain more detail about the problem of the design?
I would like to improve my current implementation based from feedback.

Regards,
Aya Iwata
On Wednesday, February 20, 2019 12:56 PM GMT+9, Robert Haas wrote:

> On Mon, Feb 18, 2019 at 10:06 PM Jamison, Kirk <k.jamison@jp.fujitsu.com> wrote:
> > It sounds more logical to me if there is a parameter that switches
> > on/off the logging similar to other postgres logs. I suggest trace_log as the parameter name.

> I'm not really sure that I like the design of this patch in any way.
> But leaving that aside, trace_log seems like a poor choice of name,
> because it's got two words telling you what kind of thing we are doing
> (tracing, logging) and zero words describing the nature of the thing
> being traced or logged (the wire protocol communication with the client).
> A tracing facility for the planner, or the executor, or any other part
> of the system would have an equally good claim on the same name.  That
> can't be right.

Agreed about the argument with trace_log parameter name. I just shootout
a quick idea. I didn't think about it too deeply, but just thought of a
switch that will enable or disable the feature. So there are
definitely better names other than that. And as you suggested, should
describe specifically what the feature does.

Regards,
Kirk Jamison
On Thu, Feb 21, 2019 at 7:52 PM Iwata, Aya <iwata.aya@jp.fujitsu.com> wrote:
> > I'm not really sure that I like the design of this patch in any way.
> Aside from problems with my current documentation which I will fix,
> could you explain more detail about the problem of the design?
> I would like to improve my current implementation based from feedback.

Well, I believe that what you've got here is something that could,
perhaps, be occasionally useful.  However, I don't think it would be
useful to very many people very often, and we'd still have to maintain
the code, so that's not a great situation.

We already have a PQtrace() facility that could be improved, and it
has been previously suggested that you work on improving this facility
rather than inventing something new.  I still think that's a good
idea.  Instead you've created a second way of producing similar
information, and then coupled it to very specific ideas about how that
information should be logged: it is triggered by new libpq parameters,
there is log rotation logic, etc.  Those might not be right for
everyone, and there's no flexibility in the mechanism.

I am not sure that it's a good idea to have facilities that write to
the local filesystem that can be triggered by libpq parameters.  Seems
like that might have possible security consequences, or at least annoy
people who want to accept connection strings from users without having
to sanitize them for these sorts of options.

I do sometimes want to know  what's going on at the protocol level.
Sometimes it's possible to use wireshark for that (as mentioned
upthread) and when it isn't, the thing I'd really like is for the
command-line clients that already exist have an option to enable
PQtrace without me having to hack the C code.  We could go through and
add a long-form command-line option, --libpq-trace, to every
command-line tool we ship, for example.  Then we could, as a separate
patch, improve the format of that tracing output.  For me that would
be more useful than this.

I don't necessarily think there's anything deeply wrong with this
approach.  It's not like your patch will bring about the end of
civilization or anything like that.  It just doesn't excite me very
much.  And since I agree that we have a problem in this area, I would
ideally like to have a solution to that problem that I feel excited
about.

--
Robert Haas
EnterpriseDB: http://www.enterprisedb.com
The Enterprise PostgreSQL Company
Robert Haas <robertmhaas@gmail.com> writes:
> On Thu, Feb 21, 2019 at 7:52 PM Iwata, Aya <iwata.aya@jp.fujitsu.com> wrote:
>> Aside from problems with my current documentation which I will fix,
>> could you explain more detail about the problem of the design?

> We already have a PQtrace() facility that could be improved, and it
> has been previously suggested that you work on improving this facility
> rather than inventing something new.  I still think that's a good
> idea.

Me too.  PQtrace as currently constituted might be helpful for debugging
libpq itself, but it's nigh useless for any higher-level purpose.  I'd
gladly toss overboard any hypothetical use-case for what it does now,
in favor of having something that dumps stuff at the logical level of
messages.  (It's not even very consistent, because somebody did add a
more-or-less-message-level printout to pqSaveParameterStatus, which
I believe is duplicative of what fe-misc.c will print about the
same interaction at the byte level.)

> Instead you've created a second way of producing similar
> information, and then coupled it to very specific ideas about how that
> information should be logged: it is triggered by new libpq parameters,
> there is log rotation logic, etc.  Those might not be right for
> everyone, and there's no flexibility in the mechanism.

Good point.  To the extent that people want any of that, they'd probably
want to have application control over it.  Maybe, in addition to
PQtrace(FILE *) that'd just dump to a stdio stream, there should be a way
to create a callback similar to a notice-message hook, and let the
application implement such features in a custom callback.

> I am not sure that it's a good idea to have facilities that write to
> the local filesystem that can be triggered by libpq parameters.

Oy.  That seems like a *very* serious objection.  I agree with Robert's
thought that it'd be better to insist on application involvement in
enabling trace output.

            regards, tom lane
Hi,

Thank you for your comments and advice.

I'd like to consider your suggestions.
I am planning to change libpq logging like this;

1. Expand PQtrace() facility and improve libpq logging.

2. Prepare "output level". There are 3 type of levels;
    - TRADITIONAL    :  if set, outputs protocol messages
    - LEVEL1        :  if set, outputs phase and time
    - LEVEL2        :  if set, outputs both info TRADITIONAL and LEVEL1

3. Add "output phase" information; This is the processing flow. (ex. When PQexec() start and end )

4. Change output method to callback style; Default is stdout, and prepare other callback functions that will be used
morefrequently.


5. Initialization method;
In current one: PQtrace(PGconn *conn, FILE *stream);
Proposed change: PQtraceEx(PGconn *conn, FILE *stream, PQloggingProcessor callback_func , void *callback_arg,
PGLogminlevellevel);

PQtrace() can be use as it is to consider compatibility with previous applications,
so I leave PQtrace() and created a new function PQtraceEx().

After discussing the abovementioned, then maybe we can discuss more about enabling trace output and changing the output
style.

What do you think? I would appreciate your comments and suggestions.

Regards,
Aya Iwata
Hello.

I came up with some random comments.

At Mon, 4 Mar 2019 08:13:00 +0000, "Iwata, Aya" <iwata.aya@jp.fujitsu.com> wrote in
<71E660EB361DF14299875B198D4CE5423DEF1844@g01jpexmbkw25>
> Hi,
>
> Thank you for your comments and advice.
>
> I'd like to consider your suggestions.
> I am planning to change libpq logging like this;
>
> 1. Expand PQtrace() facility and improve libpq logging.
>
> 2. Prepare "output level". There are 3 type of levels;
>     - TRADITIONAL    :  if set, outputs protocol messages
>     - LEVEL1        :  if set, outputs phase and time
>     - LEVEL2        :  if set, outputs both info TRADITIONAL and LEVEL1

You appear to want to segregate the "traditional" output from
what you want to emit. At least Tom is explicitly suggesting to
throw away the hypothtical use cases for it. You may sort out
what kind of information you/we want to emit as log messages from
scratch:p

You may organize log kinds into hierachical levels like server
log messages or into orthogonal types that are individually
turned on. But it is not necessarily be a parameter of a logging
processor. (mentioned below)

> 3. Add "output phase" information; This is the processing flow. (ex. When PQexec() start and end )

What is the advantage of it against just two independent messages
like PQexec_start and PQexec_end? (I don't see any advantage.)

> 4. Change output method to callback style; Default is stdout, and prepare other callback functions that will be used
morefrequently.


Are you going to make something less-used the default behavior? I
think no one is opposing rich functionality as far as it is
replaceable.

> 5. Initialization method;
> In current one: PQtrace(PGconn *conn, FILE *stream);
> Proposed change: PQtraceEx(PGconn *conn, FILE *stream, PQloggingProcessor callback_func , void *callback_arg,
PGLogminlevellevel);


I'm not sure we should add a new *EX() function. Couldn't we
just change the signature of PQtrace()?

callback_funs seems to be a single function. I think it's better
to have individual function for each message type.  Not
callback_func(PQLOG_EXEC_START, param_1, param_2,...)  ,but
PQloggingProcessor.PQexec_start(param_1, param_2, ...).

It is because the caller can simply pass values in its own type
to the function without casting or other transformations and
their types are checked statically.

I also think it's better that logger-specific paramters are not
passed in this level.  Maybe stream and level are logger-specific
paratmer, which can be combined into callback_arg, or can be
given via an API function.

> PQtrace() can be use as it is to consider compatibility with previous applications,
> so I leave PQtrace() and created a new function PQtraceEx().
>
> After discussing the abovementioned, then maybe we can discuss more about enabling trace output and changing the
outputstyle.


I'm not sure what you mean by "output style" but you can change
everything by replacing the whole callback processor, which may
be a dynamic loaded file which is loaded by the instruction in
both ~/.libpqrc and some API, like PQloadLoggingProcessor()?


> What do you think? I would appreciate your comments and suggestions.

regards.

--
Kyotaro Horiguchi
NTT Open Source Software Center
On Mon, Mar 4, 2019 at 3:13 AM Iwata, Aya <iwata.aya@jp.fujitsu.com> wrote:
> 2. Prepare "output level". There are 3 type of levels;
>         - TRADITIONAL   :  if set, outputs protocol messages
>         - LEVEL1                :  if set, outputs phase and time
>         - LEVEL2                :  if set, outputs both info TRADITIONAL and LEVEL1

I am not impressed by this proposal.  I think what we should be
focusing on here is how to clearly display the contents of a message.
I think we should be looking for a way to display each message on a
single line in a way that indicates the data types of the constituent
fields.  For example, here's a DataRow message as output by PQtrace
today:

From backend> D
From backend (#4)> 42
From backend (#2)> 4
From backend (#4)> 6
From backend (6)> public
From backend (#4)> 4
From backend (4)> tab1
From backend (#4)> 5
From backend (5)> table
From backend (#4)> 5
From backend (5)> rhaas

What I'd like to see for a case like this is something like:

<<< 'D' 42 #4 6 'public' 4 'tab1' 5 'table' 5 'rhaas'

And here's a RowDescription message today:

From backend> T
From backend (#4)> 101
From backend (#2)> 4
From backend> "Schema"
From backend (#4)> 2615
From backend (#2)> 2
From backend (#4)> 19
From backend (#2)> 64
From backend (#4)> -1
From backend (#2)> 0
From backend> "Name"
From backend (#4)> 1259
From backend (#2)> 2
From backend (#4)> 19
From backend (#2)> 64
From backend (#4)> -1
From backend (#2)> 0
From backend> "Type"
From backend (#4)> 0
From backend (#2)> 0
From backend (#4)> 25
From backend (#2)> 65535
From backend (#4)> -1
From backend (#2)> 0
From backend> "Owner"
From backend (#4)> 0
From backend (#2)> 0
From backend (#4)> 19
From backend (#2)> 64
From backend (#4)> -1
From backend (#2)> 0

And I propose that it should look like this:

<<< 'T' 101 4 "Schema" 2615 #2 19 #64 -1 #0 "Name" 1259 #2 19 #64 -1
#0 "Owner" 0 #0 19 #64 -1 #0

The basic idea being:

- Each line is a whole message.
- The line begins with <<< for a message received and >>> for a message sent.
- Strings in single quotes are those sent/received as a fixed number of bytes.
- Strings in double quotes are those sent/received as a string.
- 4-byte integers are printed unadorned.
- 2-byte integers are prefixed by #.
- I guess 1-byte integers would need some other prefix, maybe @ or ##.

Now if we want to timestamp those lines too, that'd be fine:

2019-03-04 21:33:39.338 EST <<< 'T' 101 4 "Schema" 2615 #2 19 #64 -1
#0 "Name" 1259 #2 19 #64 -1 #0 "Owner" 0 #0 19 #64 -1 #0
2019-03-04 21:33:39.342 EST <<< 'D' 42 #4 6 'public' 4 'tab1' 5
'table' 5 'rhaas'

But I still don't really see a need for different levels or whatever.
I mean, you either want a dump of all of the protocol traffic, or you
don't, I think.  Or maybe I am confused as to what the goal of all
this really is.

--
Robert Haas
EnterpriseDB: http://www.enterprisedb.com
The Enterprise PostgreSQL Company
Robert Haas <robertmhaas@gmail.com> writes:
> The basic idea being:

> - Each line is a whole message.
> - The line begins with <<< for a message received and >>> for a message sent.

+1, though do we really need to repeat the direction marker thrice?

> - Strings in single quotes are those sent/received as a fixed number of bytes.
> - Strings in double quotes are those sent/received as a string.
> - 4-byte integers are printed unadorned.
> - 2-byte integers are prefixed by #.
> - I guess 1-byte integers would need some other prefix, maybe @ or ##.

I doubt that anybody gives a fig for those distinctions, except when
they're writing actual code that speaks the protocol --- and I do not
think that that's the target use-case.  So strings and integers seem
like plenty.  I'd also suggest that just because the protocol has
single-letter codes for message types doesn't mean that average users
have memorized those codes; and that framing data like the message
length is of no interest.

In short, rather than

    <<< 'T' 101 4 "Schema" 2615 #2 19 #64 -1 #0 "Name" 1259 #2 19 #64 -1 #0 "Owner" 0 #0 19 #64 -1 #0

I'd envision something more like

    < RowDescription "Schema" 2615 2 19 64 -1 0 "Name" 1259 2 19 64 -1 0 "Owner" 0 0 19 64 -1 0

> But I still don't really see a need for different levels or whatever.
> I mean, you either want a dump of all of the protocol traffic, or you
> don't, I think.  Or maybe I am confused as to what the goal of all
> this really is.

Yeah, me too.  But a lot of this detail would only be useful if you
were trying to diagnose something like a discrepancy between the server
and libpq as to the width of some field.  And the number of users for
that can be counted without running out of fingers.  I think what would
be of use for a trace facility is as high-level a view as possible of
the message contents.

Or, in other words: a large part of the problem with the existing PQtrace
facility is that it *was* designed to help debug libpq itself, and that
use-case is no longer very interesting.  We should assume that the library
knows how to parse protocol messages.

            regards, tom lane
On Mon, Mar 4, 2019 at 10:25 PM Tom Lane <tgl@sss.pgh.pa.us> wrote:
> Robert Haas <robertmhaas@gmail.com> writes:
> > The basic idea being:
> > - Each line is a whole message.
> > - The line begins with <<< for a message received and >>> for a message sent.
>
> +1, though do we really need to repeat the direction marker thrice?

Perhaps not.

> > - Strings in single quotes are those sent/received as a fixed number of bytes.
> > - Strings in double quotes are those sent/received as a string.
> > - 4-byte integers are printed unadorned.
> > - 2-byte integers are prefixed by #.
> > - I guess 1-byte integers would need some other prefix, maybe @ or ##.
>
> I doubt that anybody gives a fig for those distinctions, except when
> they're writing actual code that speaks the protocol --- and I do not
> think that that's the target use-case.  So strings and integers seem
> like plenty.  I'd also suggest that just because the protocol has
> single-letter codes for message types doesn't mean that average users
> have memorized those codes; and that framing data like the message
> length is of no interest.

I don't agree with that.  For one thing, I'm someone, and I give a fig.

I would put it this way: with a very small amount of additional
notation it's possible to preserve the level of detail that we have
currently, and I think that's worth it.  Your proposed format for the
sample message I showed is very slightly shorter, which will almost
certainly not matter to anyone, but it leaves some slight ambiguity
about what was happening at the protocol level, which might.  If you
don't care, the additional detail in my proposed format is easy enough
to ignore.

--
Robert Haas
EnterpriseDB: http://www.enterprisedb.com
The Enterprise PostgreSQL Company
Hi Horiguchi-san,

Thank you for your reply and suggestions.

> > 1. Expand PQtrace() facility and improve libpq logging.
> >
> > 2. Prepare "output level". There are 3 type of levels;
> >     - TRADITIONAL    :  if set, outputs protocol messages
> >     - LEVEL1        :  if set, outputs phase and time
> >     - LEVEL2        :  if set, outputs both info TRADITIONAL and LEVEL1
>
> You appear to want to segregate the "traditional" output from what you want
> to emit. At least Tom is explicitly suggesting to throw away the hypothtical
> use cases for it. You may sort out what kind of information you/we want to
> emit as log messages from scratch:p
>
> You may organize log kinds into hierachical levels like server log messages
> or into orthogonal types that are individually turned on. But it is not
> necessarily be a parameter of a logging processor. (mentioned below)

It is intended for old application users who use PQtrace() expect the existing/default/traditional log output style.
That’s why I separated other information(ex. phase and timestamp).
But since you mentioned the level is not necessary,
I will follow your advice and include those information in the reformatted PQtrace().


> > 3. Add "output phase" information; This is the processing flow. (ex.
> > When PQexec() start and end )
>
> What is the advantage of it against just two independent messages like
> PQexec_start and PQexec_end? (I don't see any advantage.)

I think the purpose of this logging improvement is to make it useful for analysis at performance deterioration.
When query delay happens, we want to know from which side(server or client) is the cause of it,
and then people want to know which process takes time.
I think the phase and time information are useful for diagnosis.
For example, when command processing function (ex. PQexec()) etc. start/end
and when client receive/send protocol messages.
/*my intended output here */


> > 4. Change output method to callback style; Default is stdout, and prepare
> other callback functions that will be used more frequently.
>
> Are you going to make something less-used the default behavior? I think no
> one is opposing rich functionality as far as it is replaceable.
I am sorry, my explanation was not clear.
I just wanted to say I intend to provide several output method functions which users likely need.
ex. output to stdout, or output to file, or output to log directory.


> > 5. Initialization method;
> > In current one: PQtrace(PGconn *conn, FILE *stream); Proposed change:
> > PQtraceEx(PGconn *conn, FILE *stream, PQloggingProcessor callback_func
> > , void *callback_arg, PGLogminlevel level);
>
> I'm not sure we should add a new *EX() function. Couldn't we just change the
> signature of PQtrace()?
I intended to add new *EX() function for compatibility purposes specially for old version of libpq.
I would like to avoid making changes to old applications for this.
But if we insist on changing the PQtrace() itself, then I will follow your advice.

>
> callback_funs seems to be a single function. I think it's better to have
> individual function for each message type.  Not
> callback_func(PQLOG_EXEC_START, param_1, param_2,...)  ,but
> PQloggingProcessor.PQexec_start(param_1, param_2, ...).
>
> It is because the caller can simply pass values in its own type to the function
> without casting or other transformations and their types are checked
> statically.
>
> I also think it's better that logger-specific paramters are not passed in
> this level.  Maybe stream and level are logger-specific paratmer, which can
> be combined into callback_arg, or can be given via an API function.

Thank you for your advice. I will consider it.

Regards,
Aya Iwata
Hi everyone,

I appreciate all the helpful advice.

I agree to display message more clearly. I will follow your advice.

I would like to add timestamp per line and when command processing function start/end.
I think it is useful to know the application process start/end for diagnosis.
So I will implement like this;

2019-03-03 07:24:54.142 UTC   PQgetResult start
2019-03-03 07:24:54.143 UTC   < 'T' 35 1 "set_config" 0 #0 25 #65535 -1 #0
2019-03-03 07:24:54.144 UTC   PQgetResult end


> > But I still don't really see a need for different levels or whatever.
> > I mean, you either want a dump of all of the protocol traffic, or you
> > don't, I think.  Or maybe I am confused as to what the goal of all
> > this really is.
>
> Yeah, me too.  But a lot of this detail would only be useful if you were trying
> to diagnose something like a discrepancy between the server and libpq as to
> the width of some field.  And the number of users for that can be counted
> without running out of fingers.  I think what would be of use for a trace
> facility is as high-level a view as possible of the message contents.
>
> Or, in other words: a large part of the problem with the existing PQtrace
> facility is that it *was* designed to help debug libpq itself, and that
> use-case is no longer very interesting.  We should assume that the library
> knows how to parse protocol messages.

Since I explained the reason in the previous email, I am copy-pasting it again here.

I think the purpose of the leveling is to provide an optional information for the user,
which is useful for diagnosis during the performance deterioration.
When query delay happens, we want to know from which side(server or client) is the cause of it,
and then people want to know which process takes time.
I think the phase and time information are useful for diagnosis.
For example, when command processing function (ex. PQexec()) etc. start/end
and when client receive/send protocol messages.

So is it alright to add these information to the new/proposed PQtrace() default output?


Regards,
Aya Iwata
On 3/5/19 11:48 AM, Iwata, Aya wrote:
>
> So is it alright to add these information to the new/proposed PQtrace() default output?

I agree with Andres [1] that it's not very clear where this patch is
going and we should push the target to PG13.

Regards,
--
-David
david@pgmasters.net

[1]
https://www.postgresql.org/message-id/raw/20190214203752.t4hl574k6jlu4t25%40alap3.anarazel.de
On 3/5/19 5:28 PM, David Steele wrote:
> On 3/5/19 11:48 AM, Iwata, Aya wrote:
>>
>> So is it alright to add these information to the new/proposed
>> PQtrace() default output?
>
> I agree with Andres [1] that it's not very clear where this patch is
> going and we should push the target to PG13.

Hearing no opinions to the contrary, I have set the target version to PG13.

Regards,
--
-David
david@pgmasters.net
Hi,

> The basic idea being:
>
> - Each line is a whole message.
> - The line begins with <<< for a message received and >>> for a message sent.
> - Strings in single quotes are those sent/received as a fixed number of bytes.
> - Strings in double quotes are those sent/received as a string.
> - 4-byte integers are printed unadorned.
> - 2-byte integers are prefixed by #.
> - I guess 1-byte integers would need some other prefix, maybe @ or ##.

I created v1 patch to improve PQtrace(); output log message in one line.
Please find my attached patch.


Log output examples;

In current PQtrace log:

To backend> Msg Q


To backend> "SELECT pg_catalog.set_config('search_path', '', false)"
To backend> Msg complete, length 60

I changed like this:

2019-04-04 02:39:51.488 UTC  > Query 59 "SELECT pg_catalog.set_config('search_path', '', false)"

In current PQtrace log:

From backend> T
From backend (#4)> 35
From backend (#2)> 1
From backend> "set_config"
From backend (#4)> 0
From backend (#2)> 0
From backend (#4)> 25
From backend (#2)> 65535
From backend (#4)> -1
From backend (#2)> 0

I changed like this:

2019-04-04 02:39:51.489 UTC  < RowDescription 35 #1 "set_config" 0 #0 25 #65535 -1 #0


> I would like to add timestamp per line and when command processing function
> start/end.
> I think it is useful to know the application process start/end for diagnosis.
> So I will implement like this;
>
> 2019-03-03 07:24:54.142 UTC   PQgetResult start
> 2019-03-03 07:24:54.143 UTC   < 'T' 35 1 "set_config" 0 #0 25 #65535 -1 #0
> 2019-03-03 07:24:54.144 UTC   PQgetResult end
I would like to add this in next patch if there are not any disagreement.

Regards,
Aya Iwata
Attachment
Hi,

I update patch to improve PQtrace(); output log message in one line.
Please find my attached patch.

How it changed:
> > The basic idea being:
> >
> > - Each line is a whole message.
> > - The line begins with <<< for a message received and >>> for a message
> sent.
> > - Strings in single quotes are those sent/received as a fixed number of
> bytes.
> > - Strings in double quotes are those sent/received as a string.
> > - 4-byte integers are printed unadorned.
> > - 2-byte integers are prefixed by #.
> > - I guess 1-byte integers would need some other prefix, maybe @ or ##.

New log output examples:
The message sent from frontend is like this;
2019-04-04 02:39:51.488 UTC  > Query 59 "SELECT pg_catalog.set_config('search_path', '', false)"

The message sent from backend is like this;
2019-04-04 02:39:51.489 UTC  < RowDescription 35 #1 "set_config" 0 #0 25 #65535 -1 #0


Regards,
Aya Iwata
Attachment
Hello. Thank you for the new patch.

At Tue, 9 Apr 2019 06:19:32 +0000, "Iwata, Aya" <iwata.aya@jp.fujitsu.com> wrote in
<71E660EB361DF14299875B198D4CE5423DF161BA@g01jpexmbkw25>
> Hi,
>
> I update patch to improve PQtrace(); output log message in one line.
> Please find my attached patch.
>
> How it changed:
> > > The basic idea being:
> > >
> > > - Each line is a whole message.
> > > - The line begins with <<< for a message received and >>> for a message
> > sent.
> > > - Strings in single quotes are those sent/received as a fixed number of
> > bytes.
> > > - Strings in double quotes are those sent/received as a string.
> > > - 4-byte integers are printed unadorned.
> > > - 2-byte integers are prefixed by #.
> > > - I guess 1-byte integers would need some other prefix, maybe @ or ##.
>
> New log output examples:
> The message sent from frontend is like this;
> 2019-04-04 02:39:51.488 UTC  > Query 59 "SELECT pg_catalog.set_config('search_path', '', false)"
>
> The message sent from backend is like this;
> 2019-04-04 02:39:51.489 UTC  < RowDescription 35 #1 "set_config" 0 #0 25 #65535 -1 #0

I had a brief look on this.

+/* protocol message name */
+static char *command_text_b[] = {

Couldn't the name be more descriptive? The comment just above
doesn't seem consistent with the variable.  The tables are very
sparse. I think the definition could be in more compact form.

+    /* y */ 0,
+    /* z */ 0
+};
+#define COMMAND_BF_MAX (sizeof(command_text_bf) / sizeof(*command_text_bf))

It seems that at least the trailing 0-elements are not required.


+ * message_get_command_text:
+ *     Get Protocol message text from byte1 identifier
+ */
+static char *
+message_get_command_text(unsigned char c, CommunicationDirection direction)
..
+message_nchar(PGconn *conn, const char *v, int length, CommunicationDirection direction)

Also the function names are not very descriptive.

+message_Int(PGconn *conn, int v, int length, CommunicationDirection direct)

We are not using names mixing CamelCase and undercored there.


+    if (c >= 0 && c < COMMAND_BF_MAX)
+    {
+        text = command_text_bf[c];
+        if (text)
+            return text;
+    }
+
+    if (direction == FROM_BACKEND && c >= 0 && c < COMMAND_B_MAX)
+    {
+        text = command_text_b[c];
+        if (text)
..
+    if (direction == FROM_FRONTEND && c >= 0 && c < COMMAND_F_MAX)


This code is assuming that elements of command_text_bf is
mutually exclusive with command_text_b or _bf. That is, the first
has an element for 'C', others don't have an element in the same
position. But _bf[C] = "CommandComplete" and _f[C] = "Close". Is
it working correctly?

+typedef enum CommunicationDirection

The type CommunicationDirection is two-member enum which is
equivalent to just a boolean. Is there a reason you define that?

+typedef enum State
+typedef enum Type

The name is too generic.
+typedef struct _LoggingMsg
...
+} LoggingMsg;

Why the tag name is prefixed with an underscore?

+typedef struct _Frontend_Entry

The name doesn't give an idea of its characteristics.


regards.

--
Kyotaro Horiguchi
NTT Open Source Software Center
Hi Horiguchi-san,

Thank you for your reviewing.
I updated patch. Please see my attached patch.

> +/* protocol message name */
> +static char *command_text_b[] = {
>
> Couldn't the name be more descriptive? The comment just above doesn't seem
> consistent with the variable.  The tables are very sparse. I think the
> definition could be in more compact form.
Thank you. I changed the description more clear.

>
> +    /* y */ 0,
> +    /* z */ 0
> +};
> +#define COMMAND_BF_MAX (sizeof(command_text_bf) /
> +sizeof(*command_text_bf))
>
> It seems that at least the trailing 0-elements are not required.
Sure. I removed.

> + * message_get_command_text:
> + *     Get Protocol message text from byte1 identifier
> + */
> +static char *
> +message_get_command_text(unsigned char c, CommunicationDirection
> +direction)
> ..
> +message_nchar(PGconn *conn, const char *v, int length,
> +CommunicationDirection direction)
>
> Also the function names are not very descriptive.
Thank you. I fixed function names and added descriptions.

>
> +message_Int(PGconn *conn, int v, int length, CommunicationDirection
> +direct)
>
> We are not using names mixing CamelCase and undercored there.
>
>
> +    if (c >= 0 && c < COMMAND_BF_MAX)
> +    {
> +        text = command_text_bf[c];
> +        if (text)
> +            return text;
> +    }
> +
> +    if (direction == FROM_BACKEND && c >= 0 && c < COMMAND_B_MAX)
> +    {
> +        text = command_text_b[c];
> +        if (text)
> ..
> +    if (direction == FROM_FRONTEND && c >= 0 && c < COMMAND_F_MAX)
>
>
> This code is assuming that elements of command_text_bf is mutually exclusive
> with command_text_b or _bf. That is, the first has an element for 'C', others
> don't have an element in the same position. But _bf[C] = "CommandComplete"
> and _f[C] = "Close". Is it working correctly?
Elements sent from both the backend and the frontend are 'c' and 'd'.
There is no same elements in protocol_message_type_b and _bf.
The same applies to protocol_message_type_f and _bf too. So I think it is working correctly.


> +typedef enum CommunicationDirection
>
> The type CommunicationDirection is two-member enum which is equivalent to
> just a boolean. Is there a reason you define that?
>
> +typedef enum State
> +typedef enum Type
>
> The name is too generic.
> +typedef struct _LoggingMsg
> ...
> +} LoggingMsg;
>
> Why the tag name is prefixed with an underscore?
>
> +typedef struct _Frontend_Entry
>
> The name doesn't give an idea of its characteristics.
Thank you. I fixed.

Regards,
Aya Iwata
Attachment
Hi Aya-san,

I tested your v3 patch and it seemed to work on my Linux environment.
However, the CF Patch Tester detected a build failure (probably on Windows).
Refer to: http://commitfest.cputube.org/

Docs:
It would be better to have reference to the documentations of
Frontend/Backend Protocol's "Message Format".

Code:
There are some protocol message types from frontend
that you missed indicating (non BYTE1 types):
CancelRequest (F), StartupMessage (F), SSLRequest (F).

Although I haven't tested those actual protocols,
I assume it will be printed as the following since the length and
message will still be recognized.
ex. Timestamp 8 80877103

So you need to indicate these protocol message types as intended.
ex. Timestamp > SSLRequest 8 80877103


Regards,
Kirk Jamison
Hi Kirk,

Thank you for your reviewing.

> Docs:
> It would be better to have reference to the documentations of Frontend/Backend
> Protocol's "Message Format".
I added a link to "Protocol's Message Formats" and little explanation to PQtrace() documentation.

> Code:
> There are some protocol message types from frontend that you missed indicating
> (non BYTE1 types):
> CancelRequest (F), StartupMessage (F), SSLRequest (F).
>
> Although I haven't tested those actual protocols, I assume it will be printed
> as the following since the length and message will still be recognized.
> ex. Timestamp 8 80877103
>
> So you need to indicate these protocol message types as intended.
> ex. Timestamp > SSLRequest 8 80877103
Thank you. I changed code to output these information.
For that, I added code to check the int32 content which  StartupMessage (F) and SSLRequest (F) have.
And CancelRequest is not targeted because it calls send() directly.

Regards,
Aya Iwata
Attachment
Hi,

I rebased my patch from head. Please find my attached patch.

Regard,
Aya Iwata
Attachment
Hi,

This is a summary of the whole thread.
I am currently improving PQtrace() by adjusting its output to one line per protocol message as per the advice of
reviewers.

Purpose:
If a problem occurs, such as a slow query, you want to know which query takes time.
In Current libpq, there is PQtrace(FILE *filename) facility to output exchanging protocol messages to file.
But I think current PQtrace() has following issues:
* The output is confusing. It is difficult to analyze information because it is printed one by one, and only a
characterrepresenting a message (ex. printed 'T' means RowDescription).

* Timestamp is not output. So we cannot identify which process took a long time. That would be possible when we compare
timestamps.
* PQtrace() code must be included in libpq application's source code. If you want to get log, you should change code
andre-compile it for logging. Some application cannot do this.


Compared to tcpdump:
There is tcpdump for similar use, but it has the following problems:
- Windows users cannot use it.
- If the communication is encrypted, it is possible that you may not see the information you want as explained by
Andres.
- Information can only be retrieved by limited users due to OS permissions.

Solution:
Work on following improvements in order:
1. Adjusting it to emit one line per protocol message and output timestamp.
2. Enables logging control without recompiling the application.
   I thought it would be better to control it with parameters. However since this method is controversial (Security
implications,etc.), we will consider a good method after completing 1.


Latest patch just contains 1. Hence, the usage of this feature is the same as current PQtrace().

Example of log output:
In current PQtrace log:

To backend> Msg Q


To backend> "SELECT pg_catalog.set_config('search_path', '', false)"
To backend> Msg complete, length 60

I changed like this:

2019-04-04 02:39:51.488 UTC  > Query 59 "SELECT pg_catalog.set_config('search_path', '', false)"

I appreciate your advice regarding the one line protocol message. Thank you in advance.

Regards,
Aya Iwata
Attachment
Hello,

Nice patch.  I think there's pretty near consensus that this is
something we want, and that the output format of one trace msg per libpq
msg is roughly okay.  (I'm not sure there's 100% agreement on this last
point, but it seems close enough.)

> I changed like this:
>
> 2019-04-04 02:39:51.488 UTC  > Query 59 "SELECT pg_catalog.set_config('search_path', '', false)"

The "59" there seems quite odd, though.

* What is this in pg_conn?  I don't understand why this array is of size
  MAXPGPATH.
+    PGFrontendLogMsgEntry frontend_entry[MAXPGPATH];
  This seems to make pg_conn much larger than we'd like.

Minor review points:

* Do we need COMMAND_B_MIN etc to reduce the number of zeroes at the
beginning of the tables?

* The place where you define TRACELOG_TIME_SIZE seems like it'll be
  unavoidably out of date if somebody changes the format string.  I'd put
  that #define next to where the fmt appears.

* "output a a null-terminated" has duplicated "a"

* We don't add braces around single-statement blocks (pqPutMsgEnd)

* Please pgindent.


Thanks

--
Álvaro Herrera                https://www.2ndQuadrant.com/
PostgreSQL Development, 24x7 Support, Remote DBA, Training & Services
Hello,

Thank you for your review.
I update patch. Please find attached my patch.


> > 2019-04-04 02:39:51.488 UTC  > Query 59 "SELECT
> pg_catalog.set_config('search_path', '', false)"
>
> The "59" there seems quite odd, though.
Could you explain more detail about this?

"59" is length of protocol message contents. (It does not contain first 1 byte.)
This order is based on the message format.
https://www.postgresql.org/docs/current/protocol-message-formats.html


> * What is this in pg_conn?  I don't understand why this array is of size
>   MAXPGPATH.
> +    PGFrontendLogMsgEntry frontend_entry[MAXPGPATH];
>   This seems to make pg_conn much larger than we'd like.
Sure. I remove this and change code to use list.

> Minor review points:
I accept all these review points.

Regards,
Aya Iwata
Attachment
Hello Aya Iwata,

I like this patch, and I think we should have it.  I have updated it, as
it had conflicts.

In 0002, I remove use of ftime(), because that function is obsolete.
However, with that change we lose printing of milliseconds in the trace
lines.  I think that's not great, but I also think we can live without
them until somebody gets motivated to write the code for that.  It seems
a little messy so I'd prefer to leave that for a subsequent commit.
(Maybe we can just use pg_strftime.)

Looking at the message type tables, I decided to get rid of the "bf"
table, which had only two bytes, and instead put CopyData and CopyDone
in the other two tables.  That seems simpler.  Also, the COMMAND_x_MAX
macros were a bit pointless; I just expanded at the only caller of each,
using lengthof().  And since the message type is unsigned, there's no
need to do "c >= 0" since it must always be true.

I added setlinebuf() to the debug file.  Works better than without,
because "tail -f /tmp/libpqtrace.log" works as you'd expect.

One thing that it might be good to do is to avoid creating the message
type tables as const but instead initialize them if and only if tracing
is enabled, on the first call.  I think that would not only save space
in the constant area of the library for the 99.99% of the cases where
tracing isn't used, but also make the initialization code be more
sensible (since presumably you wouldn't have to initialize all the
zeroes.)

Opinions?  I experimented by patching psql as below (not intended for
commit) and it looks good.  Only ErrorResponse prints the terminator as
a control character, or something:

2020-09-16 13:27:29.072 -03  < ErrorResponse 117 S "ERROR" V "ERROR" C "42704" M "no existe el slot de replicación
«foobar»"F "slot.c" L "408" R "ReplicationSlotAcquireInternal" ^@


diff --git a/src/bin/psql/startup.c b/src/bin/psql/startup.c
index 8232a0143b..01728ba8e8 100644
--- a/src/bin/psql/startup.c
+++ b/src/bin/psql/startup.c
@@ -301,6 +301,11 @@ main(int argc, char *argv[])

     psql_setup_cancel_handler();

+    {
+        FILE *trace = fopen("/tmp/libpqtrace.log", "a+");
+        PQtrace(pset.db, trace);
+    }
+
     PQsetNoticeProcessor(pset.db, NoticeProcessor, NULL);

     SyncVariables();

--
Álvaro Herrera                https://www.2ndQuadrant.com/
PostgreSQL Development, 24x7 Support, Remote DBA, Training & Services
Attachment
Hi Alvaro san,

Thank you for your update :)

> Opinions?  I experimented by patching psql as below (not intended for
> commit) and it looks good.  Only ErrorResponse prints the terminator as a
> control character, or something:
I check code, changes and email. I agree with all of this.
I will review code, feature and performance if it is needed more closely.
(I'll start it next week.)

Regards,
Aya Iwata

> -----Original Message-----
> From: Alvaro Herrera <alvherre@2ndquadrant.com>
> Sent: Thursday, September 17, 2020 5:42 AM
> To: Iwata, Aya/岩田 彩 <iwata.aya@fujitsu.com>
> Cc: pgsql-hackers@postgresql.org; tgl@sss.pgh.pa.us;
> robertmhaas@gmail.com; pchampion@pivotal.io; jdoty@pivotal.io;
> raam.soft@gmail.com; Nagaura, Ryohei/永浦 良平
> <nagaura.ryohei@fujitsu.com>; nagata@sraoss.co.jp;
> peter.eisentraut@2ndquadrant.com; 'Kyotaro HORIGUCHI'
> <horiguchi.kyotaro@lab.ntt.co.jp>; Jamison, Kirk/ジャミソン カーク
> <k.jamison@fujitsu.com>
> Subject: Re: libpq debug log
>
> Hello Aya Iwata,
>
> I like this patch, and I think we should have it.  I have updated it, as it had
> conflicts.
>
> In 0002, I remove use of ftime(), because that function is obsolete.
> However, with that change we lose printing of milliseconds in the trace lines.
> I think that's not great, but I also think we can live without them until
> somebody gets motivated to write the code for that.  It seems a little messy
> so I'd prefer to leave that for a subsequent commit.
> (Maybe we can just use pg_strftime.)
>
> Looking at the message type tables, I decided to get rid of the "bf"
> table, which had only two bytes, and instead put CopyData and CopyDone in
> the other two tables.  That seems simpler.  Also, the COMMAND_x_MAX
> macros were a bit pointless; I just expanded at the only caller of each, using
> lengthof().  And since the message type is unsigned, there's no need to do "c
> >= 0" since it must always be true.
>
> I added setlinebuf() to the debug file.  Works better than without, because
> "tail -f /tmp/libpqtrace.log" works as you'd expect.
>
> One thing that it might be good to do is to avoid creating the message type
> tables as const but instead initialize them if and only if tracing is enabled, on
> the first call.  I think that would not only save space in the constant area of
> the library for the 99.99% of the cases where tracing isn't used, but also make
> the initialization code be more sensible (since presumably you wouldn't have
> to initialize all the
> zeroes.)
>
> Opinions?  I experimented by patching psql as below (not intended for
> commit) and it looks good.  Only ErrorResponse prints the terminator as a
> control character, or something:
>
> 2020-09-16 13:27:29.072 -03  < ErrorResponse 117 S "ERROR" V "ERROR" C
> "42704" M "no existe el slot de replicación «foobar»" F "slot.c" L "408" R
> "ReplicationSlotAcquireInternal" ^@
>
>
> diff --git a/src/bin/psql/startup.c b/src/bin/psql/startup.c index
> 8232a0143b..01728ba8e8 100644
> --- a/src/bin/psql/startup.c
> +++ b/src/bin/psql/startup.c
> @@ -301,6 +301,11 @@ main(int argc, char *argv[])
>
>      psql_setup_cancel_handler();
>
> +    {
> +        FILE *trace = fopen("/tmp/libpqtrace.log", "a+");
> +        PQtrace(pset.db, trace);
> +    }
> +
>      PQsetNoticeProcessor(pset.db, NoticeProcessor, NULL);
>
>      SyncVariables();
>
> --
> Álvaro Herrera                https://www.2ndQuadrant.com/
> PostgreSQL Development, 24x7 Support, Remote DBA, Training & Services
At Wed, 16 Sep 2020 17:41:55 -0300, Alvaro Herrera <alvherre@2ndquadrant.com> wrote in
> Hello Aya Iwata,
>
> I like this patch, and I think we should have it.  I have updated it, as
> it had conflicts.
>
> In 0002, I remove use of ftime(), because that function is obsolete.
> However, with that change we lose printing of milliseconds in the trace
> lines.  I think that's not great, but I also think we can live without
> them until somebody gets motivated to write the code for that.  It seems
> a little messy so I'd prefer to leave that for a subsequent commit.
> (Maybe we can just use pg_strftime.)
>
> Looking at the message type tables, I decided to get rid of the "bf"
> table, which had only two bytes, and instead put CopyData and CopyDone
> in the other two tables.  That seems simpler.  Also, the COMMAND_x_MAX
> macros were a bit pointless; I just expanded at the only caller of each,
> using lengthof().  And since the message type is unsigned, there's no
> need to do "c >= 0" since it must always be true.
>
> I added setlinebuf() to the debug file.  Works better than without,
> because "tail -f /tmp/libpqtrace.log" works as you'd expect.
>
> One thing that it might be good to do is to avoid creating the message
> type tables as const but instead initialize them if and only if tracing
> is enabled, on the first call.  I think that would not only save space
> in the constant area of the library for the 99.99% of the cases where
> tracing isn't used, but also make the initialization code be more
> sensible (since presumably you wouldn't have to initialize all the
> zeroes.)
>
> Opinions?  I experimented by patching psql as below (not intended for
> commit) and it looks good.  Only ErrorResponse prints the terminator as
> a control character, or something:
>
> 2020-09-16 13:27:29.072 -03  < ErrorResponse 117 S "ERROR" V "ERROR" C "42704" M "no existe el slot de replicación
«foobar»"F "slot.c" L "408" R "ReplicationSlotAcquireInternal" ^@
>
>
> diff --git a/src/bin/psql/startup.c b/src/bin/psql/startup.c
> index 8232a0143b..01728ba8e8 100644
> --- a/src/bin/psql/startup.c
> +++ b/src/bin/psql/startup.c
> @@ -301,6 +301,11 @@ main(int argc, char *argv[])
>
>      psql_setup_cancel_handler();
>
> +    {
> +        FILE *trace = fopen("/tmp/libpqtrace.log", "a+");
> +        PQtrace(pset.db, trace);
> +    }
> +
>      PQsetNoticeProcessor(pset.db, NoticeProcessor, NULL);
>
>      SyncVariables();

I saw that version and have some comments.

+pqGetProtocolMsgType(unsigned char c, PGCommSource commsource)
+{
+    const char *message_type;

Compiler complains that this is unused.

+static const char *
+pqGetProtocolMsgType(unsigned char c, PGCommSource commsource)
+{
...
+    else
+        return "UnknownCommand";
+}

Compiler complains as "control reached end of non-void function"


+pqLogMsgString(PGconn *conn, const char *v, int length, PGCommSource commsource)
+{
+    if (length < 0)
+        length = strlen(v) + 1;
+
+    if (PG_PROTOCOL_MAJOR(conn->pversion) >= 3)
+    {
+        switch (conn->logging_message.state)
+        {
+            case LOG_CONTENTS:
+                fprintf(conn->Pfdebug, "\"%s\" ", v);
+                pqLogLineBreak(length, conn);

pqLogMsgString(conn, str, -1, FROM_*) means actual length may be
different from the caller thinks, but the pqLogLineBreak() subtracts
that value from the message length rememberd in in logging_message.
Anyway AFAICS the patch doesn't use the code path so we should remove
the first two lines.

+            case LOG_CONTENTS:
+                fprintf(conn->Pfdebug, "%s%d ", prefix, v);

That prints #65535 for v = -1 and length = 2. I think it should be
properly expanded as a signed integer.


@@ -139,8 +447,7 @@ pqGets_internal(PQExpBuffer buf, PGconn *conn, bool resetbuffer)
     conn->inCursor = ++inCursor;

     if (conn->Pfdebug)
-        fprintf(conn->Pfdebug, "From backend> \"%s\"\n",
-                buf->data);
+        pqLogMsgString(conn, buf->data, buf->len + 1, FROM_BACKEND);

By the way, appendBinaryPQExpBuffer() enlarges its buffer by the size
of the exact length of the given data, but appends '\0' at the end of
the copied data. Couldn't that leads to an memory overrun?


regards.

--
Kyotaro Horiguchi
NTT Open Source Software Center
On 2020-Oct-09, Kyotaro Horiguchi wrote:

> I saw that version and have some comments.
>
> +pqGetProtocolMsgType(unsigned char c, PGCommSource commsource)
> +{
> +    const char *message_type;
>
> Compiler complains that this is unused.
>
> +static const char *
> +pqGetProtocolMsgType(unsigned char c, PGCommSource commsource)
> +{
> ...
> +    else
> +        return "UnknownCommand";
> +}
>
> Compiler complains as "control reached end of non-void function"

Yeah, those two warnings are caused by the same problem, namely that I
was editing this function to make it simpler and apparently the patch
version I sent does not include all such changes.  The fix is to remove
the message_type variable and have the two assignments be "return".

> +pqLogMsgString(PGconn *conn, const char *v, int length, PGCommSource commsource)
> +{
> +    if (length < 0)
> +        length = strlen(v) + 1;
> +

> pqLogMsgString(conn, str, -1, FROM_*) means actual length may be
> different from the caller thinks, but the pqLogLineBreak() subtracts
> that value from the message length rememberd in in logging_message.
> Anyway AFAICS the patch doesn't use the code path so we should remove
> the first two lines.

True, +1 for removing it.

> By the way, appendBinaryPQExpBuffer() enlarges its buffer by the size
> of the exact length of the given data, but appends '\0' at the end of
> the copied data. Couldn't that leads to an memory overrun?

Doesn't enlargePQExpBuffer() include room for the trailing zero?  I
think it does.
On Wed, Sep 16, 2020 at 4:41 PM Alvaro Herrera <alvherre@2ndquadrant.com> wrote:
> 2020-09-16 13:27:29.072 -03  < ErrorResponse 117 S "ERROR" V "ERROR" C "42704" M "no existe el slot de replicación
«foobar»"F "slot.c" L "408" R "ReplicationSlotAcquireInternal" ^@

Ooh, that looks really nice. The ^@ at the end seems odd, though.

--
Robert Haas
EnterpriseDB: http://www.enterprisedb.com
The Enterprise PostgreSQL Company
At Fri, 9 Oct 2020 11:48:59 -0300, Alvaro Herrera <alvherre@alvh.no-ip.org> wrote in
> > +pqLogMsgString(PGconn *conn, const char *v, int length, PGCommSource commsource)
> > +{
> > +    if (length < 0)
> > +        length = strlen(v) + 1;
> > +
>
> > pqLogMsgString(conn, str, -1, FROM_*) means actual length may be
> > different from the caller thinks, but the pqLogLineBreak() subtracts
> > that value from the message length rememberd in in logging_message.
> > Anyway AFAICS the patch doesn't use the code path so we should remove
> > the first two lines.
>
> True, +1 for removing it.
>
> > By the way, appendBinaryPQExpBuffer() enlarges its buffer by the size
> > of the exact length of the given data, but appends '\0' at the end of
> > the copied data. Couldn't that leads to an memory overrun?
>
> Doesn't enlargePQExpBuffer() include room for the trailing zero?  I
> think it does.

Right. I faintly recall I said the same thing before..

regards.

--
Kyotaro Horiguchi
NTT Open Source Software Center
Hello Aya Iwata

I've been hacking at this patch again.  There were a few things I wasn't
too clear about, so I reordered the code and renamed the routines to try
to make it easier to follow.

One thing I didn't like very much is that all the structures and enums
were exposed to the world in libq-int.h.  Because some enum members have
pretty generic names, I didn't like that much, so I moved the whole
thing to fe-misc.c, and renamed the structs.  Also, the arrays don't
take space unless PQtrace() is called.  (This is not what I was talking
about in my previous message.  The idea I was trying to explain in my
previous message cannot possibly work, so I abandoned it.)

I also renamed functions to make it clear which handles frontend and
which handles backend.  With that, it was pretty obvious that we had an
"reset BE message" in the routine to handle FE, and some clearing of FE
in the code that handles BE.  I fixed things in a way that I think makes
the most sense.

I noticed that it's theoretically possible to have a FE message so large
(more than MAXPGPATH pieces) that it would overrun the array; so I added
a "print message" call after adding one piece, to avoid this.  Also, why
MAXPGPATH?  I added a new symbol MAX_FRONTEND_MSGS for this purpose.

There are some things still to do:

0. I added a XXX comment to pqFlush.  Because we're storing messages in
fe_msgs that point to the libpq buffer, is it possible to end up with
trace messages that are pointing into outBuffer bytes that are already
sent, and perhaps even overwritten with newer bytes?  Maybe not, but
it's unclear.  Should we do pqLogFrontendMsg() preventively to avoid
this problem?

1. Is the handling of protocol 2 correct?  Since it's completely
separate from protocol 3, I have not even looked at what it produces.
But the fact that pqLogMsgByte1 completely ignores the "commsource"
argument makes me suspect that it's not correct.
1a. How do we even test protocol 2 handling?

2. We need a mode to suppress print of time; this would be useful to
be able to test libpq at a low level.  Maybe instead of time we can
print a monotonically-increasing packet sequence number.  With this, we
could easily add tests for libpq itself.  What user interface do we want
for this?  Maybe we can add an "bits32 flags" parameter to PQtrace(),
with one bit for this use.

3. COPY ... (FORMAT BINARY) emits "invalid protocol" ... not good.

4. Even in text format, COPY output is not very useful.  How can we
improve that?

5. Error messages are still printing the terminating zero byte.  I
suggest that it should be suppressed.

6. Let's redefine pqTraceMaybeBreakLine() (I renamed from
pqLogLineBreak):  If message is complete, print a newline; if message is
not complete, print a " ".  Then, remove the whitespace after printing
each element.  This should lead to lines that don't have an useless " "
at the end.

7. Why does it make sense to call pqTraceMaybeBreakLine when
commsource=FROM_FRONTEND?
Attachment
Hi Alvaro san,

Thank you for your email.
I will review this updated patch and I will let you know when I complete.
Please wait a moment.

Best regards,
Aya Iwata

> -----Original Message-----
> From: Alvaro Herrera <alvherre@alvh.no-ip.org>
> Sent: Tuesday, October 27, 2020 1:23 AM
> To: Iwata, Aya/岩田 彩 <iwata.aya@fujitsu.com>
> Cc: pgsql-hackers@postgresql.org; tgl@sss.pgh.pa.us;
> robertmhaas@gmail.com; pchampion@pivotal.io; jdoty@pivotal.io;
> raam.soft@gmail.com; Nagaura, Ryohei/永浦 良平
> <nagaura.ryohei@fujitsu.com>; nagata@sraoss.co.jp;
> peter.eisentraut@2ndquadrant.com; 'Kyotaro HORIGUCHI'
> <horiguchi.kyotaro@lab.ntt.co.jp>; Jamison, Kirk/ジャミソン カーク
> <k.jamison@fujitsu.com>
> Subject: Re: libpq debug log
>
> Hello Aya Iwata
>
> I've been hacking at this patch again.  There were a few things I wasn't too
> clear about, so I reordered the code and renamed the routines to try to make it
> easier to follow.
>
> One thing I didn't like very much is that all the structures and enums were
> exposed to the world in libq-int.h.  Because some enum members have
> pretty generic names, I didn't like that much, so I moved the whole thing to
> fe-misc.c, and renamed the structs.  Also, the arrays don't take space unless
> PQtrace() is called.  (This is not what I was talking about in my previous
> message.  The idea I was trying to explain in my previous message cannot
> possibly work, so I abandoned it.)
>
> I also renamed functions to make it clear which handles frontend and which
> handles backend.  With that, it was pretty obvious that we had an "reset BE
> message" in the routine to handle FE, and some clearing of FE in the code that
> handles BE.  I fixed things in a way that I think makes the most sense.
>
> I noticed that it's theoretically possible to have a FE message so large (more
> than MAXPGPATH pieces) that it would overrun the array; so I added a "print
> message" call after adding one piece, to avoid this.  Also, why MAXPGPATH?
> I added a new symbol MAX_FRONTEND_MSGS for this purpose.
>
> There are some things still to do:
>
> 0. I added a XXX comment to pqFlush.  Because we're storing messages in
> fe_msgs that point to the libpq buffer, is it possible to end up with trace
> messages that are pointing into outBuffer bytes that are already sent, and
> perhaps even overwritten with newer bytes?  Maybe not, but it's unclear.
> Should we do pqLogFrontendMsg() preventively to avoid this problem?
>
> 1. Is the handling of protocol 2 correct?  Since it's completely separate from
> protocol 3, I have not even looked at what it produces.
> But the fact that pqLogMsgByte1 completely ignores the "commsource"
> argument makes me suspect that it's not correct.
> 1a. How do we even test protocol 2 handling?
>
> 2. We need a mode to suppress print of time; this would be useful to be able to
> test libpq at a low level.  Maybe instead of time we can print a
> monotonically-increasing packet sequence number.  With this, we could
> easily add tests for libpq itself.  What user interface do we want for this?
> Maybe we can add an "bits32 flags" parameter to PQtrace(), with one bit for
> this use.
>
> 3. COPY ... (FORMAT BINARY) emits "invalid protocol" ... not good.
>
> 4. Even in text format, COPY output is not very useful.  How can we improve
> that?
>
> 5. Error messages are still printing the terminating zero byte.  I suggest that
> it should be suppressed.
>
> 6. Let's redefine pqTraceMaybeBreakLine() (I renamed from
> pqLogLineBreak):  If message is complete, print a newline; if message is not
> complete, print a " ".  Then, remove the whitespace after printing each
> element.  This should lead to lines that don't have an useless " "
> at the end.
>
> 7. Why does it make sense to call pqTraceMaybeBreakLine when
> commsource=FROM_FRONTEND?
On Tue, Oct 27, 2020 at 3:23 AM Alvaro Herrera <alvherre@alvh.no-ip.org> wrote:
>
> I've been hacking at this patch again.  There were a few things I wasn't
> too clear about, so I reordered the code and renamed the routines to try
> to make it easier to follow.
>

Hi,

Hopefully Iwata-san will return to looking at this soon.

I have tried the latest patch a little (using "psql" as my client),
and have a few small comments so far:

- In pqTraceInit(), in the (admittedly rare) case that fe_msg malloc()
fails, I'd NULL out be_msg too after free(), rather than leave it
dangling (because if pgTraceInit() was ever invoked again, as the
comment says it could, it would result in previously freed memory
being accessed ...)

conn->fe_msg = malloc(MAX_FRONTEND_MSGS * sizeof(pqFrontendMessage));
if (conn->fe_msg == NULL)
{
    free(conn->be_msg);
    conn->be_msg = NULL;
    return false;
}

- >3. COPY ... (FORMAT BINARY) emits "invalid protocol" ... not good.

That seemed to happen for me only if COPYing binary format to stdout.

    UnknownCommand :::Invalid Protocol

- >5. Error messages are still printing the terminating zero byte.  I
  >suggest that it should be suppressed.

Perhaps there's a more elegant way of doing it, but I got rid of the
logging of the zero byte using the following change to
pgLogMsgByte1(), though there still seems to be a trailing space
issue:

                        case LOG_CONTENTS:
-                               fprintf(conn->Pfdebug, "%c ", v);
+                               if (v != '\0')
+                                   fprintf(conn->Pfdebug, "%c ", v);
                                pqTraceMaybeBreakLine(sizeof(v), conn);
                                break;

Regards,
Greg Nancarrow
Fujitsu Australia
Hi Alvaro san,


> There are some things still to do:
I worked on some to do.

> 1. Is the handling of protocol 2 correct?
Protocol 3.0 is implemented in PostgreSQL v7.4 or later. Therefore, most servers and clients today want to connect
using3.0.
Also, wishful thinking, I think Protocol 2.0 will no longer be supported. So I didn't develop it aggressively.
Another reason I'm concerned about implementing it would make the code less maintainable.

> 5. Error messages are still printing the terminating zero byte. I
> suggest that it should be suppressed.
I suppressed to print terminating zero byte like this;
2020-12-15 00:54:09 UTC < ErrorResponse 100 S "ERROR" V "ERROR" C "42P01" M "relation "a" does not exist" P "15" F
"parse_relation.c"L "1379" R "parserOpenTable" 0

I thought about not outputting it, but the document said that if zero,
 it was the last message, so I made it output "0".

> 6. Let's redefine pqTraceMaybeBreakLine() (I renamed from
> pqLogLineBreak):
Sure. I redefined this function.

> 7. Why does it make sense to call pqTraceMaybeBreakLine when
> commsource=FROM_FRONTEND?
Backend messages include break line. However frontend messages don’t have it. So I call this functions.

Pending lists.
>  0. XXX comments
There were 4 XXX comments in Alvaro san's patch. 3 XXX comments are left in current patch.
I will answer this in next e-mail.

> 2. We need a mode to suppress print of time;
> 3. COPY ... (FORMAT BINARY) emits "invalid protocol" ... not good.
> 4. Even in text format, COPY output is not very useful.  How can we
improve that?


Regards,
Aya Iwata
Fujitsu
Attachment
On Tuesday, December 15, 2020 8:12 PM, Iwata-san wrote:
> > There are some things still to do:
> I worked on some to do.

Hi Iwata-san,

Thank you for updating the patch.
I would recommend to register this patch in the upcoming commitfest
to help us keep track of it. I will follow the thread to provide more
reviews too.

> > 1. Is the handling of protocol 2 correct?
> Protocol 3.0 is implemented in PostgreSQL v7.4 or later. Therefore, most
> servers and clients today want to connect using 3.0.
> Also, wishful thinking, I think Protocol 2.0 will no longer be supported. So I
> didn't develop it aggressively.
> Another reason I'm concerned about implementing it would make the code
> less maintainable.

Though I have also not tested it with 2.0 server yet, do I have to download 7.3
version to test that isn't it? Silly question, do we still want to have this
feature for 2.0?
I understand that protocol 2.0 is still supported, but it is only used for
PostgreSQL versions 7.3 and earlier, which is not updated by fixes anymore
since we only backpatch up to previous 5 versions. However I am not sure if
it's a good idea, but how about if we just support this feature for protocol 3.
There are similar chunks of code in fe-exec.c, PQsendPrepare(), PQsendDescribe(),
etc. that already do something similar, so I just thought in hindsight if we can
do the same.
    if (PG_PROTOCOL_MAJOR(conn->pversion) >= 3)
    {
        <new code here>
    }
    else
    {
        /* Protocol 2.0 isn't supported */
         printfPQExpBuffer(&conn->errorMessage,
                           libpq_gettext("function requires at least protocol version 3.0\n"));
         return 0;
    }

But if it's necessary to provide this improved trace output for 2.0 servers, then ignore what
I suggested above, and although difficult I think we should test for protocol 2.0 in older server.

Some minor code comments I noticed:
1.
+    LOG_FIRST_BYTE,                /* logging the first byte identifing the
+                                 * protocol message type */

"identifing" should be "identifying". And closing */ should be on 3rd line.

2.
+            case LOG_CONTENTS:
+                /* Suppresses printing terminating zero byte */

--> Suppress printing of terminating zero byte

Regards,
Kirk Jamison
From: k.jamison@fujitsu.com <k.jamison@fujitsu.com>
> I understand that protocol 2.0 is still supported, but it is only used for
> PostgreSQL versions 7.3 and earlier, which is not updated by fixes anymore
> since we only backpatch up to previous 5 versions. However I am not sure if
> it's a good idea, but how about if we just support this feature for protocol 3.

+1
I thought psqlODBC (still) allows the user to choose the protocol version, it looks like the current psqlODBC disallows
pre-3protocol:

[libpq_connect()]
    MYLOG(0, "libpq connection to the database established.\n");
    pversion = PQprotocolVersion(pqconn);
    if (pversion < 3)
    {
        MYLOG(0, "Protocol version %d is not supported\n", pversion);
        goto cleanup;
    }


> There are similar chunks of code in fe-exec.c, PQsendPrepare(),
> PQsendDescribe(),
> etc. that already do something similar, so I just thought in hindsight if we can
> do the same.
>     if (PG_PROTOCOL_MAJOR(conn->pversion) >= 3)
>     {
>         <new code here>
>     }
>     else
>     {
>         /* Protocol 2.0 isn't supported */
>          printfPQExpBuffer(&conn->errorMessage,
>                            libpq_gettext("function requires at least protocol
> version 3.0\n"));
>          return 0;
>     }


I haven't looked at the patch and don't know the code structure, but I want the code clutter to be minimized.  So, I
thinkwe should avoid putting if statements like above here and there.

Plus, I don't think it's not necessary to fail the processing when the protocol version is 2; we can just stop the
traceoutput.  So, how about disabling the trace output silently if the protocol turns out to be < 3 upon connection?


Regards
Takayuki Tsunakawa
Iwata-san,

On Mon, Dec 21, 2020 at 5:20 PM k.jamison@fujitsu.com
<k.jamison@fujitsu.com> wrote:
>
> On Tuesday, December 15, 2020 8:12 PM, Iwata-san wrote:
> > > There are some things still to do:
> > I worked on some to do.
>
> Hi Iwata-san,
>
> Thank you for updating the patch.
> I would recommend to register this patch in the upcoming commitfest
> to help us keep track of it. I will follow the thread to provide more
> reviews too.
>
> > > 1. Is the handling of protocol 2 correct?
> > Protocol 3.0 is implemented in PostgreSQL v7.4 or later. Therefore, most
> > servers and clients today want to connect using 3.0.
> > Also, wishful thinking, I think Protocol 2.0 will no longer be supported. So I
> > didn't develop it aggressively.
> > Another reason I'm concerned about implementing it would make the code
> > less maintainable.
>
> Though I have also not tested it with 2.0 server yet, do I have to download 7.3
> version to test that isn't it? Silly question, do we still want to have this
> feature for 2.0?
> I understand that protocol 2.0 is still supported, but it is only used for
> PostgreSQL versions 7.3 and earlier, which is not updated by fixes anymore
> since we only backpatch up to previous 5 versions. However I am not sure if
> it's a good idea, but how about if we just support this feature for protocol 3.
> There are similar chunks of code in fe-exec.c, PQsendPrepare(), PQsendDescribe(),
> etc. that already do something similar, so I just thought in hindsight if we can
> do the same.
>         if (PG_PROTOCOL_MAJOR(conn->pversion) >= 3)
>         {
>         <new code here>
>     }
>     else
>     {
>         /* Protocol 2.0 isn't supported */
>          printfPQExpBuffer(&conn->errorMessage,
>                            libpq_gettext("function requires at least protocol version 3.0\n"));
>          return 0;
>     }
>
> But if it's necessary to provide this improved trace output for 2.0 servers, then ignore what
> I suggested above, and although difficult I think we should test for protocol 2.0 in older server.
>
> Some minor code comments I noticed:
> 1.
> +       LOG_FIRST_BYTE,                         /* logging the first byte identifing the
> +                                                                * protocol message type */
>
> "identifing" should be "identifying". And closing */ should be on 3rd line.
>
> 2.
> +                       case LOG_CONTENTS:
> +                               /* Suppresses printing terminating zero byte */
>
> --> Suppress printing of terminating zero byte
>

The patch got some review comments a couple weeks ago but the patch
was still marked as "needs review", which was incorrect. Also cfbot[1]
is unhappy with this patch. So I'm switching the patch as "waiting on
author".

Regards,

[1] http://commitfest.cputube.org/


--
Masahiko Sawada
EnterpriseDB:  https://www.enterprisedb.com/
Hi Iwata-san

I reviewed v10-0001-libpq-trace.patch. (But I don't check recent discussion...)
I found some bugs.
I'm suggesting some refactoring.

****
@@ -6809,7 +6809,17 @@ PQtrace(PGconn *conn, FILE *debug_port)
+       if (pqTraceInit(conn))
+       {
+               conn->Pfdebug = debug_port;
+               setlinebuf(conn->Pfdebug);

  If debug_port is NULL, setlinebuf() causes segmentation fault.
  We should have policy that libpq-trace framework works only when
  Pfdebug is not NULL.

  For example, we should also think that PQtrace(conn, NULL) has same
  effect as PQuntrace(conn).


****
+       0, 0, 0, 0, 0, 0, 0, 0, 0, 0, 0, 0, 0, 0, 0,    /* \x65 ... \0x6d */

  There should be 9 zero, but 15 zero.


****
@@ -85,7 +228,7 @@ pqGetc(char *result, PGconn *conn)
    if (conn->Pfdebug)
-       fprintf(conn->Pfdebug, "From backend> %c\n", *result);
+       pqLogMsgByte1(conn, *result, FROM_BACKEND);

  I suggest to move confirming Pfdebug to pqLogMsgByte1() and
  other logging functions. If you want to avoid overhead of calling
  function, use macro function like the following:

    #define pqLogMsgByte1(CONN, CH, SOURCE) \
      ((CONN)->Pfdebug ? pqLogMsgByte1(CONN, CH, SOURCE) : 0)


****
@@ -168,7 +310,7 @@ pqPuts(const char *s, PGconn *conn)
    if (pqPutMsgBytes(s, strlen(s) + 1, conn))
        return EOF;
    if (conn->Pfdebug)
-       fprintf(conn->Pfdebug, "To backend> \"%s\"\n", s);
+       pqStoreFrontendMsg(conn, LOG_STRING, strlen(s) + 1);

  It's better that you store strlen(s) to local variable and use it.
  strlen(s) is not cost-free.


****
@@ -301,11 +431,15 @@ pqPutInt(int value, size_t bytes, PGconn *conn)
            tmp2 = pg_hton16((uint16) value);
            if (pqPutMsgBytes((const char *) &tmp2, 2, conn))
                return EOF;
+           if (conn->Pfdebug)
+               pqStoreFrontendMsg(conn, LOG_INT16, 2);
            break;
        case 4:
            tmp4 = pg_hton32((uint32) value);
            if (pqPutMsgBytes((const char *) &tmp4, 4, conn))
                return EOF;
+           if (conn->Pfdebug)
+               pqStoreFrontendMsg(conn, LOG_INT32, 4);
            break

  It's better to make the style same as pqGetInt().
  (It is not important.)

   switch(bytes) {
     case 2:
       type = LOG_INT16;
       break;
     case 4:
       type = LOG_INT32;
       break;
    }
    pqStoreFrontendMsg(conn, type, bytes);


****
+pqTraceInit(PGconn *conn)
+{
+   conn->fe_msg = malloc(MAX_FRONTEND_MSGS * sizeof(pqFrontendMessage));
+   if (conn->fe_msg == NULL)
+   {
+       free(conn->be_msg);
+       return false;

  Maybe, we need to clear conn->be_msg by NULL for next calling pqTraceInit().

****
+pqTraceInit(PGconn *conn)
+{
+   conn->fe_msg = malloc(MAX_FRONTEND_MSGS * sizeof(pqFrontendMessage));
+   conn->n_fe_msgs = 0;

  Data structure design is odd.
  Frontend message is basically constructed as the following:
  - message type
  - message length
  - field
  - field
  - field

  So the deisign may be as the follwong and remove n_fe_msg from pg_conn.

  typedef struct pqFrontendMessageField
  {
      int         offset_in_buffer;    message_addr is not real address.
      int         length;              message_length is wrong name. it is length of FIELD.
  } pqFrontendMessageField;

  typedef struct pqFrontendMessage
  {
      PGLogMsgDataType type;
      int         field_num;
      pqFrontendMessageField fields[FLEXIBLE_ARRAY_MEMBER];
  } pqFrontendMessage;

  And then pqTraceInit() is as the following.
  conn->fe_msg = malloc(sizeof(pqFrontendMessage) +
             MAX_FRONTEND_MSG_FIELDS * sizeof(pqFrontendMessage));
  conn->fe_msg->field_num = 0;


****
+pqGetProtocolMsgType(unsigned char c, PGCommSource commsource)
+       return "UnknownCommand";

  It is "UnknownMessageType", isn't it?


****
+ * XXX -- ??
+ *     Message length is added at the last if message is sent by the frontend.
+ *     To arrange the log output format, frontend message contents are stored in the list.

  I understand as the following:
  * The message length is fixed after putting the last field,
  * but message length should be print before printing any field.
  * So we must store the field data in memory.


****
+pqStoreFrontendMsg(PGconn *conn, PGLogMsgDataType type, int length)
+           case LOG_STRING:
+               memcpy(&message, conn->outBuffer + conn->outMsgEnd - length, length);
+               fprintf(conn->Pfdebug, "To backend> \"%c\"\n", message);

  %s is correct.
  At least, %c is not correct.


****
+pqStoreFrontendMsg(PGconn *conn, PGLogMsgDataType type, int length)
+           case LOG_BYTE1:
+               memcpy(&message, conn->outBuffer + conn->outMsgEnd - length, length);

  It is unnecessary to call memcpy().
  LOG_BYTE1, LOG_STRING, and LOG_NCHAR can be passed its pointer directly to fprintf().
  You can also pass LOG_INT* data with casting to fprintf() without memcpy(), but I think either is fine.


****
+           case LOG_INT16:
+               fprintf(conn->Pfdebug, "To backend (#%d)> %c\n", length, result);
+           case LOG_INT32:
+               fprintf(conn->Pfdebug, "To backend (#%d)> %c\n", length, result);

  %d is correct.
  At least, %c is not correct.


****
+pqStoreFrontendMsg(PGconn *conn, PGLogMsgDataType type, int length)
+   char        message;
+   uint16      result16 = 0;
+   uint32      result32 = 0;
+   int         result = 0;

  It's better that these variables declared in each block.
  Initializing result* is unnecessary.

  case LOG_INT16:
  {
      uint16 wk;
      memcpy(&wk, conn->outBuffer + conn->outMsgEnd - 2, 2);
      wk = pg_ntoh16(wk);
      fprintf(conn->Pfdebug, "To backend (#%d)> %h\n", 2, wk);
      break;
  }


****
+pqLogFrontendMsg(PGconn *conn)
+   int         message_addr;
+   int         length;
+   char        message;
+   uint16      result16 = 0;
+   uint32      result32 = 0;
+   int         result = 0;

  Same as pqStoreFrontendMsg().

+               memcpy(&message, conn->outBuffer + message_addr, length);

  Same as pqStoreFrontendMsg().


****
+pqLogMsgByte1(PGconn *conn, char v, PGCommSource commsource)
+   char       *message_source = commsource == FROM_BACKEND ? "<" : ">";

  I understand that 'commsource' means source, but message_source means direction of sending.
  It is better that the variable is named message_direction.


****
+pqLogMsgByte1(PGconn *conn, char v, PGCommSource commsource)
+            case LOG_FIRST_BYTE:
+               if (v == '\0')
+                   return;

  Maybe is it needed for packets whose msg_type is '\0'?

  I get the following output because pqLogMsgnchar() is called
  at conn->be_msg->state == LENGTH. I attach a program for reproduction.

      2020-12-25 00:58:48 UTC > StartupMessage :::Invalid Protocol

  I think confusing transition of state causes it.
  I suggest refactoring instead of fixing the above bug.

  msg_type of Startup packet, SSLRequest packet, and GSSNegotiate packet
  is '\0'. (I guess GSSNegotiate packet may be forgotten).
  At these packet, Byte1 is not sent actually, but if libpq-trace framework consider
  that it is sent, the transition may become more clear like the following:

    pqLogMsgByte1(PGconn *conn, char v, PGCommSource commsource)
    :
      fprintf(conn->Pfdebug, "%s %s ", timestr, message_source);
      /*
       * True type of message tagged '\0' is known when next 4 bytes is checked.
       * So we delay printing message type to pqLogMsgInt().
       */
      if (v != '\0')
        fprintf(conn->Pfdebug, "%s ",
                pqGetProtocolMsgType((unsigned char) v, commsource));

      conn->be_msg->state = LOG_LENGTH;
      conn->be_msg->command = v;

    pqLogMsgInt(PGconn *conn, int v, int length, PGCommSource commsource)
    :

        /* remove case LOG_FIRST_BYTE and... */

        case LOG_LENGTH:
          if (conn->be_msg->command == '\0')
          {
             /* We delayed to print message type for special message. */
             message_addr = conn->fe_msg[0].message_addr;
             memcpy(&result32, conn->outBuffer + message_addr, 4);
             result = (int) pg_ntoh32(result32);

             if (result == NEGOTIATE_SSL_CODE)
                 message_type = "SSLRequest";
             else if (result == NEGOTIATE_GSS_CODE)
                 message_type = "GSSRequest";
             else
                 message_type = "StartupMessage";
             fprintf(conn->Pfdebug, "%s ", message_type);
           }

           fprintf(conn->Pfdebug, "%d", v);
           conn->be_msg->length = v - length;
           conn->be_msg->state = LOG_CONTENTS;
           pqTraceMaybeBreakLine(0, conn);
           break;

****
+pqLogMsgByte1(PGconn *conn, char v, PGCommSource commsource)
+           case LOG_CONTENTS:
+               /* Suppresses printing terminating zero byte */
+               if (v == '\0')
+                   fprintf(conn->Pfdebug, "0");

  Is the above code for end of 'E' or 'N' message?
  We should comment because it is special case.
  Additionally, we may confuse whether 0 is numerical character or '\0'.

  /*
   * 'E' or 'N' message format is as the following:
   *    'E' len [byte1-tag string(null-terminated)]* \0(eof-tag)
   *
   * So we detect eof-tag at pqLogMsgByte1() with LOG_CONTENTS state.
   * The eof-tag is data so we should print it.
   * On the way, we care other non-ascii character.
   */
  if (!isascii(v))
      fprintf(conn->Pfdebug, "\\x%02x", v);


****
+pqLogMsgByte1(PGconn *conn, char v, PGCommSource commsource)
+   if (PG_PROTOCOL_MAJOR(conn->pversion) >= 3)
+   else
+       fprintf(conn->Pfdebug, "FROM backend> %c\n", v);

  Umm. Also see the following.

+pqLogMsgInt(PGconn *conn, int v, int length, PGCommSource commsource)
+   if (PG_PROTOCOL_MAJOR(conn->pversion) >= 3)
+   else
+       fprintf(conn->Pfdebug, "To backend (#%d)> %d\n", length, v);

  In the later case, "FROM backend" is correct.

  The bug is caused by confusing design.
  I suggest to refactor that:
  - Move callings fprintf() in pqStoreFrontendMsg() to each pqLogMsgXXX()
  - pqStoreFrontendMsg() calls each pqLogMsgXXX().


****
+pqLogMsgString(PGconn *conn, const char *v, int length, PGCommSource commsource)
+{
+   if (length < 0)
+       length = strlen(v) + 1;

  I cannot find length==-1 route.


****
+pqLogMsgnchar(PGconn *conn, const char *v, int length, PGCommSource commsource)
+               fprintf(conn->Pfdebug, "\'");
+               fwrite(v, 1, length, conn->Pfdebug);
+               fprintf(conn->Pfdebug, "\'");

  We should consider that 'v' is binary data.
  So it is better to convert non-ascii character to ascii (e.g. x%02x format).

  e.g. case of StartupPacket
    2020-12-25 08:07:42 UTC > StartupMessage 40 'userk5userdatabasetemplate1'

  The length of StartupPacket includes length itselft.
  The length of 'user...tepmlate1' is only 27.
  We could not find 8 bytes(40 - 4 - 27 = 8).

  If non-ascii character is printed, we can find them.
    2020-12-25 08:29:19 UTC > StartupMessage 40 '\x00\x03\x00\x00user\x00k5user\x00database\x00template1\x00\x00'

    static void
    pqLogMsgBinary(PGconn *conn, const char *v, int length, PGCommSource commsource)
    {
      int i, pin;
      for (pin = i = 0; i < length; ++i)
      {
        if (isprint(v[i]))
          continue;
        else
        {
          fwrite(v + pin, 1, i - pin, conn->Pfdebug);
          fprintf(conn->Pfdebug, "\\x%02x", v[i]);
          pin = i + 1;
        }
      }
      if (pin < length)
        fwrite(v + pin, 1, length - pin, conn->Pfdebug);
    }


****
@@ -123,6 +123,9 @@ pqParseInput3(PGconn *conn)
+           /* Terminate a half-finished logging message */
+           if (conn->Pfdebug)
+               pqTraceMaybeBreakLine(msgLength, conn);
            return;

  I understand that the above code only want to do [conn->be_msg->length = 0].
  If it is true, you should create new wrapper function like pqTraceForcelyTerminateMessage()
  and handleSyncLoss() itself should call pqTraceForcelyTerminateMessage().

    pqTraceForcelyTerminateMessage()
    {
      if (conn->be_msg->length > 0)
        fprintf(conn->Pfdebug, "\n");

      pqTraceResetBeMsg(conn);
    }


****
pqSaveParameterStatus(PGconn *conn, const char *name, const char *value)
    if (conn->Pfdebug)
        fprintf(conn->Pfdebug, "pqSaveParameterStatus: '%s' = '%s'\n",
                name, value);

  I think the above code has become to be unnecessary because new pqTrace framework
  become to print it.


Regards
Ryo Matsumura
Attachment
Hi,

Thank you for your review. I modified the code in response to those reviews.

This patch includes these items:
- Fix the code according to reviews
  - Fix COPY output issue
  - Change to not support Protocol v2.0
     It is rarely used anymore and de-support it makes code more simpler. Please see the discussion in this thread for
moredetails.

Regards,
Aya Iwata
Attachment
From: iwata.aya@fujitsu.com <iwata.aya@fujitsu.com>
> This patch includes these items:

Is there anything else in this revision that is not handled?

Below are my comments.

Also, why don't you try running the regression tests with a temporary modification to PQtrace() to output the trace to
afile?  The sole purpose is to confirm that this patch makes the test crash (core dump).


(1)
-    conn->Pfdebug = debug_port;
+    if (pqTraceInit(conn))
+    {
+        conn->Pfdebug = debug_port;
+        if (conn->Pfdebug != NULL)
+            setlinebuf(conn->Pfdebug);
+    }
+    else
+    {
+        /* XXX report ENOMEM? */
+        fprintf(conn->Pfdebug, "Failed to initialize trace support\n");
+        fflush(conn->Pfdebug);
+    }
 }

* When the passed debug_port is NULL, the function should return after calling PQuntrace().

* Is setlinebuf() available on Windows?  Maybe you should use setvbuf() instead.

* I don't see the need for separate pqTraceInit() function, because it is only called here.


(2)
+bool
+pqTraceInit(PGconn *conn)
+{
+    /* already done? */
+    if (conn->be_msg != NULL)
+    {

What's this code for?  I think it's sufficient that PQuntrace() frees b_msg and PQtrace() always allocates b_msg.


(3)
+    conn->fe_msg = malloc(sizeof(pqFrontendMessage) +
+                            MAX_FRONTEND_MSGS * sizeof(pqFrontendMessageField));
+    conn->fe_msg->field_num = 0;
+    if (conn->fe_msg == NULL)
+    {
+        free(conn->be_msg);
+        /* NULL out for the case that fe_msg malloc fails */
+        conn->be_msg = NULL;
+        return false;
+    }
+    conn->fe_msg->field_num = 0;

The memory for the fields array is one entry larger than necessary.  The allocation code would be:

+    conn->fe_msg = malloc(offsetof(pqFrontendMessage, fields) +
+                            MAX_FRONTEND_MSGS * sizeof(pqFrontendMessageField));

Also, the line with "field_num = 0" appears twice.  The first one should be removed.


(4)
+static void
+pqLogMessageByte1(PGconn *conn, char v, PGCommSource commsource)
+{
...
+    if (PG_PROTOCOL_MAJOR(conn->pversion) >= 3)
+    {

I think you can remove the protocol version check in various logging functions, because PQtrace() disables logging when
theprotocol version is 2.


(5)
@@ -966,10 +966,6 @@ pqSaveParameterStatus(PGconn *conn, const char *name, const char *value)
     pgParameterStatus *pstatus;
     pgParameterStatus *prev;

-    if (conn->Pfdebug)
-        fprintf(conn->Pfdebug, "pqSaveParameterStatus: '%s' = '%s'\n",
-                name, value);
-

Where is this information output instead?


(6)
+ * Set up state so that we can trace. NB -- this might be called mutiple

mutiple -> multiple


(7)
+    LOG_FIRST_BYTE,                /* logging the first byte identifing the
+                                   protocol message type */

identifing -> identifying


(8)
+#define pqLogMsgByte1(CONN, CH, SOURCE) \
+((CONN)->Pfdebug ? pqLogMessageByte1(CONN, CH, SOURCE) : 0)

For functions that return void, follow the style of CHECK_FOR_INTERRUPTS() defined in miscadmin.h.


(9)
+                currtime = time(NULL);
+                tmp = localtime(&currtime);
+                strftime(timestr, sizeof(timestr), "%Y-%m-%d %H:%M:%S %Z", tmp);
+
+                fprintf(conn->Pfdebug, "%s %s ", timestr, message_direction);

It's better to have microsecond accuracy, because knowing the accumulation of such fine-grained timings may help to
troubleshootheavily-loaded client cases.  You can mimic setup_formatted_log_time() in src/backend/utils/error/elog.c.
Thisis used for the %m marker in log_line_prefix.


(10)
I think it's better to use tabs (or any other character that is less likely to appear in the log field) as a field
separator,because it makes it easier to process the log with a spreadsheet or some other tools.


(11)
+                /*
+                 * True type of message tagged '\0' is known when next 4 bytes is
+                 * checked. So we delay printing message type to pqLogMsgInt()
+                 */
+                if (v != '\0')
+                    fprintf(conn->Pfdebug, "%s ",
+                            pqGetProtocolMsgType((unsigned char) v, commsource));

In what cases does '\0' appear as a message type?


(12)
+static const char *
+pqGetProtocolMsgType(unsigned char c, PGCommSource commsource)
+{
+    if (commsource == FROM_BACKEND && c < lengthof(protocol_message_type_b))
+        return protocol_message_type_b[c];
+    else if (commsource == FROM_FRONTEND && c < lengthof(protocol_message_type_f))
+        return protocol_message_type_f[c];
+    else
+        return "UnknownMessage";
+}

This function returns NULL (=0) when protocol_message_type_b/f[c] is 0.  That crashes the caller:

+                    fprintf(conn->Pfdebug, "%s ",
+                            pqGetProtocolMsgType((unsigned char) v, commsource));

Plus, you may as well print the invalid message type.  Why don't you do something like this:

+static const char *
+pqGetProtocolMsgType(unsigned char c, PGCommSource commsource)
+{
+    static char unknown_message[64];
+    char *msg = NULL;

+    if (commsource == FROM_BACKEND && c < lengthof(protocol_message_type_b))
+        msg = protocol_message_type_b[c];
+    else if (commsource == FROM_FRONTEND && c < lengthof(protocol_message_type_f))
+        msg = protocol_message_type_f[c];
+
+    if (msg == NULL)
+    {
+        sprintf(unknown_message, "Unknown message %02x", c);
+        msg = unknown_message;
+    }
+
+    return msg;
+}


(13)
@@ -156,7 +156,12 @@ pqParseInput3(PGconn *conn)
         {
             /* If not IDLE state, just wait ... */
             if (conn->asyncStatus != PGASYNC_IDLE)
+            {
+                /* Terminate a half-finished logging message */
+                if (conn->Pfdebug)
+                    pqTraceForcelyBreakLine(msgLength, conn);
                 return;
+            }

             /*
              * Unexpected message in IDLE state; need to recover somehow.

What's this situation like?  Why output a new line and reset the trace status?


(14)
+/* pqLogInvalidProtocol: Print that the protocol message is invalid */
+static void
+pqLogInvalidProtocol(PGconn *conn)
+{
+    fprintf(conn->Pfdebug, ":::Invalid Protocol\n");
+    conn->be_msg->state = LOG_FIRST_BYTE;
+}

Is it sufficient to just reset the state field?  Isn't it necessary to call pqTraceResetBeMsg() instead?


(15)
@@ -212,15 +368,8 @@ pqSkipnchar(size_t len, PGconn *conn)
...
     conn->inCursor += len;
-
     return 0;
 }

This is an unnecessary removal of an empty line.


(16)
+static void
+pqLogMessageByte1(PGconn *conn, char v, PGCommSource commsource)
+{
+    char       *message_direction = commsource == FROM_BACKEND ? "<" : ">";
...
+        switch (conn->be_msg->state)

This function handles messages in both directions.  But the switch condition is based on the backend message state
(b_msg). How is this correct?


(17)
What's the difference between pqLogMsgString() and pqLogMsgnchar()?  They both take a length argument.  Do they have to
beseparate functions?


(18)
     if (conn->Pfdebug)
-        fprintf(conn->Pfdebug, "To backend> %c\n", c);
+        pqStoreFrontendMsg(conn, LOG_BYTE1, 1);

To match the style for backend messages with pqLogMsgByte1 etc., why don't you wrap the conn->Pfdebug check in the
macro?


(19)
@@ -520,8 +667,6 @@ pqPutMsgStart(char msg_type, bool force_len, PGconn *conn)
         /* allow room for message length */
         endPos += 4;
     }
-    else
-        lenPos = -1;

Why is this change necessary?


(20)
+static void
+pqLogFrontendMsg(PGconn *conn)
...
+    for (i = 0; i < conn->fe_msg->field_num; i++)
+    {
+        message_addr = conn->fe_msg->fields[i].offset_in_buffer;
+        length = conn->fe_msg->fields[i].length;
+
+        switch (conn->fe_msg[i].type)
+        {
+            case LOG_BYTE1:

When I saw this switch condition, the confusion exploded.  Shouldn't the type should be the attribute of each field as
follows?

+        switch (conn->fe_msg->fields[i].type)

I also found the function names for frontend -> backend messages hard to grasp.  Could you show the flow of function
callswhen sending messages to the backend?


(21)
+                uint16        result16;
+                memcpy(&result16, conn->outBuffer + message_addr, length);

You should have an empty line between the declaration part and execution part.


(22)
I couldn't understand pqLogBinaryMsg() at all.  Could you explain what it does?  Particularly, if all bytes in the
stringis printable, the function seems to do nothing:

+        if (isprint(v[i]))
+            continue;

Should the following part be placed outside the for loop?  What does 'pin' mean? (I want the variable name to be more
intuitive.)

+        if (pin < length)
+            fwrite(v + pin, 1, length - pin, conn->Pfdebug);


Regards
Takayuki Tsunakawa
Dear Tsunakawa-san, Iwata-san,

> * Is setlinebuf() available on Windows?  Maybe you should use setvbuf() instead.

Yeah, cfbot2021 throws errors:
https://ci.appveyor.com/project/postgresql-cfbot/postgresql/build/1.0.124922

```
  src/interfaces/libpq/fe-connect.c(6776): warning C4013: 'setlinebuf' undefined; assuming extern returning int
[C:\projects\postgresql\libpq.vcxproj]
```

The manpage of setlinebuf() suggests how to replace it, so you should follow.

```
       The setbuffer() function is the same, except that the size of the buffer is up to the caller, rather  than
being determined  by  the
       default BUFSIZ.  The setlinebuf() function is exactly equivalent to the call:

           setvbuf(stream, NULL, _IOLBF, 0);
```

Hayato Kuroda
FUJITSU LIMITED
Hi Iwata-san,

In addition to Tsunakawa-san's comments,
The compiler also complains:
  fe-misc.c:678:20: error: ‘lenPos’ may be used uninitialized in this function [-Werror=maybe-uninitialized]
    conn->outMsgStart = lenPos;

There's no need for variable lenPos anymore since we have decided *not* to support pre protocol 3.0.
And by that we have to update the description of pqPutMsgStart too.
So you can remove the lenPos variable and the condition where you have to check for protocol version.

diff --git a/src/interfaces/libpq/fe-misc.c b/src/interfaces/libpq/fe-misc.c
index 8bc9966..3de48be 100644
--- a/src/interfaces/libpq/fe-misc.c
+++ b/src/interfaces/libpq/fe-misc.c
@@ -644,14 +644,12 @@ pqCheckInBufferSpace(size_t bytes_needed, PGconn *conn)
  *
  * The state variable conn->outMsgStart points to the incomplete message's
  * length word: it is either outCount or outCount+1 depending on whether
- * there is a type byte.  If we are sending a message without length word
- * (pre protocol 3.0 only), then outMsgStart is -1.  The state variable
- * conn->outMsgEnd is the end of the data collected so far.
+ * there is a type byte.  The state variable conn->outMsgEnd is the end of
+ * the data collected so far.
  */
 int
 pqPutMsgStart(char msg_type, bool force_len, PGconn *conn)
 {
-       int                     lenPos;
        int                     endPos;

        /* allow room for message type byte */
@@ -661,9 +659,8 @@ pqPutMsgStart(char msg_type, bool force_len, PGconn *conn)
                endPos = conn->outCount;

        /* do we want a length word? */
-       if (force_len || PG_PROTOCOL_MAJOR(conn->pversion) >= 3)
+       if (force_len)
        {
-               lenPos = endPos;
                /* allow room for message length */
                endPos += 4;
        }
@@ -675,7 +672,7 @@ pqPutMsgStart(char msg_type, bool force_len, PGconn *conn)
        if (msg_type)
                conn->outBuffer[conn->outCount] = msg_type;
        /* set up the message pointers */
-       conn->outMsgStart = lenPos;
+       conn->outMsgStart = endPos;
        conn->outMsgEnd = endPos;


At the same time, the one below lacks one more zero. (Only has 8)
There should be 9 as Matsumura-san mentioned.
+    0, 0, 0, 0, 0, 0, 0, 0,     /* \x65 ... \0x6d */


The following can be removed in pqStoreFrontendMsg():
+ *        In protocol v2, we immediately print each message as we receive it.
+ *        (XXX why?)


Maybe the following description can be paraphrased:
+ *        The message length is fixed after putting the last field, but message
+ *        length should be print before printing any fields.So we must store the
+ *        field data in memory.
to:
+ *        The message length is fixed after putting the last field. But message
+ *        length should be printed before printing any field, so we must store
+ *        the field data in memory.


In pqStoreFrontendMsg, pqLogMessagenchar, pqLogMessageString,
pqLogMessageInt, pqLogMessageByte1, maybe it is unneccessary to use
+    if (PG_PROTOCOL_MAJOR(conn->pversion) >= 3)
because you have already indicated in the PQtrace() to return
silently when protocol 2.0 is detected.
+    /* Protocol 2.0 is not supported. */
+    if (PG_PROTOCOL_MAJOR(conn->pversion) < 3)
+        return;


In pqLogMessageInt(),
+    /* We delayed to print message type for special message. */
can be paraphrased to:
      /* We delay printing of the following special message_type */


Regards,
Kirk Jamison
On 2021-Jan-17, tsunakawa.takay@fujitsu.com wrote:

> * I don't see the need for separate pqTraceInit() function, because it is only called here.

That's true, but it'd require that we move PQtrace() to fe-misc.c,
because pqTraceInit() uses definitions that are private to that file.

> (2)
> +bool
> +pqTraceInit(PGconn *conn)
> +{
> +    /* already done? */
> +    if (conn->be_msg != NULL)
> +    {
>
> What's this code for?  I think it's sufficient that PQuntrace() frees b_msg and PQtrace() always allocates b_msg.

The point is to be able to cope with a connection that calls PQtrace()
multiple times, with or without an intervening PQuntrace().
We'd make no friends if we made PQtrace() crash, or leak memory if
called a second time ...

> (5)
> @@ -966,10 +966,6 @@ pqSaveParameterStatus(PGconn *conn, const char *name, const char *value)
>      pgParameterStatus *pstatus;
>      pgParameterStatus *prev;
>
> -    if (conn->Pfdebug)
> -        fprintf(conn->Pfdebug, "pqSaveParameterStatus: '%s' = '%s'\n",
> -                name, value);
> -
>
> Where is this information output instead?

Hmm, seems to have been lost.  I restored it, but didn't verify
the resulting behavior carefully.

> (9)
> +                currtime = time(NULL);
> +                tmp = localtime(&currtime);
> +                strftime(timestr, sizeof(timestr), "%Y-%m-%d %H:%M:%S %Z", tmp);
> +
> +                fprintf(conn->Pfdebug, "%s %s ", timestr, message_direction);
>
> It's better to have microsecond accuracy, because knowing the accumulation of such fine-grained timings may help to
troubleshootheavily-loaded client cases.  You can mimic setup_formatted_log_time() in src/backend/utils/error/elog.c.
Thisis used for the %m marker in log_line_prefix.


Yeah, it was me that removed printing of milliseconds -- Iwata-san's
original patch used ftime() which is not portable.  I had looked for
portable ways to get this but couldn't find anything that didn't involve
linking backend files, so I punted.  But looking again now, it is quite
simple: just use standard strftime and localtime and just concatenate
both together.  Similar to what setup_formatted_log_time except we don't
worry about the TZ at all.

> (10)
> I think it's better to use tabs (or any other character that is less likely to appear in the log field) as a field
separator,because it makes it easier to process the log with a spreadsheet or some other tools.


I can buy that.  I changed it to have some tabs; the lines are now:

timestamp "> or <" <tab> "message type" <tab> length <space> message contents

I think trying to apply tabs inside the message contents is going to be
more confusing than helpful.


> (12)
> [...]
> Plus, you may as well print the invalid message type.  Why don't you do something like this:
>
> +static const char *
> +pqGetProtocolMsgType(unsigned char c, PGCommSource commsource)
> +{
> +    static char unknown_message[64];
> +    char *msg = NULL;
>
> +    if (commsource == FROM_BACKEND && c < lengthof(protocol_message_type_b))
> +        msg = protocol_message_type_b[c];
> +    else if (commsource == FROM_FRONTEND && c < lengthof(protocol_message_type_f))
> +        msg = protocol_message_type_f[c];
> +
> +    if (msg == NULL)
> +    {
> +        sprintf(unknown_message, "Unknown message %02x", c);
> +        msg = unknown_message;
> +    }
> +
> +    return msg;
> +}

Right.  I had written something like this, but in the end decided not to
bother because it doesn't seem terribly important.  You can't do exactly
what you suggest, because it has the problem that you're returning a
stack-allocated variable even though your stack is about to be blown
away.  My copy had a static buffer that was malloc()ed on first use (and
if allocation fails, return a const string).  Anyway, I fixed the
crasher problem.

The protocol_message_type_b array had the serious problem it confused
the entry for byte 1 (0x01) with that of char '1' (and 2 and 3), so it
printed a lot of 'Unknown message' lines.  Clearly, the maintenance of
this array is going to be a pain point of this patch (counting number of
zeroes is no fun), and I think we're going to have some way to have an
explicit initializer, where we can do things like
    protocol_message_type_b['A'] = "NotificationResponse";
etc instead of the current way, which is messy, hard to maintain.
I'm not sure how to do that and not make things worse, however.

> (16)
> +static void
> +pqLogMessageByte1(PGconn *conn, char v, PGCommSource commsource)
> +{
> +    char       *message_direction = commsource == FROM_BACKEND ? "<" : ">";
> ...
> +        switch (conn->be_msg->state)
>
> This function handles messages in both directions.  But the switch condition is based on the backend message state
(b_msg). How is this correct?


It's not.

I split things so that this function only prints backend messages; when
frontend messages are to be printed, we use a single fprintf() instead.
See about (20), below.

>
> (17)
> What's the difference between pqLogMsgString() and pqLogMsgnchar()?  They both take a length argument.  Do they have
tobe separate functions?


nchar are not null-terminated and we escape !isprint() characters.  I'm
not sure that the difference is significant enough, but I'm also not
sure if they can be merged into one.

> (18)
>      if (conn->Pfdebug)
> -        fprintf(conn->Pfdebug, "To backend> %c\n", c);
> +        pqStoreFrontendMsg(conn, LOG_BYTE1, 1);
>
> To match the style for backend messages with pqLogMsgByte1 etc., why don't you wrap the conn->Pfdebug check in the
macro?

I think these macros are useless and should be removed.  There's more
verbosity and confusion caused by them, than the clarity they provide.

> (20)
> +static void
> +pqLogFrontendMsg(PGconn *conn)
> ...
> +    for (i = 0; i < conn->fe_msg->field_num; i++)
> +    {
> +        message_addr = conn->fe_msg->fields[i].offset_in_buffer;
> +        length = conn->fe_msg->fields[i].length;
> +
> +        switch (conn->fe_msg[i].type)
> +        {
> +            case LOG_BYTE1:
>
> When I saw this switch condition, the confusion exploded.  Shouldn't the type should be the attribute of each field
asfollows?

>
> +        switch (conn->fe_msg->fields[i].type)
>
> I also found the function names for frontend -> backend messages hard to grasp.  Could you show the flow of function
callswhen sending messages to the backend?


Exactly!  I was super confused about this too, and eventually decided to
rewrite the whole thing so that the 'type' is in the Fields struct.  And
while doing that, I noticed that it would make more sense to let the
fe_msg array be realloc'ed if it gets full, rather than making it fixed
size.  This made me add pqTraceUninit(), so that we can free the array
if it has grown, to avoid reserving arbitrarily large amounts of memory
after PQuntrace() on a session that traced large messages.

> (22)
> I couldn't understand pqLogBinaryMsg() at all.  Could you explain what it does?  Particularly, if all bytes in the
stringis printable, the function seems to do nothing:

>
> +        if (isprint(v[i]))
> +            continue;
>
> Should the following part be placed outside the for loop?  What does 'pin' mean? (I want the variable name to be more
intuitive.)
>
> +        if (pin < length)
> +            fwrite(v + pin, 1, length - pin, conn->Pfdebug);

Yes :-(  I fixed that too.

This patch needs more work still, of course.

--
Álvaro Herrera       Valdivia, Chile
"Java is clearly an example of money oriented programming"  (A. Stepanov)
Attachment
Hello Alvaro-san, Iwata-san,


First of all, thank you Alvaro-san really a lot for your great help.  I'm glad you didn't lose interest and time for
thispatch yet.  (Iwata-san is my colleague.)


From: Alvaro Herrera <alvherre@alvh.no-ip.org>
> That's true, but it'd require that we move PQtrace() to fe-misc.c, because
> pqTraceInit() uses definitions that are private to that file.

Ah, that was the reason for separation.  Then, I'm fine with either keeping the separation, or integrating the two
functionsin fe-misc.c with PQuntrace() being also there.  I kind of think the latter is better, because of code
readabilityand, because tracing facility is not a connection-related reature so categorizing it as "misc" feels
natural.


> > What's this code for?  I think it's sufficient that PQuntrace() frees b_msg
> and PQtrace() always allocates b_msg.
>
> The point is to be able to cope with a connection that calls PQtrace() multiple
> times, with or without an intervening PQuntrace().
> We'd make no friends if we made PQtrace() crash, or leak memory if called a
> second time ...

HEAD's PQtrace() always call PQuntrace() and then re-initialize from scratch.  So, if we keep that flow, the user can
callPQtrace() multiple in a row.


> I think trying to apply tabs inside the message contents is going to be more
> confusing than helpful.

Agreed.


> > Plus, you may as well print the invalid message type.  Why don't you do
> something like this:
> >
> > +static const char *
> > +pqGetProtocolMsgType(unsigned char c, PGCommSource commsource) {
> > +    static char unknown_message[64];
> > +    char *msg = NULL;
> >
> > +    if (commsource == FROM_BACKEND && c <
> lengthof(protocol_message_type_b))
> > +        msg = protocol_message_type_b[c];
> > +    else if (commsource == FROM_FRONTEND && c <
> lengthof(protocol_message_type_f))
> > +        msg = protocol_message_type_f[c];
> > +
> > +    if (msg == NULL)
> > +    {
> > +        sprintf(unknown_message, "Unknown message %02x", c);
> > +        msg = unknown_message;
> > +    }
> > +
> > +    return msg;
> > +}
>
> Right.  I had written something like this, but in the end decided not to bother
> because it doesn't seem terribly important.  You can't do exactly what you
> suggest, because it has the problem that you're returning a stack-allocated
> variable even though your stack is about to be blown away.  My copy had a
> static buffer that was malloc()ed on first use (and if allocation fails, return a
> const string).  Anyway, I fixed the crasher problem.

My suggestion included static qualifier to not use the stack, but it doesn't work anyway in multi-threaded
applications. So I agree that we don't print the invalid message type value.


> > (18)
> >      if (conn->Pfdebug)
> > -        fprintf(conn->Pfdebug, "To backend> %c\n", c);
> > +        pqStoreFrontendMsg(conn, LOG_BYTE1, 1);
> >
> > To match the style for backend messages with pqLogMsgByte1 etc., why
> don't you wrap the conn->Pfdebug check in the macro?
>
> I think these macros are useless and should be removed.  There's more
> verbosity and confusion caused by them, than the clarity they provide.

Agreed.


> This patch needs more work still, of course.

Yes, she is updating the patch based on the feedback from you, Kirk-san, and me.

By the way, I just looked at the beginning of v12.

-void PQtrace(PGconn *conn, FILE *stream);
+void PQtrace(PGconn *conn, FILE *stream, bits32 flags);

Can we change the signature of an API function?


Iwata-san,
Please integrate Alvaro-san's patch with yours.  Next week is the last week in this CF, so do your best to post the
patchby next Monday or so (before Alvaro-san loses interest or time.)  Then I'll review it ASAP.


Regards
Takayuki Tsunakawa
Hello, just two quick comments on this,

On 2021-Jan-22, tsunakawa.takay@fujitsu.com wrote:

> From: Alvaro Herrera <alvherre@alvh.no-ip.org>
> > That's true, but it'd require that we move PQtrace() to fe-misc.c, because
> > pqTraceInit() uses definitions that are private to that file.
>
> Ah, that was the reason for separation.  Then, I'm fine with either
> keeping the separation, or integrating the two functions in fe-misc.c
> with PQuntrace() being also there.  I kind of think the latter is
> better, because of code readability and, because tracing facility is
> not a connection-related reature so categorizing it as "misc" feels
> natural.

Maybe we can create a new file specifically for this to avoid mixing
unrelated stuff in fe-misc.c -- say fe-trace.c where all this new
tracing stuff goes.

> > The point is to be able to cope with a connection that calls PQtrace() multiple
> > times, with or without an intervening PQuntrace().
> > We'd make no friends if we made PQtrace() crash, or leak memory if called a
> > second time ...
>
> HEAD's PQtrace() always call PQuntrace() and then re-initialize from
> scratch.  So, if we keep that flow, the user can call PQtrace()
> multiple in a row.

Oh, of course.

--
Álvaro Herrera       Valdivia, Chile
"No necesitamos banderas
 No reconocemos fronteras"                  (Jorge González)
First, some possibly major questions:


(23)
From: 'Alvaro Herrera' <alvherre@alvh.no-ip.org>
> Maybe we can create a new file specifically for this to avoid mixing
> unrelated stuff in fe-misc.c -- say fe-trace.c where all this new
> tracing stuff goes.

What do you think about this suggestion?  I think this is reasonable, including moving PQtrace/PQuntrace to the new
file.

OTOH, fe-misc also has humble reasons to contain them.  One is that the file header comment is as follows, accepting
miscellaneousstuff.  Another is that although most functions in fe-misc.c are related to protocol data transmission and
receipt,several functions at the end of the file are already not related.


 *      fe-misc.c
 *
 *   DESCRIPTION
 *       miscellaneous useful functions


(24)
-void PQtrace(PGconn *conn, FILE *stream);
+void PQtrace(PGconn *conn, FILE *stream, bits32 flags);
 </synopsis>
      </para>

+     <para>
+      <literal>flags</literal> contains flag bits describing the operating mode
+      of tracing.  If <literal>(flags & TRACE_SUPPRESS_TIMESTAMPS)</literal> is
+      true, then timestamps are not printed with each message.
+     </para>

As I asked in the previous mail, I'm afraid we cannot change the signature of existing API functions.  If we want this
flagbits, we have to add something like PQtraceEx(), don't we?


The flag name differs between in the manual and in the source code:

+#define PQTRACE_SUPPRESS_TIMESTAMPS        (1 << 0)


P.S.
Also, please note this as:

> Also, why don't you try running the regression tests with a temporary modification to PQtrace() to output the trace
toa file?  The sole purpose is to confirm that this patch doesn't make the test crash (core dump).


Regards
Takayuki Tsunakawa
Hello,  Alvaro san , Tsunakawa san

Thank you for your help. It was very helpful.

> Please integrate Alvaro-san's patch with yours.  Next week is the last week in this CF, so do your best to post the
patchby next Monday or so (before Alvaro-san loses interest or time.)  Then I'll review it ASAP.

I integrated my fix and update v12 patch.  All previous review comments apply to this patch.

Regards,
Aya Iwata
Fujitsu
Attachment
Iwata-san, all,


Strangely, Iwata-san's latest mail she sent today at 10:34 JST hasn't appeared on pgsql-hackers yet after more than 6
hours. It is not reflected in the CF entry [1].  So, I'm putting her original mail below.  The v13 patch attached to
theoriginal mail is attached to this mail.


I guess only Alvaro-san and me, who are listed in To:, received the original mail.

Iwata-san,
Please ask pgsql-www list about this problem.


[1]
https://commitfest.postgresql.org/31/2889/


Regards
Takayuki Tsunakawa


> -----Original Message-----
> From: Iwata, Aya/岩田 彩 <iwata.aya@fujitsu.com>
> Sent: Monday, January 25, 2021 10:34 AM
> To: 'Alvaro Herrera' <alvherre@alvh.no-ip.org>; Tsunakawa, Takayuki/綱川 貴
> 之 <tsunakawa.takay@fujitsu.com>
> Cc: 'pgsql-hackers@lists.postgresql.org'
> <pgsql-hackers@lists.postgresql.org>
> Subject: RE: libpq debug log
>
> Hello,  Alvaro san , Tsunakawa san
>
> Thank you for your help. It was very helpful.
>
> > Please integrate Alvaro-san's patch with yours.  Next week is the last week
> in this CF, so do your best to post the patch by next Monday or so (before
> Alvaro-san loses interest or time.)  Then I'll review it ASAP.
> I integrated my fix and update v12 patch.  All previous review comments apply
> to this patch.
>
> Regards,
> Aya Iwata
> Fujitsu
Attachment
Hello,

I have not tested nor review the latest patch changes yet, but I am reporting the compiler errors.
I am trying to compile the patch since V12 (Alvaro's version), but the following needs to
be fixed too because of the complaints: doc changes and undeclared INT_MAX

libpq.sgml:5893: parser error : xmlParseEntityRef: no name
      of tracing.  If <literal>(flags & TRACE_SUPPRESS_TIMESTAMPS)</literal> is
                                       ^
libpq.sgml:8799: parser error : chunk is not well balanced
postgres.sgml:195: parser error : Failure to process entity libpq
  &libpq;
         ^
postgres.sgml:195: parser error : Entity 'libpq' not defined
  &libpq;
         ^
...
fe-misc.c: In function ‘pqStoreFrontendMsg’:
fe-misc.c:903:35: error: ‘INT_MAX’ undeclared (first use in this function)
    if (conn->fe_msg->max_fields > INT_MAX / 2)


Regards,
Kirk Jamison
Tsunakawa san,

> Strangely, Iwata-san's latest mail she sent today at 10:34 JST hasn't appeared
> on pgsql-hackers yet after more than 6 hours.  It is not reflected in the CF
> entry [1].  So, I'm putting her original mail below.  The v13 patch attached to
> the original mail is attached to this mail.

I solved this problem. Thank you for sharing my email.

Regards,
Aya Iwata
Fujitsu
Iwata-san,


(25)
+        conn->fe_msg = malloc(sizeof(offsetof(pqFrontendMessage, fields)) +
+                              DEF_FE_MSGFIELDS * sizeof(pqFrontendMessageField));

It's incorrect that offsetof() is nested in sizeof().  See my original review comment.


(26)
+bool
+pqTraceInit(PGconn *conn, bits32 flags)
+{
...
+        conn->be_msg->state = LOG_FIRST_BYTE;
+        conn->be_msg->length = 0;
+    }
...
+    conn->be_msg->state = LOG_FIRST_BYTE;
+    conn->be_msg->length = 0;

The former is redundant?


(27)
+/*
+ * Deallocate frontend-message tracking memory.  We only do this because
+ * it can grow arbitrarily large, and skip it in the initial state, because
+ * it's likely pointless.
+ */
+void
+pqTraceUninit(PGconn *conn)
+{
+    if (conn->fe_msg &&
+        conn->fe_msg->num_fields != DEF_FE_MSGFIELDS)
+    {
+        pfree(conn->fe_msg);
+        conn->fe_msg = NULL;
+    }
+}

I thought this function plays the reverse role of pqTraceInit(), but it only frees memory for frontend messages.  Plus,
usefree() instead of pfree(), because malloc() is used to allocate memory.


(28)
+void PQtrace(PGconn *conn, FILE *stream, bits32 flags);

bits32 can't be used because it's a data type defined in c.h, which should not be exposed to applications.  I think you
canjust int or something.


Considering these and the compilation error Kirk-san found, I'd like you to do more self-review before I resume this
review.


Regards
Takayuki Tsunakawa
On 2021-Jan-25, tsunakawa.takay@fujitsu.com wrote:

> Iwata-san,

[...]

> Considering these and the compilation error Kirk-san found, I'd like
> you to do more self-review before I resume this review.

Kindly note that these errors are all mine.

Thanks for the review

--
Álvaro Herrera                            39°49'30"S 73°17'W
#error "Operator lives in the wrong universe"
  ("Use of cookies in real-time system development", M. Gleixner, M. Mc Guire)
On Mon, Jan 25, 2021 10:11 PM (JST), Alvaro Herrera wrote:
> On 2021-Jan-25, tsunakawa.takay@fujitsu.com wrote:
>
> > Iwata-san,
>
> [...]
>
> > Considering these and the compilation error Kirk-san found, I'd like
> > you to do more self-review before I resume this review.
>
> Kindly note that these errors are all mine.
>
> Thanks for the review
>
Hello,
To make the CFBot happy, I fixed the compiler errors.
I have not included here the change proposal to move the tracing functions
to a new file: fe-trace.c or something, so I retained the changes .
Maybe Iwata-san can consider the proposal.
Currently, both pqTraceInit() and pqTraceUninit() are called only by one function.

Summary:
1. I changed the bits32 flags to int flags
2. I assumed INT_MAX value is the former MAX_FRONTEND_MSGS
   I defined it to solve the compile error. Please tell if the value was wrong.
3. Fixed the doc errors
4. Added freeing of be_msg in pqTraceUninit()
5. Addressed the following comments:

> (25)
> +        conn->fe_msg =
> malloc(sizeof(offsetof(pqFrontendMessage, fields)) +
> +
> DEF_FE_MSGFIELDS * sizeof(pqFrontendMessageField));
>
> It's incorrect that offsetof() is nested in sizeof().  See my original
> review comment.

I removed the initial sizeof().


> (26)
> +bool
> +pqTraceInit(PGconn *conn, bits32 flags) {
> ...
> +        conn->be_msg->state = LOG_FIRST_BYTE;
> +        conn->be_msg->length = 0;
> +    }
> ...
> +    conn->be_msg->state = LOG_FIRST_BYTE;
> +    conn->be_msg->length = 0;
>
> The former is redundant?

Right. I've removed the former.


> (27)
> +/*
> + * Deallocate frontend-message tracking memory.  We only do this
> +because
> + * it can grow arbitrarily large, and skip it in the initial state,
> +because
> + * it's likely pointless.
> + */
> +void
> +pqTraceUninit(PGconn *conn)
> +{
> +    if (conn->fe_msg &&
> +        conn->fe_msg->num_fields != DEF_FE_MSGFIELDS)
> +    {
> +        pfree(conn->fe_msg);
> +        conn->fe_msg = NULL;
> +    }
> +}
>
> I thought this function plays the reverse role of pqTraceInit(), but
> it only frees memory for frontend messages.  Plus, use free() instead
> of pfree(), because
> malloc() is used to allocate memory.

Fixed to use free(). Also added the freeing of be_msg.

> (28)
> +void PQtrace(PGconn *conn, FILE *stream, bits32 flags);
>
> bits32 can't be used because it's a data type defined in c.h, which
> should not be exposed to applications.  I think you can just int or something.

I used int. It still works to suppress the timestamp when flags is true.

In my environment, when flags is false(0):
2021-01-28 06:26:11.368 >   Query   27 "COPY country TO STDOUT"
2021-01-28 06:26:11.368 >   Query   -1
2021-01-28 06:26:11.369 <   CopyOutResponse 13 \x00 #3 #0 #0 #0
2021-01-28 06:26:11.369 <   CopyDone    4

2021-01-28 06:26:11.369 <   CopyDone    4
2021-01-28 06:26:11.369 <   CopyDone    4
2021-01-28 06:26:11.369 <   CommandComplete 11 "COPY 0"
2021-01-28 06:26:11.369 <   ReadyForQuery   5
2021-01-28 06:26:11.369 >   Terminate   4
2021-01-28 06:26:11.369 >   Terminate   -1

When flags is true(1), running the same query:
>   Query   27 "COPY country TO STDOUT"
>   Query   -1
<   CopyOutResponse 13 \x00 #3 #0 #0 #0
<   CopyDone    4

<   CopyDone    4
<   CopyDone    4
<   CommandComplete 11 "COPY 0"
<   ReadyForQuery   5
>   Terminate   4
>   Terminate   -1


Regards,
Kirk Jamison
Attachment
On Mon, January 25, 2021 4:13 PM (JST), Tsunakawa-san wrote:.
> Also, please note this as:
>
> > Also, why don't you try running the regression tests with a temporary
> modification to PQtrace() to output the trace to a file?  The sole purpose is
> to confirm that this patch doesn't make the test crash (core dump).

I realized that existing libpq regression tests in src/test/examples do not
test PQtrace(). At the same time, no other functions Is calling PQtrace(),
so it's expected that by default if there are no compilation errors, then it
will pass all the tests. And it did.

So to check that the tracing feature is enabled and, as requested, outputs
a trace file, I temporarily modified a bit of testlibpq.c instead **based from
my current environment settings**, and ran the regression test.

diff --git a/src/test/examples/testlibpq.c b/src/test/examples/testlibpq.c
index 0372781..ae163e4 100644
--- a/src/test/examples/testlibpq.c
+++ b/src/test/examples/testlibpq.c
@@ -26,6 +26,7 @@ main(int argc, char **argv)
        int                     nFields;
        int                     i,
                                j;
+       FILE            *trace_file;

        /*
         * If the user supplies a parameter on the command line, use it as the
@@ -40,6 +41,9 @@ main(int argc, char **argv)
        /* Make a connection to the database */
        conn = PQconnectdb(conninfo);

+       trace_file = fopen("/home/postgres/tracelog/trace.out","w");
+       PQtrace(conn, trace_file, 0);
+
        /* Check to see that the backend connection was successfully made */
        if (PQstatus(conn) != CONNECTION_OK)
        {
@@ -127,5 +131,6 @@ main(int argc, char **argv)
        /* close the connection to the database and cleanup */
        PQfinish(conn);

+       fclose(trace_file);
        return 0;
 }


make -C src/test/examples/ PROGS=testlibpq
./src/test/examples/testlibpq


I've verified that it works (no crash) and outputs a trace file to the PATH that I set in libpqtest.

The trace file contains the following log for the testlibq:

2021-01-28 09:22:28.155 >   Query   59 "SELECT pg_catalog.set_config('search_path', '', false)"
2021-01-28 09:22:28.156 >   Query   -1
2021-01-28 09:22:28.157 <   RowDescription  35 #1 "set_config" 0 #0 25 #65535 -1 #0
2021-01-28 09:22:28.157 <   DataRow 10 #1 0
2021-01-28 09:22:28.157 <   CommandComplete 13 "SELECT 1"
2021-01-28 09:22:28.157 <   ReadyForQuery   5
2021-01-28 09:22:28.157 <   ReadyForQuery   5 I
2021-01-28 09:22:28.157 >   Query   10 "BEGIN"
2021-01-28 09:22:28.157 >   Query   -1
2021-01-28 09:22:28.157 <   CommandComplete 10 "BEGIN"
2021-01-28 09:22:28.157 <   ReadyForQuery   5
2021-01-28 09:22:28.157 <   ReadyForQuery   5 T
2021-01-28 09:22:28.157 >   Query   58 "DECLARE myportal CURSOR FOR select * from pg_database"
2021-01-28 09:22:28.157 >   Query   -1
2021-01-28 09:22:28.159 <   CommandComplete 19 "DECLARE CURSOR"
2021-01-28 09:22:28.159 <   ReadyForQuery   5
2021-01-28 09:22:28.159 <   ReadyForQuery   5 T
2021-01-28 09:22:28.159 >   Query   26 "FETCH ALL in myportal"
2021-01-28 09:22:28.159 >   Query   -1
2021-01-28 09:22:28.159 <   RowDescription  405 #14 "oid" 1262 #1 26 #4 -1 #0 "datname" 1262 #2 19 #64 -1 #0 "datdba"
1262#3 26 #4 -1 #0 "encoding" 1262 #4 23 #4 -1 #0 "datcollate" 1262 #5 19 #64 -1 #0 "datctype" 1262 #6 19 #64 -1 #0
"datistemplate"1262 #7 16 #1 -1 #0 "datallowconn" 1262 #8 16 #1 -1 #0 "datconnlimit" 1262 #9 23 #4 -1 #0
"datlastsysoid"1262 #10 26 #4 -1 #0 "datfrozenxid" 1262 #11 28 #4 -1 #0 "datminmxid" 1262 #12 28 #4 -1 #0
"dattablespace"1262 #13 26 #4 -1 #0 "datacl" 1262 #14 1034 #65535 -1 #0

2021-01-28 09:22:28.159 <   DataRow 117 #14 5 '13756' 8 'postgres' 2 '10' 1 '6' 11 'en_US.UTF-8' 11 'en_US.UTF-8' 1 'f'
1't' 2 '-1' 5 '13755' 3 '502' 1 '1' 4 '1663' -1

2021-01-28 09:22:28.159 <   DataRow 149 #14 1 '1' 9 'template1' 2 '10' 1 '6' 11 'en_US.UTF-8' 11 'en_US.UTF-8' 1 't' 1
't'2 '-1' 5 '13755' 3 '502' 1 '1' 4 '1663' 35 '{=c/postgres,postgres=CTc/postgres}'

2021-01-28 09:22:28.159 <   DataRow 153 #14 5 '13755' 9 'template0' 2 '10' 1 '6' 11 'en_US.UTF-8' 11 'en_US.UTF-8' 1
't'1 'f' 2 '-1' 5 '13755' 3 '502' 1 '1' 4 '1663' 35 '{=c/postgres,postgres=CTc/postgres}'

2021-01-28 09:22:28.159 <   CommandComplete 12 "FETCH 3"
2021-01-28 09:22:28.159 <   ReadyForQuery   5
2021-01-28 09:22:28.159 <   ReadyForQuery   5 T
2021-01-28 09:22:28.159 >   Query   19 "CLOSE myportal"
2021-01-28 09:22:28.159 >   Query   -1
2021-01-28 09:22:28.159 <   CommandComplete 17 "CLOSE CURSOR"
2021-01-28 09:22:28.159 <   ReadyForQuery   5
2021-01-28 09:22:28.159 <   ReadyForQuery   5 T
2021-01-28 09:22:28.159 >   Query   8 "END"
2021-01-28 09:22:28.159 >   Query   -1
2021-01-28 09:22:28.160 <   CommandComplete 11 "COMMIT"
2021-01-28 09:22:28.160 <   ReadyForQuery   5
2021-01-28 09:22:28.160 <   ReadyForQuery   5 I
2021-01-28 09:22:28.160 >   Terminate   4
2021-01-28 09:22:28.160 >   Terminate   -1


Regards,
Kirk Jamison
On 2021-Jan-28, k.jamison@fujitsu.com wrote:

> I realized that existing libpq regression tests in src/test/examples do not
> test PQtrace(). At the same time, no other functions Is calling PQtrace(),
> so it's expected that by default if there are no compilation errors, then it
> will pass all the tests. And it did.
>
> So to check that the tracing feature is enabled and, as requested, outputs
> a trace file, I temporarily modified a bit of testlibpq.c instead **based from
> my current environment settings**, and ran the regression test.

Yeah.  It seems useful to build a real test harness based on the new
tracing functionality.  And that is precisely why I added the option to
suppress timestamps: so that we can write trace files that do not vary
from run to run.  That allows us to have an "expected" trace to which we
can compare the trace file produced by the actual run.  I had the idea
that instead of a timestamp we would print a message counter.  I didn't
implement that, however.

So what we need to do now, before we cast in stone such expected files,
is ensure that the trace file produced by some program (be it
testlibpq.c or some other program) accurately matches what is sent over
the network.  If the tracing infrastructure has bugs, then the trace
will contain artifacts, and that's something to avoid.  For example, in
the trace you paste, why are there two "Query" messages every time, with
the second one having length -1?  I think this is a bug I introduced
recently.

> 2021-01-28 09:22:28.155 >   Query   59 "SELECT pg_catalog.set_config('search_path', '', false)"
> 2021-01-28 09:22:28.156 >   Query   -1
> 2021-01-28 09:22:28.157 <   RowDescription  35 #1 "set_config" 0 #0 25 #65535 -1 #0
> 2021-01-28 09:22:28.157 <   DataRow 10 #1 0
> 2021-01-28 09:22:28.157 <   CommandComplete 13 "SELECT 1"

And afterwards, why are always there two ReadyForQuery messages?

> 2021-01-28 09:22:28.157 <   ReadyForQuery   5
> 2021-01-28 09:22:28.157 <   ReadyForQuery   5 I

In ReadyForQuery, we also get a transaction status.  In this case it's
"I" which means "Idle" (pretty mysterious if you don't know, as was my
case).  A bunch of other values are possible.  Do we want to translate
this to human-readable flags, similarly to how we translate message tag
chars to message names?  Seems useful to me.  Or maybe it's
overengineering, about which see below.

> 2021-01-28 09:22:28.159 <   RowDescription  405 #14 "oid" 1262 #1 26 #4 -1 #0 "datname" 1262 #2 19 #64 -1 #0 "datdba"
1262#3 26 #4 -1 #0 "encoding" 1262 #4 23 #4 -1 #0 "datcollate" 1262 #5 19 #64 -1 #0 "datctype" 1262 #6 19 #64 -1 #0
"datistemplate"1262 #7 16 #1 -1 #0 "datallowconn" 1262 #8 16 #1 -1 #0 "datconnlimit" 1262 #9 23 #4 -1 #0
"datlastsysoid"1262 #10 26 #4 -1 #0 "datfrozenxid" 1262 #11 28 #4 -1 #0 "datminmxid" 1262 #12 28 #4 -1 #0
"dattablespace"1262 #13 26 #4 -1 #0 "datacl" 1262 #14 1034 #65535 -1 #0


This is terribly unreadable, but at this point that's okay because we're
just doing tracing at a very low level.  In the future we could add some
new flag PQTRACE_INTERPRET_MESSAGES or something, which changes the
output format to something more readable.  Or maybe nobody cares to
spend time doing that.

Cheers

--
Álvaro Herrera       Valdivia, Chile
"Para tener más hay que desear menos"
From: Jamison, Kirk/ジャミソン カーク <k.jamison@fujitsu.com>
> To make the CFBot happy, I fixed the compiler errors.
> I have not included here the change proposal to move the tracing functions to a
> new file: fe-trace.c or something, so I retained the changes .
> Maybe Iwata-san can consider the proposal.
> Currently, both pqTraceInit() and pqTraceUninit() are called only by one
> function.

I confirmed all mentioned points have been fixed.  Additional comments are:


(29)
-void PQtrace(PGconn *conn, FILE *stream);
+void PQtrace(PGconn *conn, FILE *stream, int flags);

As I said before, I'm afraid we cannot change the signature of existing API functions.  Please leave the signature of
thisfunction unchanged, and add a new function like PQtraceEx() that adds the flags argument.


I guess the purpose of adding the flag argument is to not output the timestamp by default, because getting timestamps
wouldincur significant overhead (however, I'm not sure if that overhead is worth worrying about given the already
incurredlogging overhead.)  So, I think it's better to have a flag like PQTRACE_OUTPUT_TIMESTAMPS instead of
PQTRACE_SUPPRESS_TIMESTAMPS,and the functions would look like:


void
PQtrace(PGconn *conn, FILE *stream)
{
    PQtraceEx(conn, stream, 0);
}

void
PQtraceEx(PGconn *conn, FILE *stream, int flags)
{
    ... the new implementation in the patch
}

Remember to add PQtraceEx in exports.txt and make sure it builds on Windows with Visual Studio.

But... can you evaluate the overhead for getting timestamps and see if we can turn it on by default, or further, if we
needsuch a flag and PQtraceEx()?  For example, how about comparing the times to run the regression test with and
withouttimestamps?


(30)
+/*
+ * Deallocate FE/BE message tracking memory.  We only do this because
+ * FE message can grow arbitrarily large, and skip it in the initial state,
+ * because it's likely pointless.
+ */
+void
+pqTraceUninit(PGconn *conn)
+{
+    if (conn->fe_msg &&
+        conn->fe_msg->num_fields != DEF_FE_MSGFIELDS)
+    {
+        free(conn->fe_msg);
+        conn->fe_msg = NULL;
+    }

What does the second if condition mean?  If it's not necessary, change the comment accordingly.


(31)
@@ -1011,11 +1615,16 @@ pqSendSome(PGconn *conn, int len)
 int
 pqFlush(PGconn *conn)
 {
-    if (conn->Pfdebug)
-        fflush(conn->Pfdebug);
-
     if (conn->outCount > 0)
+    {
+        /* XXX comment */
+        if (conn->Pfdebug)
+        {
+            pqLogFrontendMsg(conn, -1);
+            fflush(conn->Pfdebug);
+        }
         return pqSendSome(conn, conn->outCount);
+    }

Remove the comment line.


(32)
+#define INT_MAX    (2048/2)        /* maximum array size */

INT_MAX is available via:
#include <limits.h>


(33)
     /* realloc failed. Probably out of memory */
-    appendPQExpBufferStr(&conn->errorMessage,
-                         "cannot allocate memory for input buffer\n");
+    appendPQExpBuffer(&conn->errorMessage,
+                      "cannot allocate memory for input buffer\n");

This change appears to be irrelevant.


(34)
+static void
+pqStoreFeMsgStart(PGconn *conn, char type)
+{
+    if (PG_PROTOCOL_MAJOR(conn->pversion) >= 3)
+        conn->fe_msg->msg_type = type;
+}

Protocol version check is unnecessary because this tracing takes effect only in v3 protocol?


(35)
+        conn->fe_msg =
+            realloc(conn->fe_msg,
+                    sizeof(pqFrontendMessage) +
+                    2 * conn->fe_msg->max_fields * sizeof(pqFrontendMessageField));

Align this size calculation with that in pqTraceInit().


(36)
+    /* append milliseconds */
+    sprintf(timestr + strlen(timestr), ".%03d", (int) (tval.tv_usec / 1000));

Output microsecond instead.  As your example output shows, many lines show the exactly same timestamps and thus they
arenot distinguishable in time.


(37)
+static char *
+pqLogFormatTimestamp(char *timestr)
+{
...
+#define FORMATTED_TS_LEN 128
+    strftime(timestr, FORMATTED_TS_LEN,

Add an argument to this function that indicates the size of timestr.  Define FORMATTED_TS_LEN globally in this source
file,and have callers use it.  That is, the code like:


+        char        timestr[128];
+
+        fprintf(conn->Pfdebug, "%s\t>\t%s\t%d",
+                pqLogFormatTimestamp(timestr),

becomes:

+        char        timestr[FORMATTED_TS_LEN];
+
+        fprintf(conn->Pfdebug, "%s\t>\t%s\t%d",
+                pqLogFormatTimestamp(timestr, sizeof(timestr)),


(38)
+    if ((conn->traceFlags & PQTRACE_SUPPRESS_TIMESTAMPS) == 0)
+    {
+        char        timestr[128];
+
+        fprintf(conn->Pfdebug, "%s\t>\t%s\t%d",
+                pqLogFormatTimestamp(timestr),
+                pqGetProtocolMsgType(conn->fe_msg->msg_type,
+                                     MSGDIR_FROM_FRONTEND),
+                msgLen);
+    }
+    else
+        fprintf(conn->Pfdebug, ">\t%s\t%d",
+                pqGetProtocolMsgType(conn->fe_msg->msg_type,
+                                     MSGDIR_FROM_FRONTEND),
+                msgLen);

To reduce the code for easier modification, change the above code to something like:

+    char        timestr[128];
+    char        *timestr_p = "";
+
+    if ((conn->traceFlags & PQTRACE_SUPPRESS_TIMESTAMPS) == 0)
+        timestr_p = pqLogFormatTimestamp(timestr);
+    fprintf(conn->Pfdebug, "%s\t>\t%s\t%d",
+            timestr_p,
+            pqGetProtocolMsgType(conn->fe_msg->msg_type,
+                                 MSGDIR_FROM_FRONTEND),
+            msgLen);


Regards
Takayuki Tsunakawa
From: Jamison, Kirk/ジャミソン カーク <k.jamison@fujitsu.com>
> I realized that existing libpq regression tests in src/test/examples do not
> test PQtrace(). At the same time, no other functions Is calling PQtrace(),
> so it's expected that by default if there are no compilation errors, then it
> will pass all the tests. And it did.
>
> So to check that the tracing feature is enabled and, as requested, outputs
> a trace file, I temporarily modified a bit of testlibpq.c instead **based from
> my current environment settings**, and ran the regression test.

To run the tracing code in much more extensive cases, can you try running the whole SQL regression test with the
tracingenabled?  That is, run "make check-world" in the top directory of the source tree.


To enable tracing in every connection, you can probably insert PQtrace() call just before the return statement here in
connectDBComplete(). If you have enough disk space, it's better to accumulate the trace output by passing "a" to
fopen().

        switch (flag)
        {
            case PGRES_POLLING_OK:
                return 1;       /* success! */


Regards
Takayuki Tsunakawa
Hi all,

Thank you Kirk san for creating the v14 patch.
I update the patch.  I fixed all of Tsunakawa san's review comments.
I am trying to solve three bugs. Two bags were pointed out by Alvaro san
in a previous e-mail. And I found one bug.

> From: Alvaro Herrera <alvherre@alvh.no-ip.org>
> Sent: Friday, January 22, 2021 6:53 AM
...
> > (5)
> > @@ -966,10 +966,6 @@ pqSaveParameterStatus(PGconn *conn, const char
> *name, const char *value)
> >      pgParameterStatus *pstatus;
> >      pgParameterStatus *prev;
> >
> > -    if (conn->Pfdebug)
> > -        fprintf(conn->Pfdebug, "pqSaveParameterStatus: '%s' =
> '%s'\n",
> > -                name, value);
> > -
> >
> > Where is this information output instead?
>
> Hmm, seems to have been lost.  I restored it, but didn't verify
> the resulting behavior carefully.

I checked log output using Matsumura san's application app.c;
---
2021-01-27 11:29:49.718 <       ParameterStatus 22 "application_name" ""
pqSaveParameterStatus: 'application_name' = ''
2021-01-27 11:29:49.718 <       ParameterStatus 25 "client_encoding" "UTF8"
pqSaveParameterStatus: 'client_encoding' = 'UTF8'
---

New trace log prints "ParameterStatus" which report run-time parameter status.
And new log also prints parameter name and value in " StartupMessage " message.
We can know the parameter status using these protocol messages.
So I think "pqSaveParameterStatus:" is not necessary to output.

In StartupMessage, the protocol message is output as "UnknownMessage" like this.
 [...] >       UnknownMessage  38 '\x00\x03\x00\x00user\x00iwata\x00database\x00postgres\x00\x00'

To fix this, I want to move a protocol message without the first byte1 to a frontend message logging function.
I will work on this.

> From: 'Alvaro Herrera' <alvherre@alvh.no-ip.org>
> Sent: Friday, January 22, 2021 10:38 PM
> > Ah, that was the reason for separation.  Then, I'm fine with either
> > keeping the separation, or integrating the two functions in fe-misc.c
> > with PQuntrace() being also there.  I kind of think the latter is
> > better, because of code readability and, because tracing facility is
> > not a connection-related reature so categorizing it as "misc" feels
> > natural.
>
> Maybe we can create a new file specifically for this to avoid mixing
> unrelated stuff in fe-misc.c -- say fe-trace.c where all this new
> tracing stuff goes.

I moved PQtrace() from fe-connect.c to fe-misc.c.
And I agree with creating new file for new tracing functions. I will do this.

> From: 'Alvaro Herrera' <alvherre@alvh.no-ip.org>
> Sent: Thursday, January 28, 2021 11:14 PM
...
> On 2021-Jan-28, k.jamison@fujitsu.com wrote:
>
> > I realized that existing libpq regression tests in src/test/examples do not
> > test PQtrace(). At the same time, no other functions Is calling PQtrace(),
> > so it's expected that by default if there are no compilation errors, then it
> > will pass all the tests. And it did.
> >
> > So to check that the tracing feature is enabled and, as requested, outputs
> > a trace file, I temporarily modified a bit of testlibpq.c instead **based from
> > my current environment settings**, and ran the regression test.
>
> Yeah.  It seems useful to build a real test harness based on the new
> tracing functionality.  And that is precisely why I added the option to
> suppress timestamps: so that we can write trace files that do not vary
> from run to run.  That allows us to have an "expected" trace to which we
> can compare the trace file produced by the actual run.  I had the idea
> that instead of a timestamp we would print a message counter.  I didn't
> implement that, however.

I think it is a useful suggestion. However I couldn't think of how to find out
if the logs were really in the correct order. And implementing this change looks very complicated.
So I would like to brush up this patch at first.

> (29)
> -void PQtrace(PGconn *conn, FILE *stream);
> +void PQtrace(PGconn *conn, FILE *stream, int flags);
>
> As I said before, I'm afraid we cannot change the signature of existing API
> functions.  Please leave the signature of this function unchanged, and add a
> new function like PQtraceEx() that adds the flags argument.
>
> I guess the purpose of adding the flag argument is to not output the timestamp
> by default, because getting timestamps would incur significant overhead
> (however, I'm not sure if that overhead is worth worrying about given the
> already incurred logging overhead.)  So, I think it's better to have a flag like
> PQTRACE_OUTPUT_TIMESTAMPS instead of
> PQTRACE_SUPPRESS_TIMESTAMPS, and the functions would look like:
>
> void
> PQtrace(PGconn *conn, FILE *stream)
> {
>     PQtraceEx(conn, stream, 0);
> }
>
> void
> PQtraceEx(PGconn *conn, FILE *stream, int flags)
> {
>     ... the new implementation in the patch
> }
>
> Remember to add PQtraceEx in exports.txt and make sure it builds on
> Windows with Visual Studio.

I fixed just add new function.
I will look into similar changes so far and give PQtraceEx() a better name.


> But... can you evaluate the overhead for getting timestamps and see if we can
> turn it on by default, or further, if we need such a flag and PQtraceEx()?  For
> example, how about comparing the times to run the regression test with and
> without timestamps?

I will check it. And decide which is better by default.
In my understanding, one of the purpose of this flag is to make sure
the log order is correct regardless of timestamp. (for example, it is useful auto-regression test)
I think PQtraceEx() and this flag is necessary as a developer option at least.

> (30)
> +/*
> + * Deallocate FE/BE message tracking memory.  We only do this because
> + * FE message can grow arbitrarily large, and skip it in the initial state,
> + * because it's likely pointless.
> + */
> +void
> +pqTraceUninit(PGconn *conn)
> +{
> +    if (conn->fe_msg &&
> +        conn->fe_msg->num_fields != DEF_FE_MSGFIELDS)
> +    {
> +        free(conn->fe_msg);
> +        conn->fe_msg = NULL;
> +    }
>
> What does the second if condition mean?  If it's not necessary, change the
> comment accordingly.

I fix the comment and remove second if.


> (31)
> @@ -1011,11 +1615,16 @@ pqSendSome(PGconn *conn, int len)
>  int
>  pqFlush(PGconn *conn)
>  {
> -    if (conn->Pfdebug)
> -        fflush(conn->Pfdebug);
> -
>      if (conn->outCount > 0)
> +    {
> +        /* XXX comment */
> +        if (conn->Pfdebug)
> +        {
> +            pqLogFrontendMsg(conn, -1);
> +            fflush(conn->Pfdebug);
> +        }
>          return pqSendSome(conn, conn->outCount);
> +    }
>
> Remove the comment line.

I remove it.

> (32)
> +#define INT_MAX    (2048/2)        /* maximum array size */
>
> INT_MAX is available via:
> #include <limits.h>

I fixed it.

> (33)
>      /* realloc failed. Probably out of memory */
> -    appendPQExpBufferStr(&conn->errorMessage,
> -                         "cannot allocate memory
> for input buffer\n");
> +    appendPQExpBuffer(&conn->errorMessage,
> +                      "cannot allocate memory for input
> buffer\n");
>
> This change appears to be irrelevant.

I remove this code.

> (34)
> +static void
> +pqStoreFeMsgStart(PGconn *conn, char type)
> +{
> +    if (PG_PROTOCOL_MAJOR(conn->pversion) >= 3)
> +        conn->fe_msg->msg_type = type;
> +}
>
> Protocol version check is unnecessary because this tracing takes effect only in
> v3 protocol?

Yes, in PQtrace(), it is checked whether protocol 2.0 or 3.0 and tracing works only in v3.0. I remove it.


> (35)
> +        conn->fe_msg =
> +            realloc(conn->fe_msg,
> +                    sizeof(pqFrontendMessage) +
> +                    2 * conn->fe_msg->max_fields *
> sizeof(pqFrontendMessageField));
>
> Align this size calculation with that in pqTraceInit().

I fixed it like this;
+               conn->fe_msg =
+                       realloc(conn->fe_msg,
+                                       offsetof(pqFrontendMessage, fields) +
+                                       2 * conn->fe_msg->max_fields * sizeof(pqFrontendMessageField));


> (36)
> +    /* append milliseconds */
> +    sprintf(timestr + strlen(timestr), ".%03d", (int) (tval.tv_usec / 1000));
>
> Output microsecond instead.  As your example output shows, many lines
> show the exactly same timestamps and thus they are not distinguishable in
> time.

I changed %03d to %06d for microsecond.

> (37)
> +static char *
> +pqLogFormatTimestamp(char *timestr)
> +{
> ...
> +#define FORMATTED_TS_LEN 128
> +    strftime(timestr, FORMATTED_TS_LEN,
>
> Add an argument to this function that indicates the size of timestr.  Define
> FORMATTED_TS_LEN globally in this source file, and have callers use it.
> That is, the code like:
>
> +        char        timestr[128];
> +
> +        fprintf(conn->Pfdebug, "%s\t>\t%s\t%d",
> +                pqLogFormatTimestamp(timestr),
>
> becomes:
>
> +        char        timestr[FORMATTED_TS_LEN];
> +
> +        fprintf(conn->Pfdebug, "%s\t>\t%s\t%d",
> +                pqLogFormatTimestamp(timestr,
> sizeof(timestr)),

I fixed it.

> (38)
> +    if ((conn->traceFlags & PQTRACE_SUPPRESS_TIMESTAMPS) == 0)
> +    {
> +        char        timestr[128];
> +
> +        fprintf(conn->Pfdebug, "%s\t>\t%s\t%d",
> +                pqLogFormatTimestamp(timestr),
> +
>     pqGetProtocolMsgType(conn->fe_msg->msg_type,
> +
> MSGDIR_FROM_FRONTEND),
> +                msgLen);
> +    }
> +    else
> +        fprintf(conn->Pfdebug, ">\t%s\t%d",
> +
>     pqGetProtocolMsgType(conn->fe_msg->msg_type,
> +
> MSGDIR_FROM_FRONTEND),
> +                msgLen);
>
> To reduce the code for easier modification, change the above code to
> something like:
>
> +    char        timestr[128];
> +    char        *timestr_p = "";
> +
> +    if ((conn->traceFlags & PQTRACE_SUPPRESS_TIMESTAMPS) == 0)
> +        timestr_p = pqLogFormatTimestamp(timestr);
> +    fprintf(conn->Pfdebug, "%s\t>\t%s\t%d",
> +            timestr_p,
> +            pqGetProtocolMsgType(conn->fe_msg->msg_type,
> +
> MSGDIR_FROM_FRONTEND),
> +            msgLen);

I fixed it.

This patch should address the following:
1. fix 3 bugs
  1.1 -1 output in "Query" message
  1.2 two message output in "ReadyForQuery" message
  1.3 "StartupMessage" output as " UnknownMessage "
2. creating new file for new tracing functions

Regards,
Aya Iwata
Fujitsu
Attachment
On 2021-Jan-29, tsunakawa.takay@fujitsu.com wrote:

> (30)
> +/*
> + * Deallocate FE/BE message tracking memory.  We only do this because
> + * FE message can grow arbitrarily large, and skip it in the initial state,
> + * because it's likely pointless.
> + */
> +void
> +pqTraceUninit(PGconn *conn)
> +{
> +    if (conn->fe_msg &&
> +        conn->fe_msg->num_fields != DEF_FE_MSGFIELDS)
> +    {
> +        free(conn->fe_msg);
> +        conn->fe_msg = NULL;
> +    }
>
> What does the second if condition mean?  If it's not necessary, change the comment accordingly.

The rationale for that second condition is this: if the memory allocated
is the initial size, we don't free memory, because it would just be
allocated of the same size next time, and that size is not very big, so
it's not a big deal if we just let it be, so that it is reused if we
call PQtrace() again later.  However, if the allocated size is larger
than default, then it is possible that some previous tracing run has
enlarged the trace struct to a very large amount of memory, and we don't
want to leave that in place.

--
Álvaro Herrera       Valdivia, Chile
(39)
+      of tracing.  If (<literal>flags</literal> & <literal>PQTRACE_OUTPUT_TIMESTAMPS</literal>) is
+      true, then timestamp is not printed with each message.

The flag name (OUTPUT) and its description (not printed) doesn't match.

I think you can use less programmatical expression like "If <literal>flags</literal> contains
<literal>PQTRACE_OUTPUT_TIMESTAMPS</literal>".


(40)
diff --git a/src/interfaces/libpq/exports.txt b/src/interfaces/libpq/exports.txt
+PQtraceEx                 180
\ No newline at end of file

What's the second line?  Isn't the file missing an empty line at the end?

(41)
+void
+PQtraceEx(PGconn *conn, FILE *debug_port, int flags)
+{
+    if (conn == NULL)
+        return;
...
+    if (!debug_port)
+        return;

The if should better be as follows to match the style of existing surrounding code.

+    if (debug_port == NULL)


(42)
+pqLogFormatTimestamp(char *timestr, Size ts_len)

I think you should use int or size_t instead of Size here, because other libpq code uses them.  int should be enough.
Ifthe compiler gives warnings, prepend "(int)" before sizeof() at call sites.


(43)
+    /* append microseconds */
+    sprintf(timestr + strlen(timestr), ".%06d", (int) (tval.tv_usec / 1000));

"/ 1000" should be removed.


(44)
+    if ((conn->traceFlags & PQTRACE_OUTPUT_TIMESTAMPS) == 0)
+        timestr_p = pqLogFormatTimestamp(timestr, sizeof(timestr));

== 0 should be removed.


Regards
Takayuki Tsunakawa
From: 'Alvaro Herrera' <alvherre@alvh.no-ip.org>
> > +        conn->fe_msg->num_fields != DEF_FE_MSGFIELDS)

> The rationale for that second condition is this: if the memory allocated
> is the initial size, we don't free memory, because it would just be
> allocated of the same size next time, and that size is not very big, so
> it's not a big deal if we just let it be, so that it is reused if we
> call PQtrace() again later.  However, if the allocated size is larger
> than default, then it is possible that some previous tracing run has
> enlarged the trace struct to a very large amount of memory, and we don't
> want to leave that in place.

Ah, understood.  In that case, num_fields should be max_fields.

This has reminded me that freePGconn() should free be_msg and fe_msg.


Regards
Takayuki Tsunakawa
At Wed, 3 Feb 2021 01:26:41 +0000, "tsunakawa.takay@fujitsu.com" <tsunakawa.takay@fujitsu.com> wrote in
> (41)
> +void
> +PQtraceEx(PGconn *conn, FILE *debug_port, int flags)
> +{
> +    if (conn == NULL)
> +        return;
> ...
> +    if (!debug_port)
> +        return;
>
> The if should better be as follows to match the style of existing surrounding code.
>
> +    if (debug_port == NULL)

I don't have particular preference here, but FWIW the current
PQuntrace is doing this:

> void
> PQuntrace(PGconn *conn)
> {
>     if (conn == NULL)
>         return;
>     if (conn->Pfdebug)
>     {
>         fflush(conn->Pfdebug);

> (44)
> +    if ((conn->traceFlags & PQTRACE_OUTPUT_TIMESTAMPS) == 0)
> +        timestr_p = pqLogFormatTimestamp(timestr, sizeof(timestr));
>
> == 0 should be removed.

Looking the doc mentioned in the comment #39:

+      <literal>flags</literal> contains flag bits describing the operating mode
+      of tracing.  If (<literal>flags</literal> & <literal>PQTRACE_OUTPUT_TIMESTAMPS</literal>) is
+      true, then timestamp is not printed with each message.

PQTRACE_OUTPUT_TIMESTAMPS is designed to *inhibit* timestamps from
being prepended. If that is actually intended, the symbol name should
be PQTRACE_NOOUTPUT_TIMESTAMP. Otherwise, the doc need to be fixed.

By the way removing "== 0" makes it difficult to tell whether the
condition is correct or not; I recommend to use '!= 0" rather than
removing '== 0'.

regards.

--
Kyotaro Horiguchi
NTT Open Source Software Center
On 2021-Feb-03, Kyotaro Horiguchi wrote:

> Looking the doc mentioned in the comment #39:
>
> +      <literal>flags</literal> contains flag bits describing the operating mode
> +      of tracing.  If (<literal>flags</literal> & <literal>PQTRACE_OUTPUT_TIMESTAMPS</literal>) is
> +      true, then timestamp is not printed with each message.
>
> PQTRACE_OUTPUT_TIMESTAMPS is designed to *inhibit* timestamps from
> being prepended. If that is actually intended, the symbol name should
> be PQTRACE_NOOUTPUT_TIMESTAMP. Otherwise, the doc need to be fixed.

I'm pretty sure I named the flag PQTRACE_SUPPRESS_TIMESTAMP (and I
prefer SUPPRESS to NOOUTPUT), because the idea is that the timestamp is
printed by default.  I think that's the sensible decision: applications
prefer to have timestamps, even if there's a tiny bit of overhead.  We
don't want to force them to pass a flag for that.  We only want the
no-timestamp behavior in order to be able to use it for libpq internal
testing.

--
Álvaro Herrera                            39°49'30"S 73°17'W
"Someone said that it is at least an order of magnitude more work to do
production software than a prototype. I think he is wrong by at least
an order of magnitude."                              (Brian Kernighan)
On 2021-Feb-03, tsunakawa.takay@fujitsu.com wrote:

> (39)
> +      of tracing.  If (<literal>flags</literal> & <literal>PQTRACE_OUTPUT_TIMESTAMPS</literal>) is
> +      true, then timestamp is not printed with each message.
>
> The flag name (OUTPUT) and its description (not printed) doesn't match.
>
> I think you can use less programmatical expression like "If <literal>flags</literal> contains
<literal>PQTRACE_OUTPUT_TIMESTAMPS</literal>".

I copied the original style from elsewhere in the manual.

> (41)
> +void
> +PQtraceEx(PGconn *conn, FILE *debug_port, int flags)
> +{

I'm not really sure about making this a separate API call. We could just
make it PQtrace() and increment the libpq so version.  I don't think
it's a big deal, frankly.

--
Álvaro Herrera                            39°49'30"S 73°17'W
"El conflicto es el camino real hacia la unión"
On 2021-Feb-03, tsunakawa.takay@fujitsu.com wrote:

> From: 'Alvaro Herrera' <alvherre@alvh.no-ip.org>
> > > +        conn->fe_msg->num_fields != DEF_FE_MSGFIELDS)
>
> > The rationale for that second condition is this: if the memory allocated
> > is the initial size, we don't free memory, because it would just be
> > allocated of the same size next time, and that size is not very big, so
> > it's not a big deal if we just let it be, so that it is reused if we
> > call PQtrace() again later.  However, if the allocated size is larger
> > than default, then it is possible that some previous tracing run has
> > enlarged the trace struct to a very large amount of memory, and we don't
> > want to leave that in place.
>
> Ah, understood.  In that case, num_fields should be max_fields.

Oh, of course.


--
Álvaro Herrera                            39°49'30"S 73°17'W
"Just treat us the way you want to be treated + some extra allowance
 for ignorance."                                    (Michael Brusser)
From: Alvaro Herrera <alvherre@alvh.no-ip.org>
> I'm pretty sure I named the flag PQTRACE_SUPPRESS_TIMESTAMP (and I
> prefer SUPPRESS to NOOUTPUT), because the idea is that the timestamp is
> printed by default.  I think that's the sensible decision: applications
> prefer to have timestamps, even if there's a tiny bit of overhead.  We
> don't want to force them to pass a flag for that.  We only want the
> no-timestamp behavior in order to be able to use it for libpq internal
> testing.

Agreed.  It makes sense to print timestamps by default because this feature will be used to diagnose slowness outside
thedatabase server.  (I misunderstood the motivation to introduce the flag).


Regards
Takayuki Tsunakawa
From: 'Alvaro Herrera' <alvherre@alvh.no-ip.org>
> > (41)
> > +void
> > +PQtraceEx(PGconn *conn, FILE *debug_port, int flags)
> > +{
>
> I'm not really sure about making this a separate API call. We could just
> make it PQtrace() and increment the libpq so version.  I don't think
> it's a big deal, frankly.

If we change the function signature, we have to bump the so major version and thus soname.  The libpq's current so
majorversion is 5, which hasn't been changed since 2006.  I'm hesitant to change it for this feature.  If you think we
canbump the version to 6, I think we can go.


https://tldp.org/HOWTO/Program-Library-HOWTO/shared-libraries.html
--------------------------------------------------
try to make sure that your libraries are either backwards-compatible or that you've incremented the version number in
thesoname every time you make an incompatible change.


When a new version of a library is binary-incompatible with the old one the soname needs to change. In C, there are
fourbasic reasons that a library would cease to be binary compatible:


1. The behavior of a function changes so that it no longer meets its original specification,

2. Exported data items change (exception: adding optional items to the ends of structures is okay, as long as those
structuresare only allocated within the library).


3. An exported function is removed.

4. The interface of an exported function changes.
--------------------------------------------------


Regards
Takayuki Tsunakawa
HI all,

I update the patch.
I modified code according to review comments of Tsunakawa san and Horiguchi san.

And I fixed some bugs.

> This patch should address the following:
> 1. fix 3 bugs
>   1.1 -1 output in "Query" message

The cause of this bug is that it call in pqFlush() function before flushing.
The purpose of calling pqLogFrontendMsg() here is to log the data that was in the buffer but not logged before
flushing.
The second argument of pqLogFrontendMsg() is message length, but we can't find it in pqFlush().
Therefor,  -1 was set here as a second argument and it was logged.
I thought about keeping the length as fields, but from the output Kirk san tried, this doesn't seem to happen.
Also, the message from the frontend to the backend calls pqPutMsgEnd () in advance, so the message should already be
logged.
So I deleted this call.

>   1.2 two message output in "ReadyForQuery" message

In the pqParseInput3 (), when the state becomes PGASYNC_IDLE, it returns to the caller.
After that,  pqParseInput3 () is called again and protocol message and length are output again by calling pqGetc(),
pqGetInt().

To limit this, set the skipLogging flag when the status become PGASYNC_IDLE and fixed to skip the next pqGetc(),
pqGetInt().

>   1.3 "StartupMessage" output as " UnknownMessage "

I moved the code that handles the output of "SSLRequest", "StartupMessage", etc.
to pqLogFrontendMsg() which is the function that outputs the front-end message.


> 2. creating new file for new tracing functions

I create new files libpq-logging.c and libpq-logging.h

> From: Tsunakawa, Takayuki/綱川 貴之 <tsunakawa.takay@fujitsu.com>
> Sent: Wednesday, February 3, 2021 10:27 AM

> (39)
> +      of tracing.  If (<literal>flags</literal> &
> <literal>PQTRACE_OUTPUT_TIMESTAMPS</literal>) is
> +      true, then timestamp is not printed with each message.
>
> The flag name (OUTPUT) and its description (not printed) doesn't match.

I changed flag name to PQTRACE_SUPPRESS_TIMESTAMPS.

>
> I think you can use less programmatical expression like "If
> <literal>flags</literal> contains
> <literal>PQTRACE_OUTPUT_TIMESTAMPS</literal>".
I fixed.

> (40)
> diff --git a/src/interfaces/libpq/exports.txt b/src/interfaces/libpq/exports.txt
> +PQtraceEx                 180
> \ No newline at end of file
>
> What's the second line?  Isn't the file missing an empty line at the end?

I delete it.


> (41)
> +void
> +PQtraceEx(PGconn *conn, FILE *debug_port, int flags) {
> +    if (conn == NULL)
> +        return;
> ...
> +    if (!debug_port)
> +        return;
>
> The if should better be as follows to match the style of existing surrounding
> code.
>
> +    if (debug_port == NULL)

I fixed it.

> (42)
> +pqLogFormatTimestamp(char *timestr, Size ts_len)
>
> I think you should use int or size_t instead of Size here, because other libpq
> code uses them.  int should be enough.  If the compiler gives warnings,
> prepend "(int)" before sizeof() at call sites.

I fixed it.


> (43)
> +    /* append microseconds */
> +    sprintf(timestr + strlen(timestr), ".%06d", (int) (tval.tv_usec /
> +1000));
>
> "/ 1000" should be removed.

I removed it.

> (44)
> +    if ((conn->traceFlags & PQTRACE_OUTPUT_TIMESTAMPS) == 0)
> +        timestr_p = pqLogFormatTimestamp(timestr,
> sizeof(timestr));
>
> == 0 should be removed.

I left it, referring Horiguchi san's comment.

Regards,
Aya Iwata
Attachment
From: Iwata, Aya/岩田 彩 <iwata.aya@fujitsu.com>
> I update the patch.
> I modified code according to review comments of Tsunakawa san and
> Horiguchi san.


I confirmed that all the previous feedback was reflected.  Here are some minor comments:


(45)
 void PQtrace(PGconn *conn, FILE *stream);
 </synopsis>
      </para>

+     <para>
+      Calls <function>PQtraceEx</function> to output with or without a timestamp
+      using <literal>flags</literal>.
+     </para>
+
+     <para>
+      <literal>flags</literal> contains flag bits describing the operating mode
+      of tracing.  If (<literal>flags</literal> contains <literal>PQTRACE_SUPPRESS_TIMESTAMPS</literal>),
+      then timestamp is not printed with each message.

The description of PQtrace() should be written independent of PQtraceEx().  It is an unnecessary implementation detail
tothe user that PQtrace() calls PQtraceEx() internally.  Plus, a separate entry for PQtraceEx() needs to be added.


(46)

If skipLogging is intended for use with backend -> frontend messages only, shouldn't it be placed in conn->b_msg?


(47)
+    /* Deallocate FE/BE message tracking memory. */
+    if (conn->fe_msg &&
+        /*
+         * If fields is allocated the initial size, we reuse it next time,
+         * because it would be allocated same size and the size is not big.
+         */
+            conn->fe_msg->max_fields != DEF_FE_MSGFIELDS)

I'm not completely sure if other places interpose a block comment like this between if/for/while conditions, but I
thinkit's better to put the comment before if.


Regards
Takayuki Tsunakawa
At Tue, 9 Feb 2021 02:26:25 +0000, "tsunakawa.takay@fujitsu.com" <tsunakawa.takay@fujitsu.com> wrote in
> From: Iwata, Aya/岩田 彩 <iwata.aya@fujitsu.com>
> > I update the patch.
> > I modified code according to review comments of Tsunakawa san and
> > Horiguchi san.
>
>
> I confirmed that all the previous feedback was reflected.  Here are some minor comments:
>
>
> (45)
>  void PQtrace(PGconn *conn, FILE *stream);
>  </synopsis>
>       </para>
>
> +     <para>
> +      Calls <function>PQtraceEx</function> to output with or without a timestamp
> +      using <literal>flags</literal>.
> +     </para>
> +
> +     <para>
> +      <literal>flags</literal> contains flag bits describing the operating mode
> +      of tracing.  If (<literal>flags</literal> contains <literal>PQTRACE_SUPPRESS_TIMESTAMPS</literal>),
> +      then timestamp is not printed with each message.
>
> The description of PQtrace() should be written independent of PQtraceEx().  It is an unnecessary implementation
detailto the user that PQtrace() calls PQtraceEx() internally.  Plus, a separate entry for PQtraceEx() needs to be
added.

This looks like a fusion of PQtrace and PQtraceEX. By the way, the
timestamp flag is needed at log emittion. So we can change the state
anytime.

PQtrace(conn, of);
PQtraceSetFlags(conn, PQTRACE_SUPPRESS_TIMESTAMPS);
<logging without timestamps>
PQtraceSetFlags(conn, 0);
<logging with timestamps>
..


> (46)
>
> If skipLogging is intended for use with backend -> frontend messages only, shouldn't it be placed in conn->b_msg?

The name skipLogging is somewhat obscure. The flag doesn't inhibit all
logs from being emitted.  It seems like it represents how far bytes
the logging mechanism consumed for the limited cases. Thus, I think it
can be a cursor variable like inCursor.

If we have conn->be_msg->inLogged, for example, pqGetc and
pqLogMessageByte1() are written as the follows.

pqGetc(char *result, PGconn *conn)
{
    if (conn->inCursor >= conn->inEnd)
        return EOF;

    *result = conn->inBuffer[conn->inCursor++];

    if (conn->Pfdebug)
        pqLogMessageByte1(conn, *result);

    return 0;
}

pqLogMessageByte1(...)
{
   switch()
   {
     case LOG_FIRST_BYTE:
       /* No point in logging already logged bytes */
       if (conn->be_msg->inLogged >= conn->inCursor)
         return;
   ...
   }
   conn->be_msg->inLogged = conn->inCursor;
}

(pqCheckInBufferSpace needs to adjust inLogged.)

I'm not sure this is easier to read than the skipLogging.

> (47)
> +    /* Deallocate FE/BE message tracking memory. */
> +    if (conn->fe_msg &&
> +        /*
> +         * If fields is allocated the initial size, we reuse it next time,
> +         * because it would be allocated same size and the size is not big.
> +         */
> +            conn->fe_msg->max_fields != DEF_FE_MSGFIELDS)
>
> I'm not completely sure if other places interpose a block comment like this between if/for/while conditions, but I
thinkit's better to put the comment before if.


(s/is/are/)

Agreed. At least it doesn't look good.

regards.

--
Kyotaro Horiguchi
NTT Open Source Software Center
From: Kyotaro Horiguchi <horikyota.ntt@gmail.com>
> > (45)
> This looks like a fusion of PQtrace and PQtraceEX. By the way, the
> timestamp flag is needed at log emittion. So we can change the state
> anytime.
>
> PQtrace(conn, of);
> PQtraceSetFlags(conn, PQTRACE_SUPPRESS_TIMESTAMPS);
> <logging without timestamps>
> PQtraceSetFlags(conn, 0);
> <logging with timestamps>

I find this better because the application does not have to call PQuntrace() and PQtrace() again to enable/disable
timestampoutput, which requires passing the FILE pointer again.  (I don't imagine applications would repeatedly turn
loggingon and off in practice, though.)


> > (46)
> >
> > If skipLogging is intended for use with backend -> frontend messages only,
> shouldn't it be placed in conn->b_msg?
>
> The name skipLogging is somewhat obscure. The flag doesn't inhibit all
> logs from being emitted.  It seems like it represents how far bytes
> the logging mechanism consumed for the limited cases. Thus, I think it
> can be a cursor variable like inCursor.
>
> If we have conn->be_msg->inLogged, for example, pqGetc and
> pqLogMessageByte1() are written as the follows.
>
> pqGetc(char *result, PGconn *conn)
> {
>     if (conn->inCursor >= conn->inEnd)
>         return EOF;
>
>     *result = conn->inBuffer[conn->inCursor++];
>
>     if (conn->Pfdebug)
>         pqLogMessageByte1(conn, *result);
>
>     return 0;
> }
>
> pqLogMessageByte1(...)
> {
>    switch()
>    {
>      case LOG_FIRST_BYTE:
>        /* No point in logging already logged bytes */
>        if (conn->be_msg->inLogged >= conn->inCursor)
>          return;
>    ...
>    }
>    conn->be_msg->inLogged = conn->inCursor;
> }

This looks better design because stuff like skipLogging is an internal state of logging facility whose use should be
restrictedto fe-logging.c.

> (pqCheckInBufferSpace needs to adjust inLogged.)
>
> I'm not sure this is easier to read than the skipLogging.

I'd like Iwata-san to evaluate this and decide whether to take this approach or the current one.


Regards
Takayuki Tsunakawa
At Mon, 8 Feb 2021 14:57:47 +0000, "iwata.aya@fujitsu.com" <iwata.aya@fujitsu.com> wrote in
> I update the patch.
> I modified code according to review comments of Tsunakawa san and Horiguchi san.
>
> And I fixed some bugs.

Thanks for the new version.

+typedef enum
+{
+    MSGDIR_FROM_BACKEND,
+    MSGDIR_FROM_FRONTEND
+} PGCommSource;

This is halfly exposed to other part of libpq. Specifically only
MSGDIR_FROM_BACKEND is used in fe-misc.c and only for
pgLogMessageString and pqLogMessagenchar. I would suggest to hide this
enum from fe-misc.c.

Looking into pqLogMessageString,

+pqLogMessageString(PGconn *conn, const char *v, int length, PGCommSource source)
+{
+    if (source == MSGDIR_FROM_BACKEND && conn->be_msg->state != LOG_CONTENTS)
+    {
+        pqLogInvalidProtocol(conn, MSGDIR_FROM_BACKEND);
+        return;    /* XXX ??? */
+    }
+
+    fprintf(conn->Pfdebug, "\"%s\"", v);
+    if (source == MSGDIR_FROM_BACKEND)
+        pqTraceMaybeBreakLine(length, conn);
+}

The only part that shared by both be and fe is the fprintf().  I think
it can be naturally split into separate functions for backend and
frontend messages.

Looking into pqLogMessagenchar,

+/*
+ * pqLogMessagenchar: output a string of exactly len bytes message to the log
+ */
+void
+pqLogMessagenchar(PGconn *conn, const char *v, int len, PGCommSource commsource)
+{
+    fprintf(conn->Pfdebug, "\'");
+    pqLogBinaryMsg(conn, v, len, commsource);
+    fprintf(conn->Pfdebug, "\'");
+    pqTraceMaybeBreakLine(len, conn);
+}

+static void
+pqLogBinaryMsg(PGconn *conn, const char *v, int length, PGCommSource source)
+{
+    int            i,
+                pin;
+
+    if (source == MSGDIR_FROM_BACKEND && conn->be_msg->state != LOG_CONTENTS)
+    {
+        pqLogInvalidProtocol(conn, MSGDIR_FROM_BACKEND);
+        return;    /* XXX ??? */

# What is this???

+    }
    .. shared part
+}

pqLogMessagenchar is the sole caller of pqLogBinaryMsg. So we can
refactor the two functions and have pqLogMessagenchar_for_be and
_for_fe without a fear of the side effect to other callers.  (The
names are discussed below.)


+typedef enum PGLogState
+{

This is libpq-logging.c internal type. It is not needed to be exposed.


+extern void pqTraceForcelyBreakLine(int size, PGconn *conn);
+extern void pqStoreFrontendMsg(PGconn *conn, PGLogMsgDataType type, int length)+extern void pqStoreFeMsgStart(PGconn
*conn,char type);

+extern void pqLogFrontendMsg(PGconn *conn, int msgLen);
+extern void pqLogMessageByte1(PGconn *conn, char v);
+extern void pqLogMessageInt(PGconn *conn, int v, int length);
+extern void pqLogMessageString(PGconn *conn, const char *v, int length,
+                               PGCommSource commsource);
+extern void pqLogMessagenchar(PGconn *conn, const char *v, int length,
+                              PGCommSource commsource);

The API functions looks like randomly/inconsistently named and
designed.  I think that API should be in more structurally designed.

The comments about individual function names follow.

+/*
+ * pqTraceForcelyBreakLine:
+ *         If message is not completed, print a line break and reset.
+ */
+void
+pqTraceForcelyBreakLine(int size, PGconn *conn)
+{
+    fprintf(conn->Pfdebug, "\n");
+    pqTraceResetBeMsg(conn);
+}

Differently from the comment, this function doesn't work in a
conditional way nor in a forceful way. It is just putting a new line
and resetting the backend message variables.  I would name this as
pqTrace(Finish|Close)BeMsgLog().

+/*
+ * pqStoreFrontendMsg
+ *        Keep track of a from-frontend message that was just written to the
+ *        output buffer.
+ *
+ * Frontend messages are constructed piece by piece, and the message length
+ * is determined at the end, but sent to the server first; so for tracing
+ * purposes we store everything in memory and print to the trace file when
+ * the message is complete.
+ */
+void
+pqStoreFrontendMsg(PGconn *conn, PGLogMsgDataType type, int length)
+{

I would name this as pqTrace(Store/Append)FeMsg().


+void
+pqStoreFeMsgStart(PGconn *conn, char type)
+{
+    conn->fe_msg->msg_type = type;
+}

The name says that "stores the message "start"". But it actually
stores the message type. I would name this as
pqTraceSetFeMsgType(). Or in contrast to pqTraceFinishBeMsgLog, this
can be named as pqTrace(Start|Begin|Init)BeMsgLog().


+ * pqLogFrontendMsg
+ *        Print accumulated frontend message pieces to the trace file.
+ */
+void
+pqLogFrontendMsg(PGconn *conn, int msgLen)

I would name this as pqTraceEmitFeMsgLog().


+ * pqLogMessageByte1: output 1 char from-backend message to the log
+ * pqLogMessageInt: output a 2- or 4-byte integer from-backend msg to the log

I would name this as pqTraceEmitBeByteLog(), pqTraceEmitBeIntLog()
respectively.

+ * pqLogMessageString: output a null-terminated string to the log

This function is used for both directions. pqTraceEmitStringLog(). If it is split into fe and be parts, they would be
pqTraceEmit(Be|Fe)StringLog().


+ * pqLogMessagenchar: output a string of exactly len bytes message to the log

This logs a byte sequence in hexadecimals. I would name that as
pqTraceEmitBytesLog(). Or pqTraceEmit(Be|Fe)BytesLog().


...I finish once here.

Is there any thoughts? Optinions on the namings?

regards.

--
Kyotaro Horiguchi
NTT Open Source Software Center
At Tue, 9 Feb 2021 08:10:19 +0000, "tsunakawa.takay@fujitsu.com" <tsunakawa.takay@fujitsu.com> wrote in
> From: Kyotaro Horiguchi <horikyota.ntt@gmail.com>
> > > (45)
> > This looks like a fusion of PQtrace and PQtraceEX. By the way, the
> > timestamp flag is needed at log emittion. So we can change the state
> > anytime.
> >
> > PQtrace(conn, of);
> > PQtraceSetFlags(conn, PQTRACE_SUPPRESS_TIMESTAMPS);
> > <logging without timestamps>
> > PQtraceSetFlags(conn, 0);
> > <logging with timestamps>
>
> I find this better because the application does not have to call PQuntrace() and PQtrace() again to enable/disable
timestampoutput, which requires passing the FILE pointer again.  (I don't imagine applications would repeatedly turn
loggingon and off in practice, though.)


Thanks and Yes, I also don't imagine that users change the timestmp
state repeatedly:p It's just a example.

> > > (46)
> > >
> > > If skipLogging is intended for use with backend -> frontend messages only,
> > shouldn't it be placed in conn->b_msg?
> >
> > The name skipLogging is somewhat obscure. The flag doesn't inhibit all
> > logs from being emitted.  It seems like it represents how far bytes
> > the logging mechanism consumed for the limited cases. Thus, I think it
> > can be a cursor variable like inCursor.
> >
> > If we have conn->be_msg->inLogged, for example, pqGetc and
> > pqLogMessageByte1() are written as the follows.
> >
> > pqGetc(char *result, PGconn *conn)
> > {
> >     if (conn->inCursor >= conn->inEnd)
> >         return EOF;
> >
> >     *result = conn->inBuffer[conn->inCursor++];
> >
> >     if (conn->Pfdebug)
> >         pqLogMessageByte1(conn, *result);
> >
> >     return 0;
> > }
> >
> > pqLogMessageByte1(...)
> > {
> >    switch()
> >    {
> >      case LOG_FIRST_BYTE:
> >        /* No point in logging already logged bytes */
> >        if (conn->be_msg->inLogged >= conn->inCursor)
> >          return;
> >    ...
> >    }
> >    conn->be_msg->inLogged = conn->inCursor;
> > }
>
> This looks better design because stuff like skipLogging is an internal state of logging facility whose use should be
restrictedto fe-logging.c.

>
> > (pqCheckInBufferSpace needs to adjust inLogged.)
> >
> > I'm not sure this is easier to read than the skipLogging.
>
> I'd like Iwata-san to evaluate this and decide whether to take this approach or the current one.

+1

regards.

--
Kyotaro Horiguchi
NTT Open Source Software Center
On 2021-Feb-04, tsunakawa.takay@fujitsu.com wrote:

> From: 'Alvaro Herrera' <alvherre@alvh.no-ip.org>
> > > (41)
> > > +void
> > > +PQtraceEx(PGconn *conn, FILE *debug_port, int flags)
> > > +{
> >
> > I'm not really sure about making this a separate API call. We could just
> > make it PQtrace() and increment the libpq so version.  I don't think
> > it's a big deal, frankly.
>
> If we change the function signature, we have to bump the so major version and thus soname.  The libpq's current so
majorversion is 5, which hasn't been changed since 2006.  I'm hesitant to change it for this feature.  If you think we
canbump the version to 6, I think we can go.


I think it's pretty clear we would not change the so-version for this
feature.


--
Álvaro Herrera                            39°49'30"S 73°17'W
On 2021-Feb-09, Kyotaro Horiguchi wrote:

> This looks like a fusion of PQtrace and PQtraceEX. By the way, the
> timestamp flag is needed at log emittion. So we can change the state
> anytime.
>
> PQtrace(conn, of);
> PQtraceSetFlags(conn, PQTRACE_SUPPRESS_TIMESTAMPS);

I like this idea better than PQtraceEx().

--
Álvaro Herrera                            39°49'30"S 73°17'W
Hi all,

Thank you for your review. I update patch to v17.

> From: Tsunakawa, Takayuki/綱川 貴之 <tsunakawa.takay@fujitsu.com>
> Sent: Tuesday, February 9, 2021 11:26 AM
> (45)
...
> The description of PQtrace() should be written independent of PQtraceEx().
> It is an unnecessary implementation detail to the user that PQtrace() calls
> PQtraceEx() internally.  Plus, a separate entry for PQtraceEx() needs to be
> added.

I add PQtraceSetFlags() description instead of PQtraceEx() in response to Horiguchi san's suggestion.

> (46)
>
> If skipLogging is intended for use with backend -> frontend messages only,
> shouldn't it be placed in conn->b_msg?

I moved skip flag to be_msg.

> (47)
...
> I'm not completely sure if other places interpose a block comment like this
> between if/for/while conditions, but I think it's better to put the comment
> before if.

I moved this comment to before if.

> From: Kyotaro Horiguchi <horikyota.ntt@gmail.com>
> Sent: Tuesday, February 9, 2021 5:26 PM

> +typedef enum
> +{
> +    MSGDIR_FROM_BACKEND,
> +    MSGDIR_FROM_FRONTEND
> +} PGCommSource;
>
> This is halfly exposed to other part of libpq. Specifically only
> MSGDIR_FROM_BACKEND is used in fe-misc.c and only for
> pgLogMessageString and pqLogMessagenchar. I would suggest to hide this
> enum from fe-misc.c.
>
> Looking into pqLogMessageString,
>
> +pqLogMessageString(PGconn *conn, const char *v, int length,
> PGCommSource source)
> +{
> +    if (source == MSGDIR_FROM_BACKEND &&
> conn->be_msg->state != LOG_CONTENTS)
> +    {
> +        pqLogInvalidProtocol(conn, MSGDIR_FROM_BACKEND);
> +        return;    /* XXX ??? */
> +    }
> +
> +    fprintf(conn->Pfdebug, "\"%s\"", v);
> +    if (source == MSGDIR_FROM_BACKEND)
> +        pqTraceMaybeBreakLine(length, conn);
> +}
>
> The only part that shared by both be and fe is the fprintf().  I think
> it can be naturally split into separate functions for backend and
> frontend messages.
>
> Looking into pqLogMessagenchar,
>
> +/*
> + * pqLogMessagenchar: output a string of exactly len bytes message to the
> log
> + */
> +void
> +pqLogMessagenchar(PGconn *conn, const char *v, int len, PGCommSource
> commsource)
> +{
> +    fprintf(conn->Pfdebug, "\'");
> +    pqLogBinaryMsg(conn, v, len, commsource);
> +    fprintf(conn->Pfdebug, "\'");
> +    pqTraceMaybeBreakLine(len, conn);
> +}
>
> +static void
> +pqLogBinaryMsg(PGconn *conn, const char *v, int length, PGCommSource
> source)
> +{
> +    int            i,
> +                pin;
> +
> +    if (source == MSGDIR_FROM_BACKEND &&
> conn->be_msg->state != LOG_CONTENTS)
> +    {
> +        pqLogInvalidProtocol(conn, MSGDIR_FROM_BACKEND);
> +        return;    /* XXX ??? */
>
> # What is this???
>
> +    }
>     .. shared part
> +}
>
> pqLogMessagenchar is the sole caller of pqLogBinaryMsg. So we can
> refactor the two functions and have pqLogMessagenchar_for_be and
> _for_fe without a fear of the side effect to other callers.  (The
> names are discussed below.)

Thank you for your advice on refactoring.
Separating pqLogMessagenchar() into pqLogMessagenchar_for_be and pqLogMessagenchar_for_fe
seemed like adding more similar code. So I didn't work on it.

> +typedef enum PGLogState
> +{
>
> This is libpq-logging.c internal type. It is not needed to be exposed.

I fixed it.

> +extern void pqTraceForcelyBreakLine(int size, PGconn *conn);
> +extern void pqStoreFrontendMsg(PGconn *conn, PGLogMsgDataType type,
> int length)+extern void pqStoreFeMsgStart(PGconn *conn, char type);
> +extern void pqLogFrontendMsg(PGconn *conn, int msgLen);
> +extern void pqLogMessageByte1(PGconn *conn, char v);
> +extern void pqLogMessageInt(PGconn *conn, int v, int length);
> +extern void pqLogMessageString(PGconn *conn, const char *v, int length,
> +                               PGCommSource
> commsource);
> +extern void pqLogMessagenchar(PGconn *conn, const char *v, int length,
> +                              PGCommSource
> commsource);
>
> The API functions looks like randomly/inconsistently named and
> designed.  I think that API should be in more structurally designed.
>
> The comments about individual function names follow.

Thank you for your advice. I changed these functions name.
>
> +/*
> + * pqTraceForcelyBreakLine:
> + *         If message is not completed, print a line break and reset.
> + */
> +void
> +pqTraceForcelyBreakLine(int size, PGconn *conn)
> +{
> +    fprintf(conn->Pfdebug, "\n");
> +    pqTraceResetBeMsg(conn);
> +}
>
> Differently from the comment, this function doesn't work in a
> conditional way nor in a forceful way. It is just putting a new line
> and resetting the backend message variables.  I would name this as
> pqTrace(Finish|Close)BeMsgLog().

This function can be used when a connection is lost or when the copyData result is ignored according to the original
code.
It is called to reset halfway logging. So I want to know that it will be forced to quit.
Therefore, I changed the name as pqTraceForcelyFinishBeMsgLog().

>
> +/*
> + * pqStoreFrontendMsg
> + *        Keep track of a from-frontend message that was just written
> to the
> + *        output buffer.
> + *
> + * Frontend messages are constructed piece by piece, and the message
> length
> + * is determined at the end, but sent to the server first; so for tracing
> + * purposes we store everything in memory and print to the trace file when
> + * the message is complete.
> + */
> +void
> +pqStoreFrontendMsg(PGconn *conn, PGLogMsgDataType type, int length)
> +{
>
> I would name this as pqTrace(Store/Append)FeMsg().

I renamed it to pqTraceStoreFeMsg(). Because people who do not know this feature is confused due to the name.
It is difficult to understand why store message during the logging.
>
>
> +void
> +pqStoreFeMsgStart(PGconn *conn, char type)
> +{
> +    conn->fe_msg->msg_type = type;
> +}
>
> The name says that "stores the message "start"". But it actually
> stores the message type. I would name this as
> pqTraceSetFeMsgType(). Or in contrast to pqTraceFinishBeMsgLog, this
> can be named as pqTrace(Start|Begin|Init)BeMsgLog().

I think pqTraceSetFeMsgType() is better because this function's behavior is just set first byte1 message from Frontend.
>
>
> + * pqLogFrontendMsg
> + *        Print accumulated frontend message pieces to the trace file.
> + */
> +void
> +pqLogFrontendMsg(PGconn *conn, int msgLen)
>
> I would name this as pqTraceEmitFeMsgLog().

I would name this as pqTraceLogFeMsg().
It is shorter and we can easy to understand what this function do.

> + * pqLogMessageByte1: output 1 char from-backend message to the log
> + * pqLogMessageInt: output a 2- or 4-byte integer from-backend msg to the
> log
>
> I would name this as pqTraceEmitBeByteLog(), pqTraceEmitBeIntLog()
> respectively.

I think log and emit would mean the same thing in this case. And log is more easy to understand in this case.
So I changed name to pqTraceLogBeMsgByte1() and pqTraceLogBeMsgInt().

>
> + * pqLogMessageString: output a null-terminated string to the log
>
> This function is used for both directions. pqTraceEmitStringLog(). If it is split
> into fe and be parts, they would be pqTraceEmit(Be|Fe)StringLog().

I changed name to pqTraceLogMsgString().


> + * pqLogMessagenchar: output a string of exactly len bytes message to the
> log
>
> This logs a byte sequence in hexadecimals. I would name that as
> pqTraceEmitBytesLog(). Or pqTraceEmit(Be|Fe)BytesLog().

It is named to refer to pqGetnchar/pqPutnchar. So I changed this name to pqTraceLogMsgnchar().

> ...I finish once here.

Thank you for your review.

> From: Kyotaro Horiguchi <horikyota.ntt@gmail.com>
> Sent: Tuesday, February 9, 2021 5:30 PM

> > > PQtrace(conn, of);
> > > PQtraceSetFlags(conn, PQTRACE_SUPPRESS_TIMESTAMPS); <logging
> without
> > > timestamps> PQtraceSetFlags(conn, 0); <logging with timestamps>
> >
> > I find this better because the application does not have to call
> > PQuntrace() and PQtrace() again to enable/disable timestamp output,
> > which requires passing the FILE pointer again.  (I don't imagine
> > applications would repeatedly turn logging on and off in practice,
> > though.)
>
> Thanks and Yes, I also don't imagine that users change the timestmp state
> repeatedly:p It's just a example.

I implemented PQtraceSetFlags() function. And add documentation of PQtraceSetFlags().

> > > The name skipLogging is somewhat obscure. The flag doesn't inhibit
> > > all logs from being emitted.  It seems like it represents how far
> > > bytes the logging mechanism consumed for the limited cases. Thus, I
> > > think it can be a cursor variable like inCursor.
...
> > > I'm not sure this is easier to read than the skipLogging.
> >
> > I'd like Iwata-san to evaluate this and decide whether to take this approach
> or the current one.
>
> +1

I thought this idea was very good and tried it easily. But this didn't work...
So I didn't work on this implementation because the code can be more complex.

Regards
Aya Iwata
Fujits
Attachment
(48)
 <synopsis>
 void PQtrace(PGconn *conn, FILE *stream);
 </synopsis>
      </para>

+     <para>
+      Calls <function>PQtraceSetFlags</function> to output with or without a timestamp.
+     </para>
+
      <note>

Why is this necessary?  Even if you decide to remove this change, can you share your idea on why you added this just in
case?


(49)
+      Determine to output tracing with or without a timestamp to a debugging file stream.

The description should be the overall functionality of this function considering the future additions of flags.
Somethinglike:

Controls the tracing behavior of client/server communication.

+      then timestamp is not printed with each message. The default is output with timestamp.

The default value for flags argument (0) should be described here.

Also, it should be added that PQsetTraceFlags() can be called before or after the PQtrace() call.


(50)
I'd like you to consider skipLogging again, because it seems that such a variable is for the logging machinery to
controlstate transitions internally in fe-logging.c.
What I'm concerned is that those who modify libpq have to be aware of skipLogging and would fail to handle it.


(51)
>> +typedef enum PGLogState
>> +{
>>
>> This is libpq-logging.c internal type. It is not needed to be exposed.

> I fixed it.

How did you fix it?  The typedef is still in .h file.  It should be in .h, shouldn't it?  Houw about the other
typedefs?


I won't comment on the other stuff on function naming.


Regards
Takayuki Tsunakawa
Hi all,

I update patch to v18. It has been fixed in response to Tsunakawa san's review.

> From: Tsunakawa, Takayuki/綱川 貴之 <tsunakawa.takay@fujitsu.com>
> Sent: Friday, February 12, 2021 1:53 PM
>
> (48)
>  <synopsis>
>  void PQtrace(PGconn *conn, FILE *stream);
>  </synopsis>
>       </para>
>
> +     <para>
> +      Calls <function>PQtraceSetFlags</function> to output with or
> without a timestamp.
> +     </para>
> +
>       <note>
>
> Why is this necessary?  Even if you decide to remove this change, can you
> share your idea on why you added this just in case?

In the previous patch, we described the PQTRACE_SUPPRESS_TIMESTAMPS flag in the PQtrace () part.
And I think PQtrace () and PQtraceSetFlag () are closely related functions.
It would be nice for the user to know both features before using the logging feature.
So I added a description of PQtraceSetFlag () to the paragraph of PQtrace ().
However, the PQtraceSetFlag () documentation is in the next paragraph of PQtrace (),
so users can easily notice the PQtraceSetFlag () function. So I removed it.

> (49)
> +      Determine to output tracing with or without a timestamp to a
> debugging file stream.
>
> The description should be the overall functionality of this function considering
> the future additions of flags.  Something like:
>
> Controls the tracing behavior of client/server communication.
>
> +      then timestamp is not printed with each message. The default is
> output with timestamp.
>
> The default value for flags argument (0) should be described here.
>
> Also, it should be added that PQsetTraceFlags() can be called before or after
> the PQtrace() call.

I fixed documentation like this;
 If set to 0 (default),tracing will be output with timestamp.
 This function should be called after calling <function>PQtrace</function>.

> (50)
> I'd like you to consider skipLogging again, because it seems that such a
> variable is for the logging machinery to control state transitions internally in
> fe-logging.c.
> What I'm concerned is that those who modify libpq have to be aware of
> skipLogging and would fail to handle it.

To implement inLogging, logging skip method has been modified to be completed within the libpq-logging.c file.
The protocol message consists of First Byte, Length, and Contents.
When the first byte and length arrive, if contents is not yet in the buffer,
the process of reading the first byte and length is repeated.
Reloading is necessary to parse the protocol message and proceed,
but we want to skip logging because it is not necessary to output the message which already log to file.

To do this, remember the value of inCursor in the inLogging variable and record how far logging has progressed.
In the pqTraceLogBeMsgByte1() and pqTraceLogBeMsgInt(),
the value of inCursor at that time is stored in inLogging after outputting the log to a file.
If inCursor is smaller than inLogging, it exits the log output function without doing anything.
If all log messages are output, initialize the inLogging.

Changed the pqTraceMaybeBreakLine() function to return whether a line break has occurred
in order to consolidate the process of recording the cursor in one place. If it break line,
inLogging is initialized and inCursor is not remembered inLogging.

Also, as Horiguchi san mentioned, I changed to update the value of inLogging
even in the function where the value of inCursor is changed (Ex. pqCheckInBufferSpace () and pqReadData ()).


> (51)
> >> +typedef enum PGLogState
> >> +{
> >>
> >> This is libpq-logging.c internal type. It is not needed to be exposed.
>
> > I fixed it.
>
> How did you fix it?  The typedef is still in .h file.  It should be in .h, shouldn't
> it?  Houw about the other typedefs?

I didn’t move PGLogState to .c file because PGLogState is a member of be_msg which is referred from other files.


Regards,
Aya Iwata
Fujitsu
Attachment
Hello

In pqTraceOutputString(), you can use the return value from fprintf to
move the cursor -- no need to count chars.

I still think that the message-type specific functions should print the
message type, rather than having the string arrays.

--
Álvaro Herrera       Valdivia, Chile
"La gente vulgar sólo piensa en pasar el tiempo;
el que tiene talento, en aprovecharlo"
I'll look at the comments from Alvaro-san and Horiguchi-san.  Here are my review comments:


(23)
+    /* Trace message only when there is first 1 byte */
+    if (conn->Pfdebug && conn->outCount < conn->outMsgStart)
+    {
+        if (conn->outCount < conn->outMsgStart)
+            pqTraceOutputMessage(conn, conn->outBuffer + conn->outCount, true);
+        else
+            pqTraceOutputNoTypeByteMessage(conn,
+                                        conn->outBuffer + conn->outMsgStart);
+    }

The inner else path doesn't seem to be reached because both the outer and inner if contain the same condition.  I think
youwant to remove the second condition from the outer if.


(24) pqTraceOutputNoTypeByteMessage
+        case 16:    /* CancelRequest */
+            fprintf(conn->Pfdebug, "%s\t>\tCancelRequest\t%d", timestr, length);
+            pqTraceOutputInt32(message, &LogCursor, conn->Pfdebug);
+            pqTraceOutputInt32(message, &LogCursor, conn->Pfdebug);
+            break;

Another int32 data needs to be output as follows:

--------------------------------------------------
Int32(80877102)
The cancel request code. The value is chosen to contain 1234 in the most significant 16 bits, and 5678 in the least
significant16 bits. (To avoid confusion, this code must not be the same as any protocol version number.)

Int32
The process ID of the target backend.

Int32
The secret key for the target backend.
--------------------------------------------------


(25)
+        case 8 :    /* GSSENRequest or SSLRequest */

GSSENRequest -> GSSENCRequest


(26)
+static void
+pqTraceOutputByte1(const char *data, int *cursor, FILE *pfdebug)
+{
+    const char *v = data + *cursor;
+    /*

+static void
+pqTraceOutputf(const char *message, int end, FILE *f)
+{
+    int    cursor = 0;
+    pqTraceOutputString(message, &cursor, end, f);
+}

Put an empty line to separate the declaration part and execution part.


(27)
+    const char    *message_type = "UnkownMessage";
+
+    id = message[LogCursor++];
+
+    memcpy(&length, message + LogCursor , 4);
+    length = (int) pg_ntoh32(length);
+    LogCursor += 4;
+    LogEnd = length - 4;

+    /* Get a protocol type from first byte identifier */
+    if (toServer &&
+        id < lengthof(protocol_message_type_f) &&
+        protocol_message_type_f[(unsigned char)id] != NULL)
+        message_type = protocol_message_type_f[(unsigned char)id];
+    else if (!toServer &&
+        id < lengthof(protocol_message_type_b) &&
+        protocol_message_type_b[(unsigned char)id] != NULL)
+        message_type = protocol_message_type_b[(unsigned char)id];
+    else
+    {
+        fprintf(conn->Pfdebug, "Unknown message: %02x\n", id);
+        return;
+    }
+

The initial value "UnkownMessage" is not used.  So, you can initialize message_type with NULL and do like:

+     if (...)
+        ...
+    else if (...)
+        ...
+
+    if (message_type == NULL)
+    {
+        fprintf(conn->Pfdebug, "Unknown message: %02x\n", id);
+        return;
+

Plus, I think this should be done before looking at the message length.


(28)
pqTraceOutputBinary() is only used in pqTraceOutputNchar().  Do they have to be separated?


Regards
Takayuki Tsunakawa
From: Alvaro Herrera <alvherre@alvh.no-ip.org>
> In pqTraceOutputString(), you can use the return value from fprintf to
> move the cursor -- no need to count chars.

Yes, precisely, 2 bytes for the double quotes needs to be subtracted as follows:

    len = fprintf(...);
    *cursor += (len - 2);


> I still think that the message-type specific functions should print the
> message type, rather than having the string arrays.

I sort of think so to remove the big arrays.  But to minimize duplicate code, I think the code structure will look
like:

    fprintf(timestamp, length);
    switch (type)
    {
        case '?':
            pqTraceOutput?(...);
        break;
        case '?':
            /* No message content */
            fprintf("message_type_name");
        break;
    }

void
pqTraceOutput?(...)
{
    fprintf("message_type_name");
    print message content;
}

The order of length and message type is reversed.  The .sgml should also be changed accordingly.  What do you think?

Iwata-san,
Why don't you submit v27 patch with the current arrays kept, and then v28 with the arrays removed soon after?


From: Kyotaro Horiguchi <horikyota.ntt@gmail.com>
> It would help when the value is "255", which is confusing between -1
> (or 255) in byte or 255 in 2-byte word. Or when the value looks like
> broken. I'd suggest "b"yte for 1 byte, "s"hort for 2 bytes, "l"ong for
> 4 bytes ('l' is confusing with '1', but anyway it is not needed)..

I don't have a strong opinion on this.  (I kind of think I want to see unprefixed numbers; readers will look at the
protocolreference anyway.)  I'd like to leave this up to Iwata-san and Alvaro-san.


    Regards
Takayuki Tsunakawa}
Hi Alvaro san and Tsunakawa san,

Thank you for your review. I updated patch to v27.

`make check` output is following. I think it is OK.
```
2021-03-18 07:02:55.090598  <   ReadyForQuery   5 I
2021-03-18 07:02:55.090672  >   Terminate   4
2021-03-18 07:02:55.120492  >   Query   155 "CREATE TABLESPACE regress_tblspacewith LOCATION
'/home/iwata/pgsql/postgres/src/test/regress/testtablespace'WITH (some_nonexistent_parameter = true);"
2021-03-18 07:02:55.121624  <   ErrorResponse   124 S "ERROR" V "ERROR" C "22023" M "unrecognized parameter
"some_nonexistent_parameter""F "reloptions.c" L "1447" R "parseRelOptionsInternal" \x00 "Z"
2021-03-18 07:02:55.121664  <   ReadyForQuery   5 I
2021-03-18 07:02:55.121728  >   Query   144 "CREATE TABLESPACE regress_tblspacewith LOCATION
'/home/iwata/pgsql/postgres/src/test/regress/testtablespace'WITH (random_page_cost = 3.0);"
2021-03-18 07:02:55.123335  <   CommandComplete 22 "CREATE TABLESPACE"
2021-03-18 07:02:55.123400  <   ReadyForQuery   5 I
2021-03-18 07:02:55.123460  >   Query   81 "SELECT spcoptions FROM pg_tablespace WHERE spcname =
'regress_tblspacewith';"
2021-03-18 07:02:55.126556  <   RowDescription  35 1 "spcoptions" 1213 5 1009 65535 -1 0
2021-03-18 07:02:55.126594  <   DataRow 32 1 22 '{random_page_cost=3.0}'
2021-03-18 07:02:55.126607  <   CommandComplete 13 "SELECT 1"
2021-03-18 07:02:55.126617  <   ReadyForQuery   5 I
```

> Iwata-san,
> Why don't you submit v27 patch with the current arrays kept, and then v28
> with the arrays removed soon after?

And I will try to remove byte1 type table for v28 patch.

> From: Tsunakawa, Takayuki/綱川 貴之 <tsunakawa.takay@fujitsu.com>
> Sent: Thursday, March 18, 2021 12:38 PM
> From: Alvaro Herrera <alvherre@alvh.no-ip.org>
> > In pqTraceOutputString(), you can use the return value from fprintf to
> > move the cursor -- no need to count chars.
>
> Yes, precisely, 2 bytes for the double quotes needs to be subtracted as
> follows:
>
>     len = fprintf(...);
>     *cursor += (len - 2);

Thank you for your advice. I changed pqTraceOutputString set cursor to fprintf  return -2.
And I removed cursor movement from that function.

> From: Tsunakawa, Takayuki/綱川 貴之 <tsunakawa.takay@fujitsu.com>
> Sent: Thursday, March 18, 2021 11:52 AM
...
> I'll look at the comments from Alvaro-san and Horiguchi-san.  Here are my
> review comments:

Thank you for your review. I am sorry previous patch contain some mistake.

> (23)
> +    /* Trace message only when there is first 1 byte */
> +    if (conn->Pfdebug && conn->outCount < conn->outMsgStart)
> +    {
> +        if (conn->outCount < conn->outMsgStart)
> +            pqTraceOutputMessage(conn, conn->outBuffer +
> conn->outCount, true);
> +        else
> +            pqTraceOutputNoTypeByteMessage(conn,
> +
>     conn->outBuffer + conn->outMsgStart);
> +    }
>
> The inner else path doesn't seem to be reached because both the outer and
> inner if contain the same condition.  I think you want to remove the second
> condition from the outer if.

Yes, I remove second condition.

> (24) pqTraceOutputNoTypeByteMessage
> +        case 16:    /* CancelRequest */
> +            fprintf(conn->Pfdebug,
> "%s\t>\tCancelRequest\t%d", timestr, length);
> +            pqTraceOutputInt32(message, &LogCursor,
> conn->Pfdebug);
> +            pqTraceOutputInt32(message, &LogCursor,
> conn->Pfdebug);
> +            break;
>
> Another int32 data needs to be output as follows:
>
> --------------------------------------------------
> Int32(80877102)
> The cancel request code. The value is chosen to contain 1234 in the most
> significant 16 bits, and 5678 in the least significant 16 bits. (To avoid
> confusion, this code must not be the same as any protocol version number.)
>
> Int32
> The process ID of the target backend.
>
> Int32
> The secret key for the target backend.
> --------------------------------------------------

Thank you. I read document again and I add one pqTraceOutputInt32().

> (25)
> +        case 8 :    /* GSSENRequest or SSLRequest */
>
> GSSENRequest -> GSSENCRequest

Thank you. I fixed.


> (26)
> +static void
> +pqTraceOutputByte1(const char *data, int *cursor, FILE *pfdebug) {
> +    const char *v = data + *cursor;
> +    /*
>
> +static void
> +pqTraceOutputf(const char *message, int end, FILE *f) {
> +    int    cursor = 0;
> +    pqTraceOutputString(message, &cursor, end, f); }
>
> Put an empty line to separate the declaration part and execution part.

Thank you. I fixed this. I add space anywhere in pqTraceOutput? function.

> (27)
> +    const char    *message_type = "UnkownMessage";
> +
> +    id = message[LogCursor++];
> +
> +    memcpy(&length, message + LogCursor , 4);
> +    length = (int) pg_ntoh32(length);
> +    LogCursor += 4;
> +    LogEnd = length - 4;
>
> +    /* Get a protocol type from first byte identifier */
> +    if (toServer &&
> +        id < lengthof(protocol_message_type_f) &&
> +        protocol_message_type_f[(unsigned char)id] != NULL)
> +        message_type = protocol_message_type_f[(unsigned
> char)id];
> +    else if (!toServer &&
> +        id < lengthof(protocol_message_type_b) &&
> +        protocol_message_type_b[(unsigned char)id] != NULL)
> +        message_type = protocol_message_type_b[(unsigned
> char)id];
> +    else
> +    {
> +        fprintf(conn->Pfdebug, "Unknown message: %02x\n", id);
> +        return;
> +    }
> +
>
> The initial value "UnkownMessage" is not used.  So, you can initialize
> message_type with NULL and do like:
>
> +     if (...)
> +        ...
> +    else if (...)
> +        ...
> +
> +    if (message_type == NULL)
> +    {
> +        fprintf(conn->Pfdebug, "Unknown message: %02x\n", id);
> +        return;
> +
>
> Plus, I think this should be done before looking at the message length.

I initialized message_type as NULL,  changed `else` to `if (message_type == NULL)`
and move message type setup code to after setting id.

> (28)
> pqTraceOutputBinary() is only used in pqTraceOutputNchar().  Do they have
> to be separated?

I see. I merged this code to pqTraceOutputBinary().

Regards,
Aya Iwata
Attachment
From: Iwata, Aya/岩田 彩 <iwata.aya@fujitsu.com>
> > Yes, precisely, 2 bytes for the double quotes needs to be subtracted
> > as
> > follows:
> >
> >     len = fprintf(...);
> >     *cursor += (len - 2);
>
> Thank you for your advice. I changed pqTraceOutputString set cursor to fprintf
> return -2.
> And I removed cursor movement from that function.

Ouch, not 2 but 3, to include a single whitespace at the beginning.

The rest looks good.  I hope we're almost at the finish line.


    Regards
Takayuki Tsunakawa}
At Thu, 18 Mar 2021 07:34:36 +0000, "tsunakawa.takay@fujitsu.com" <tsunakawa.takay@fujitsu.com> wrote in
> From: Iwata, Aya/岩田 彩 <iwata.aya@fujitsu.com>
> > > Yes, precisely, 2 bytes for the double quotes needs to be subtracted
> > > as
> > > follows:
> > >
> > >     len = fprintf(...);
> > >     *cursor += (len - 2);
> >
> > Thank you for your advice. I changed pqTraceOutputString set cursor to fprintf
> > return -2.
> > And I removed cursor movement from that function.
>
> Ouch, not 2 but 3, to include a single whitespace at the beginning.
>
> The rest looks good.  I hope we're almost at the finish line.

Maybe.

At Wed, 17 Mar 2021 13:36:32 -0300, Alvaro Herrera <alvherre@alvh.no-ip.org> wrote in
> In pqTraceOutputString(), you can use the return value from fprintf to
> move the cursor -- no need to count chars.
>
> I still think that the message-type specific functions should print the
> message type, rather than having the string arrays.

In other words, pqTraceOutputMessage recognizes message id and calls
the function corresponding one-on-one to the id. So the functions
knows what is the message type of myself and there's no reason for
pqTraceOutputMessage to print the message type on its behalf.


+ pqTraceOutputR(const char *message, FILE *f)
+ {
+     int    cursor = 0;
+
+     pqTraceOutputInt32(message, &cursor, f);

I don't understand the reason for spliting message and &cursor here.

+ pqTraceOutputR(const char *message, FILE *f)
+ {
+     char *p = message;
+
+     pqTraceOutputInt32(&p, f);

works well.


+/* RowDescription */
+static void
+pqTraceOutputT(const char *message, int end, FILE *f)
+{
+    int    cursor = 0;
+    int nfields;
+    int    i;
+
+    nfields = pqTraceOutputInt16(message, &cursor, f);
+
+    for (i = 0; i < nfields; i++)
+    {
+        pqTraceOutputString(message, &cursor, end, f);
+        pqTraceOutputInt32(message, &cursor, f);
+        pqTraceOutputInt16(message, &cursor, f);
+        pqTraceOutputInt32(message, &cursor, f);
+        pqTraceOutputInt16(message, &cursor, f);
+        pqTraceOutputInt32(message, &cursor, f);
+        pqTraceOutputInt16(message, &cursor, f);
+    }
+}

I didn't looked closer, but lookong the usage of the variable "end",
something's wrong in the function.

regards.

--
Kyotaro Horiguchi
NTT Open Source Software Center
From: Kyotaro Horiguchi <horikyota.ntt@gmail.com>
> + pqTraceOutputR(const char *message, FILE *f)
> + {
> +     int    cursor = 0;
> +
> +     pqTraceOutputInt32(message, &cursor, f);
>
> I don't understand the reason for spliting message and &cursor here.
>
> + pqTraceOutputR(const char *message, FILE *f)
> + {
> +     char *p = message;
> +
> +     pqTraceOutputInt32(&p, f);
>
> works well.

Yes, that would also work.  But I like the separate cursor + fixed starting point here, probably because it's sometimes
confusingto see the pointer value changed inside functions.  (And a pointer itself is an allergy for some people, not
tomention a pointer to ointer...)  Also, libpq uses cursors for network I/O buffers.  So, I think the patch can be as
itis now.


> +static void
> +pqTraceOutputT(const char *message, int end, FILE *f)
> +{
> +    int    cursor = 0;
> +    int nfields;
> +    int    i;
> +
> +    nfields = pqTraceOutputInt16(message, &cursor, f);
> +
> +    for (i = 0; i < nfields; i++)
> +    {
> +        pqTraceOutputString(message, &cursor, end, f);
> +        pqTraceOutputInt32(message, &cursor, f);
> +        pqTraceOutputInt16(message, &cursor, f);
> +        pqTraceOutputInt32(message, &cursor, f);
> +        pqTraceOutputInt16(message, &cursor, f);
> +        pqTraceOutputInt32(message, &cursor, f);
> +        pqTraceOutputInt16(message, &cursor, f);
> +    }
> +}
>
> I didn't looked closer, but lookong the usage of the variable "end",
> something's wrong in the function.

Ah, end doesn't serve any purpose.  I guess the compiler emitted a warning "end is not used".  I think end can be
removed.


    Regards
Takayuki Tsunakawa}
Hi Horiguchi san and Tsunakawa san,

Thank you for you review.

I update patch to v28.  In this patch, I removed array.
And I fixed some code according to Horiguchi san and Tsunakawa san review comment.

> From: Tsunakawa, Takayuki/綱川 貴之 <tsunakawa.takay@fujitsu.com>
> Sent: Thursday, March 18, 2021 12:38 PM
> I sort of think so to remove the big arrays.  But to minimize duplicate code, I
> think the code structure will look like:
>
>     fprintf(timestamp, length);
>     switch (type)
>     {
>         case '?':
>             pqTraceOutput?(...);
>         break;
>         case '?':
>             /* No message content */
>             fprintf("message_type_name");
>         break;
>     }
>
> void
> pqTraceOutput?(...)
> {
>     fprintf("message_type_name");
>     print message content;
> }

The code follows above format.
And I changed .sgml documentation;
- Changed order of message length and type
- Removed byte-16 and byte-32 explanation because I removed # output in previous patch.

Output style is following;

```
2021-03-18 08:59:36.141660  <   5   ReadyForQuery I
2021-03-18 08:59:36.141723  >   4   Terminate
2021-03-18 08:59:36.173263  >   155 Query "CREATE TABLESPACE regress_tblspacewith LOCATION
'/home/iwata/pgsql/postgres/src/test/regress/testtablespace'WITH (some_nonexistent_parameter = true);"
2021-03-18 08:59:36.174439  <   124 ErrorResponse S "ERROR" V "ERROR" C "22023" M "unrecognized parameter
"some_nonexistent_parameter""F "reloptions.c" L "1456" R "parseRelOptionsInternal" \x00 "Z"
2021-03-18 08:59:36.174483  <   5   ReadyForQuery I
2021-03-18 08:59:36.174545  >   144 Query "CREATE TABLESPACE regress_tblspacewith LOCATION
'/home/iwata/pgsql/postgres/src/test/regress/testtablespace'WITH (random_page_cost = 3.0);"
2021-03-18 08:59:36.176155  <   22  CommandComplete "CREATE TABLESPACE"
2021-03-18 08:59:36.176190  <   5   ReadyForQuery I
2021-03-18 08:59:36.176243  >   81  Query "SELECT spcoptions FROM pg_tablespace WHERE spcname =
'regress_tblspacewith';"
2021-03-18 08:59:36.179286  <   35  RowDescription 1 "spcoptions" 1213 5 1009 65535 -1 0
2021-03-18 08:59:36.179326  <   32  DataRow 1 22 '{random_page_cost=3.0}'
2021-03-18 08:59:36.179339  <   13  CommandComplete "SELECT 1"
2021-03-18 08:59:36.179349  <   5   ReadyForQuery I
2021-03-18 08:59:36.179504  >   42  Query "DROP TABLESPACE regress_tblspacewith;"
2021-03-18 08:59:36.180400  <   20  CommandComplete "DROP TABLESPACE"
2021-03-18 08:59:36.180432  <   5   ReadyForQuery I
```


> -----Original Message-----
> From: Kyotaro Horiguchi <horikyota.ntt@gmail.com>
> Sent: Thursday, March 18, 2021 5:30 PM
>
> At Thu, 18 Mar 2021 07:34:36 +0000, "tsunakawa.takay@fujitsu.com"
> <tsunakawa.takay@fujitsu.com> wrote in
> > From: Iwata, Aya/岩田 彩 <iwata.aya@fujitsu.com>
> > > > Yes, precisely, 2 bytes for the double quotes needs to be
> > > > subtracted as
> > > > follows:
> > > >
> > > >     len = fprintf(...);
> > > >     *cursor += (len - 2);
> > >
> > > Thank you for your advice. I changed pqTraceOutputString set cursor
> > > to fprintf return -2.
> > > And I removed cursor movement from that function.
> >
> > Ouch, not 2 but 3, to include a single whitespace at the beginning.
> >
> > The rest looks good.  I hope we're almost at the finish line.
>
> Maybe.

String is end by '\0'. So (len -2) is OK.
However it seems like mistake because fprintf output string and 3 characters.
So I added explanation here and changed (len -2) to (len -3 +1).
I think it is OK because I found similar style in ecpg code.

> > + pqTraceOutputR(const char *message, FILE *f) {
> > +     int    cursor = 0;
> > +
> > +     pqTraceOutputInt32(message, &cursor, f);
> >
> > I don't understand the reason for spliting message and &cursor here.
> >
> > + pqTraceOutputR(const char *message, FILE *f) {
> > +     char *p = message;
> > +
> > +     pqTraceOutputInt32(&p, f);
> >
> > works well.
>
> Yes, that would also work.  But I like the separate cursor + fixed starting
> point here, probably because it's sometimes confusing to see the pointer
> value changed inside functions.  (And a pointer itself is an allergy for some
> people, not to mention a pointer to ointer...)  Also, libpq uses cursors for
> network I/O buffers.  So, I think the patch can be as it is now.

I think pass message and cursor is better. Because it is easy to understand and
The moving cursor style is used when libpq execute protocol message.
So I didn't make this change.

> +/* RowDescription */
> +static void
> +pqTraceOutputT(const char *message, int end, FILE *f) {
> +    int    cursor = 0;
> +    int nfields;
> +    int    i;
> +
> +    nfields = pqTraceOutputInt16(message, &cursor, f);
> +
> +    for (i = 0; i < nfields; i++)
> +    {
> +        pqTraceOutputString(message, &cursor, end, f);
> +        pqTraceOutputInt32(message, &cursor, f);
> +        pqTraceOutputInt16(message, &cursor, f);
> +        pqTraceOutputInt32(message, &cursor, f);
> +        pqTraceOutputInt16(message, &cursor, f);
> +        pqTraceOutputInt32(message, &cursor, f);
> +        pqTraceOutputInt16(message, &cursor, f);
> +    }
> +}
>
> I didn't looked closer, but lookong the usage of the variable "end", something's
> wrong in the function.

I removed end from the function.
pqTraceOutputString no longer use message end cursor.


Regards,
Aya Iwata
Attachment
Hello Iwata-san,


Thanks to removing the static arrays, the code got much smaller.  I'm happy with this result.


(1)
+      (<literal>></literal> for messages from client to server,
+      and <literal><</literal> for messages from server to client),

I think this was meant to say "> or <".  So, maybe you should remove "," at the end of the first line, and replace
"and"with "or".


(2)
+        case 8 :    /* GSSENCRequest or SSLRequest */
+            /* These messsage does not reach here. */

messsage does -> messages do


(3)
+    fprintf(f, "\tAuthentication");

Why don't you move this \t in each message type to the end of:

+    fprintf(conn->Pfdebug, "%s\t%s\t%d", timestr, prefix, length);

Plus, don't we say in the manual that fields (timestamp, direction, length, message type, and message content) are
separatedby a tab?
Also, the code doesn't seem to separate the message type and content with a tab.


(4)
Where did the processing for unknown message go in pqTraceOutputMessage()?  Add default label?


(5)
+        case 16:    /* CancelRequest */
+            fprintf(conn->Pfdebug, "%s\t>\t%d\tCancelRequest", timestr, length);

I think this should follow pqTraceOutputMessage().  That is, each case label only print the message type name in case
othermessage types are added in the future.


Regards
Takayuki Tsunakawa
Hi Tsunakawa san,

Thank you for your review. I update patch to v29.

Output is following. It is fine.
```
2021-03-19 07:21:09.917302  >   4   Terminate
2021-03-19 07:21:09.961494  >   155 Query    "CREATE TABLESPACE regress_tblspacewith LOCATION
'/home/iwata/pgsql/postgres/src/test/regress/testtablespace'WITH (some_nonexistent_parameter = true);"
2021-03-19 07:21:09.962657  <   124 ErrorResponse    S "ERROR" V "ERROR" C "22023" M "unrecognized parameter
"some_nonexistent_parameter""F "reloptions.c" L "1456" R "parseRelOptionsInternal" \x00 "Z"
2021-03-19 07:21:09.962702  <   5   ReadyForQuery    I
2021-03-19 07:21:09.962767  >   144 Query    "CREATE TABLESPACE regress_tblspacewith LOCATION
'/home/iwata/pgsql/postgres/src/test/regress/testtablespace'WITH (random_page_cost = 3.0);"
2021-03-19 07:21:09.967056  <   22  CommandComplete  "CREATE TABLESPACE"
2021-03-19 07:21:09.967092  <   5   ReadyForQuery    I
2021-03-19 07:21:09.967148  >   81  Query    "SELECT spcoptions FROM pg_tablespace WHERE spcname =
'regress_tblspacewith';"
2021-03-19 07:21:09.970338  <   35  RowDescription   1 "spcoptions" 1213 5 1009 65535 -1 0
2021-03-19 07:21:09.970402  <   32  DataRow  1 22 '{random_page_cost=3.0}'
2021-03-19 07:21:09.970420  <   13  CommandComplete  "SELECT 1"
2021-03-19 07:21:09.970431  <   5   ReadyForQuery    I
2021-03-19 07:21:09.970558  >   42  Query    "DROP TABLESPACE regress_tblspacewith;"
2021-03-19 07:21:09.971500  <   20  CommandComplete  "DROP TABLESPACE"
2021-03-19 07:21:09.971561  <   5   ReadyForQuery    I
```

> -----Original Message-----
> From: Tsunakawa, Takayuki/綱川 貴之 <tsunakawa.takay@fujitsu.com>
> Sent: Friday, March 19, 2021 11:37 AM


> Thanks to removing the static arrays, the code got much smaller.  I'm happy
> with this result.

Thank you so much. Your advice was very helpful in refactoring the patch.

> (1)
> +      (<literal>></literal> for messages from client to server,
> +      and <literal><</literal> for messages from server to client),
>
> I think this was meant to say "> or <".  So, maybe you should remove "," at
> the end of the first line, and replace "and" with "or".

I fixed.

>
>
> (2)
> +        case 8 :    /* GSSENCRequest or SSLRequest */
> +            /* These messsage does not reach here. */
>
> messsage does -> messages do

I fixed.

> (3)
> +    fprintf(f, "\tAuthentication");
>
> Why don't you move this \t in each message type to the end of:
>
> +    fprintf(conn->Pfdebug, "%s\t%s\t%d", timestr, prefix, length);

I fixed.

>
> Plus, don't we say in the manual that fields (timestamp, direction, length,
> message type, and message content) are separated by a tab?

Sure. I added following documentation;
+ Non-message contents fields (timestamp, direction, length and message type)
+ are separated by a tab. Message contents are separated by a space.

> Also, the code doesn't seem to separate the message type and content with a
> tab.

I fixed to output a tab at the end of message types.

> (4)
> Where did the processing for unknown message go in
> pqTraceOutputMessage()?  Add default label?


> (5)
> +        case 16:    /* CancelRequest */
> +            fprintf(conn->Pfdebug,
> "%s\t>\t%d\tCancelRequest", timestr, length);
>
> I think this should follow pqTraceOutputMessage().  That is, each case label
> only print the message type name in case other message types are added in
> the future.

Sure. I fixed pqTraceOutputNoTypeByteMessage() following to pqTraceOutputMessage() style.


Regards,
Aya Iwata
Attachment
Alvaro-san, Iwata-san,
cc: Tom-san, Horiguchi-san,


Thank you, it finally looks complete to me!

Alvaro-san,
We appreciate your help and patience, sometimes rewriting large part of the patch.  Could you do the final check (and
possiblytweak) for commit?


    Regards
Takayuki Tsunakawa
Hello

I added an option to the new libpq_pipeline program that it activates
libpq trace.  It works nicely and I think we can add that to the
regression tests.  However I have two observations.

1. The trace output for the error message won't be very nice, because it
prints line numbers.  So if I want to match the output to an "expected"
file, it would break every time somebody edits the source file where the
error originates and the ereport() line is moved.  For example:

    <    70    ErrorResponse     S "ERROR" V "ERROR" C "22012" M "division by zero" F "numeric.c" L "8366" R "div_var"
\x00"Z"


The line number 8366 in this line would be problematic.  I think if we
want regression testing for this, we should have another trace flag to
suppress output of a few of these fields.  I would have it print only S,
C and M.

(Hey, what the heck is that "Z" at the end of the message?  I thought
the error ended right at the \x00 ...)


2. The < and > characters are not good for visual inspection.  I
replaced them with F and B and I think it's much clearer.  Compare:

    >    27    Query     "SET lc_messages TO "C""
    <    8    CommandComplete     "SET"
    <    5    ReadyForQuery     I
    >    21    Parse     "" "SELECT $1" 1 23
    >    19    Bind     "" "" 0 1 1 '1' 1 0
    >    6    Describe     P ""
    >    9    Execute     "" 0
    >    4    Sync
    <    4    ParseComplete
    <    4    BindComplete
    <    33    RowDescription     1 "?column?" 0 0 23 4 -1 0
    <    11    DataRow     1 1 '1'
    <    13    CommandComplete     "SELECT 1"
    <    5    ReadyForQuery     I
    >    4    Terminate

with

    F    27    Query     "SET lc_messages TO "C""
    B    8    CommandComplete     "SET"
    B    5    ReadyForQuery     I
    F    21    Parse     "" "SELECT $1" 1 23
    F    19    Bind     "" "" 0 1 1 '1' 1 0
    F    6    Describe     P ""
    F    9    Execute     "" 0
    F    4    Sync
    B    4    ParseComplete
    B    4    BindComplete
    B    33    RowDescription     1 "?column?" 0 0 23 4 -1 0
    B    11    DataRow     1 1 '1'
    B    13    CommandComplete     "SELECT 1"
    B    5    ReadyForQuery     I
    F    4    Terminate

I think the second one is much easier on the eye.

(This one is the output from "libpq_pipeline simple_pipeline").

--
Álvaro Herrera       Valdivia, Chile
"Saca el libro que tu religión considere como el indicado para encontrar la
oración que traiga paz a tu alma. Luego rebootea el computador
y ve si funciona" (Carlos Duclós)
Proposed changes on top of v29.

--
Álvaro Herrera       Valdivia, Chile
Attachment
On 2021-Mar-26, alvherre@alvh.no-ip.org wrote:

> Proposed changes on top of v29.

This last one uses libpq_pipeline -t and verifies the output against an
expected trace file.  Applies on top of all the previous patches.  I
attach the whole lot, so that the CF bot has a chance to run it.

I did notice another problem for comparison of expected trace files,
which is that RowDescription includes table OIDs for some columns.  I
think we would need to have a flag to suppress that too, somehow,
although the answer to what should we do is not as clear as for the
other two cases.

I dodged the issue by just using -t for the pipeline cases that don't
have OIDs in their output.  This leaves us with no coverage for the
ErrorResponse message, which I think is a shortcoming.  If we fixed the
OID problem and the ErrorResponse problem, we could add an expected
trace for pipeline_abort.  I think we should do that.

Maybe the easiest way is to have a new flag PQTRACE_REGRESS_MODE.

--
Álvaro Herrera                            39°49'30"S 73°17'W
Essentially, you're proposing Kevlar shoes as a solution for the problem
that you want to walk around carrying a loaded gun aimed at your foot.
(Tom Lane)
Attachment
On 2021-Mar-27, alvherre@alvh.no-ip.org wrote:

> This last one uses libpq_pipeline -t and verifies the output against an
> expected trace file.  Applies on top of all the previous patches.  I
> attach the whole lot, so that the CF bot has a chance to run it.

All tests pass, but CFbot does not run src/test/modules, so it's not
saying much.

--
Álvaro Herrera                            39°49'30"S 73°17'W
From: alvherre@alvh.no-ip.org <alvherre@alvh.no-ip.org>
> I added an option to the new libpq_pipeline program that it activates
> libpq trace.  It works nicely and I think we can add that to the
> regression tests.

That's good news.  Thank you.


> 1. The trace output for the error message won't be very nice, because it
> prints line numbers.  So if I want to match the output to an "expected"
> file, it would break every time somebody edits the source file where the
> error originates and the ereport() line is moved.  For example:

> (Hey, what the heck is that "Z" at the end of the message?  I thought
> the error ended right at the \x00 ...)

We'll investigate these issues.


> 2. The < and > characters are not good for visual inspection.  I
> replaced them with F and B and I think it's much clearer.  Compare:
> I think the second one is much easier on the eye.

Yes, agreed.  I too thought of something like "C->S" and "S->C" because client and server should be more familiar for
usersthan frontend and backend.


Regards
Takayuki Tsunakawa
From: alvherre@alvh.no-ip.org <alvherre@alvh.no-ip.org>
> > Proposed changes on top of v29.
>
> This last one uses libpq_pipeline -t and verifies the output against an expected
> trace file.  Applies on top of all the previous patches.  I attach the whole lot,
> so that the CF bot has a chance to run it.

Thank you for polishing the patch.

Iwata-san,
Please review Alvaro-san's code, and I think you can integrate all patches into one except for 0002 and 0007.  Those
twopatches may be separate or merged into one as a test patch.


> I did notice another problem for comparison of expected trace files, which is
> that RowDescription includes table OIDs for some columns.  I think we would
> need to have a flag to suppress that too, somehow, although the answer to what
> should we do is not as clear as for the other two cases.

I'm afraid this may render the test comparison almost impossible.  Tests that access system catalogs and large objects
probablyoutput OIDs.


Regards
Takayuki Tsunakawa
On 2021-Mar-29, tsunakawa.takay@fujitsu.com wrote:

> > (Hey, what the heck is that "Z" at the end of the message?  I thought
> > the error ended right at the \x00 ...)
>
> We'll investigate these issues.

For what it's worth, I did fix this problem in patch 0005 that I
attached.  The problem was that one "continue" should have been "break",
and also a "while ( .. )" needed to be made an infinite loop.  It was
easy to catch these problems once I added (in 0006) the check that the
bytes consumed equal message length, as I had suggested a couple of
weeks ago :-)  I also changed the code for Notice, but I didn't actually
verify that one.

> > 2. The < and > characters are not good for visual inspection.  I
> > replaced them with F and B and I think it's much clearer.  Compare:
> > I think the second one is much easier on the eye.
>
> Yes, agreed.  I too thought of something like "C->S" and "S->C"
> because client and server should be more familiar for users than
> frontend and backend.

Hmm, yeah, that's a reasonable option too.  What do others think?

--
Álvaro Herrera       Valdivia, Chile
At Mon, 29 Mar 2021 00:02:58 -0300, "'alvherre@alvh.no-ip.org'" <alvherre@alvh.no-ip.org> wrote in
> On 2021-Mar-29, tsunakawa.takay@fujitsu.com wrote:
>
> > > (Hey, what the heck is that "Z" at the end of the message?  I thought
> > > the error ended right at the \x00 ...)
> >
> > We'll investigate these issues.
>
> For what it's worth, I did fix this problem in patch 0005 that I
> attached.  The problem was that one "continue" should have been "break",
> and also a "while ( .. )" needed to be made an infinite loop.  It was
> easy to catch these problems once I added (in 0006) the check that the
> bytes consumed equal message length, as I had suggested a couple of
> weeks ago :-)  I also changed the code for Notice, but I didn't actually
> verify that one.
>
> > > 2. The < and > characters are not good for visual inspection.  I
> > > replaced them with F and B and I think it's much clearer.  Compare:
> > > I think the second one is much easier on the eye.
> >
> > Yes, agreed.  I too thought of something like "C->S" and "S->C"
> > because client and server should be more familiar for users than
> > frontend and backend.
>
> Hmm, yeah, that's a reasonable option too.  What do others think?

It's better to be short as far as it is clear enough. Actually '<' to
'F' and '>' to 'B' is clear enough to me. So I don't need a longer
notation.  O(ut) and (I)n also makes sense to me.  Rather, "C->S", and
"S->C" are a little difficult to understand at a glance

regards.

--
Kyotaro Horiguchi
NTT Open Source Software Center
From: Kyotaro Horiguchi <horikyota.ntt@gmail.com>
> It's better to be short as far as it is clear enough. Actually '<' to
> 'F' and '>' to 'B' is clear enough to me. So I don't need a longer
> notation.

Agreed, because the message format description in the PG manual uses F and B.


Regards
Takayuki Tsunakawa
From: 'alvherre@alvh.no-ip.org' <alvherre@alvh.no-ip.org>
> > > (Hey, what the heck is that "Z" at the end of the message?  I thought
> > > the error ended right at the \x00 ...)
> >
> > We'll investigate these issues.
>
> For what it's worth, I did fix this problem in patch 0005 that I
> attached.  The problem was that one "continue" should have been "break",
> and also a "while ( .. )" needed to be made an infinite loop.  It was
> easy to catch these problems once I added (in 0006) the check that the
> bytes consumed equal message length, as I had suggested a couple of
> weeks ago :-)  I also changed the code for Notice, but I didn't actually
> verify that one.

You already fix the issue, didn't you?  Thank you.  Your suggestion of checking the length has surely proved to be
correct.


Regards
Takayuki Tsunakawa
Hi Alvaro san, Tsunakawa san

Thank you for creating the v30 patch.

> From: Tsunakawa, Takayuki/綱川 貴之 <tsunakawa.takay@fujitsu.com>
> Sent: Monday, March 29, 2021 9:45 AM
...
> Iwata-san,
> Please review Alvaro-san's code, and I think you can integrate all patches into
> one except for 0002 and 0007.  Those two patches may be separate or
> merged into one as a test patch.

I reviewed v30 patches. I think it was good except that the documentation about the direction of the message was not
changing.
I also tried the v30 patch using regression test and it worked fine.
I merged v30 patches and update the patch to v31.

This new version patch includes the fix of libpq.smgl fix and the addition of regression test mode.
In libpq.smgl, the symbol indicating the message direction has been corrected from "<" ">" to "B" "F" in the
documentation.

> From: alvherre@alvh.no-ip.org <alvherre@alvh.no-ip.org>
> Sent: Sunday, March 28, 2021 4:28 AM
...
> Maybe the easiest way is to have a new flag PQTRACE_REGRESS_MODE.

To prepare for regression test, I read Message Formats documentation.
https://www.postgresql.org/docs/current/protocol-message-formats.html

Following protocol messages have values that depend on the code of master at that time;
- BackendKeyData(B) ... includes backend PID and backend private key
- ErrorResponse(B) ... includes error message line number
- FunctionCall(F) ... includes function OID
- NoticeResponse(B) ... includes notice message line number
- NotificationResponse (B) ... includes backend PID
- ParameterDescription  ... includes parameter OID
- Parse(F) ... includes parameter data type OID
- RowDescription(B) ... includes OIDs

I checked status of conn->pqTraceFlags to decide whether output version-dependent messages or not in above protocol
messageoutput functions.

In ErrorResponse and NoticeResponse, I skip string type message logging only when field type code is "L".
In my understanding, other field code message type does not depend on version.
So I didn't skip other code type's string messages.
And I also changed description of pqTraceSetFlags()
by changing PQTRACE_SUPPRESS_TIMESTAMPS flag to the PQTRACE_REGRESS_MODE flag.

Output of regress mode is following;

B   124 ErrorResponse    S "ERROR" V "ERROR" C "22023" M "unrecognized parameter "some_nonexistent_parameter"" F
"reloptions.c"L R "parseRelOptionsInternal" \x00

B   14  ParameterDescription     2

Output of non-regress mode is following;

2021-03-30 12:55:31.327913  B   124 ErrorResponse    S "ERROR" V "ERROR" C "22023" M "unrecognized parameter
"some_nonexistent_parameter""F "reloptions.c" L "1447" R "parseRelOptionsInternal" \x00

2021-03-30 12:56:12.691617  B   14  ParameterDescription     2 25 701

Regards,
Aya Iwata
Attachment
Okay, pushed this patch and the new testing for it based on
libpq_pipeline.  We'll see how the buildfarm likes it.

I made some further changes to the last version; user-visibly, I split
the trace flags in two, keeping the timestamp suppression separate from
the redacting feature for regression testing.

I didn't like the idea of silently skipping the redacted fields, so I
changed the code to print NNNN or SSSS instead.  I also made the
redacting occur in the last mile (pqTraceOutputInt32 / String) rather
that in their callers: it seemed quite odd to advance the cursor in the
"else" branch.

I refactored the duplicate code that appeared for Notice and Error.
In that function, we redact not only the 'L' field (what Iwata-san was
doing) but also 'F' (file) and 'R' (routine) because those things can
move around for reasons that are not interesting to testing this code.

In the libpq_pipeline commit I added 'pipeline_abort' and 'transaction'
to the cases that generate traces, which adds coverage for
NoticeResponse and ErrorResponse.

--
Álvaro Herrera                            39°49'30"S 73°17'W
So crake failed.  The failure is that it doesn't print the DataRow
messages.  That's quite odd.  We see this in the trace log:

Mar 30 20:05:15 # F    54    Parse     "" "SELECT 1.0/g FROM generate_series(3, -1, -1) g" 0
Mar 30 20:05:15 # F    12    Bind     "" "" 0 0 0
Mar 30 20:05:15 # F    6    Describe     P ""
Mar 30 20:05:15 # F    9    Execute     "" 0
Mar 30 20:05:15 # F    4    Sync
Mar 30 20:05:15 # B    4    ParseComplete
Mar 30 20:05:15 # B    4    BindComplete
Mar 30 20:05:15 # B    33    RowDescription     1 "?column?" NNNN 0 NNNN 65535 -1 0
Mar 30 20:05:15 # B    70    ErrorResponse     S "ERROR" V "ERROR" C "22012" M "division by zero" F "SSSS" L "SSSS" R
"SSSS"\\x00

Mar 30 20:05:15 # B    5    ReadyForQuery     I

and the expected is this:

Mar 30 20:05:15 # F    54    Parse     "" "SELECT 1.0/g FROM generate_series(3, -1, -1) g" 0
Mar 30 20:05:15 # F    12    Bind     "" "" 0 0 0
Mar 30 20:05:15 # F    6    Describe     P ""
Mar 30 20:05:15 # F    9    Execute     "" 0
Mar 30 20:05:15 # F    4    Sync
Mar 30 20:05:15 # B    4    ParseComplete
Mar 30 20:05:15 # B    4    BindComplete
Mar 30 20:05:15 # B    33    RowDescription     1 "?column?" NNNN 0 NNNN 65535 -1 0
Mar 30 20:05:15 # B    32    DataRow     1 22 '0.33333333333333333333'
Mar 30 20:05:15 # B    32    DataRow     1 22 '0.50000000000000000000'
Mar 30 20:05:15 # B    32    DataRow     1 22 '1.00000000000000000000'
Mar 30 20:05:15 # B    70    ErrorResponse     S "ERROR" V "ERROR" C "22012" M "division by zero" F "SSSS" L "SSSS" R
"SSSS"\\x00

Mar 30 20:05:15 # B    5    ReadyForQuery     I


...

I wonder if this is a libpq pipeline problem rather than a PQtrace
problem.  In that test case we're using the libpq singlerow mode, so we
should see three rows before the error is sent, but for some reason
crake is not doing that.

aborted pipeline... NOTICE:  table "pq_pipeline_demo" does not exist, skipping
ok
got expected ERROR:  cannot insert multiple commands into a prepared statement
got expected division-by-zero
ok 5 - libpq_pipeline pipeline_abort
not ok 6 - pipeline_abort trace match


Other hosts seem to get it right:

# Running: libpq_pipeline -t
/Users/buildfarm/bf-data/HEAD/pgsql.build/src/test/modules/libpq_pipeline/tmp_check/log/pipeline_abort.trace
pipeline_abortport=49797 host=/var/folders/md/8mp8j5m5169ccgy11plb4w_80000gp/T/iA9YP9_IHa dbname='postgres' 10000

aborted pipeline... NOTICE:  table "pq_pipeline_demo" does not exist, skipping
ok
got expected ERROR:  cannot insert multiple commands into a prepared statement
got row: 0.33333333333333333333
got row: 0.50000000000000000000
got row: 1.00000000000000000000
got expected division-by-zero
ok 5 - libpq_pipeline pipeline_abort
ok 6 - pipeline_abort trace match


--
Álvaro Herrera       Valdivia, Chile
"This is what I like so much about PostgreSQL.  Most of the surprises
are of the "oh wow!  That's cool" Not the "oh shit!" kind.  :)"
Scott Marlowe, http://archives.postgresql.org/pgsql-admin/2008-10/msg00152.php
From: 'alvherre@alvh.no-ip.org' <alvherre@alvh.no-ip.org>
> Okay, pushed this patch and the new testing for it based on
> libpq_pipeline.  We'll see how the buildfarm likes it.

Thank you very much!  I appreciate you taking your valuable time while I imagine you must be pretty busy with taking
careof other (possibly more important) patches.


TBH, when Tom-san suggested drastic change, I was afraid we may not be able to complete this in PG 14.  But in the end,
I'mvery happy that the patch has become much leaner and cleaner.


And congratulations on your first commit, Iwata-san!  I hope you can have time and energy to try adding a connection
parameterto enable tracing, which eliminates application modification.


> I didn't like the idea of silently skipping the redacted fields, so I
> changed the code to print NNNN or SSSS instead.  I also made the
> redacting occur in the last mile (pqTraceOutputInt32 / String) rather
> that in their callers: it seemed quite odd to advance the cursor in the
> "else" branch.
>
> I refactored the duplicate code that appeared for Notice and Error.
> In that function, we redact not only the 'L' field (what Iwata-san was
> doing) but also 'F' (file) and 'R' (routine) because those things can
> move around for reasons that are not interesting to testing this code.
>
> In the libpq_pipeline commit I added 'pipeline_abort' and 'transaction'
> to the cases that generate traces, which adds coverage for
> NoticeResponse and ErrorResponse.

These make sense to me.  Thank you for repeatedly polishing and making the patch better much.


Regards
Takayuki Tsunakawa
On 2021-Mar-30, 'alvherre@alvh.no-ip.org' wrote:

> got expected ERROR:  cannot insert multiple commands into a prepared statement
> got expected division-by-zero

Eh?  this is not at all expected, of course, but clearly not PQtrace's
fault.  I'll look tomorrow.

--
Álvaro Herrera                            39°49'30"S 73°17'W
"El sentido de las cosas no viene de las cosas, sino de
las inteligencias que las aplican a sus problemas diarios
en busca del progreso." (Ernesto Hernández-Novich)
From: 'alvherre@alvh.no-ip.org' <alvherre@alvh.no-ip.org>
> > got expected ERROR:  cannot insert multiple commands into a prepared
> statement
> > got expected division-by-zero
>
> Eh?  this is not at all expected, of course, but clearly not PQtrace's
> fault.  I'll look tomorrow.

Iwata-san and I were starting to investigate the issue.  I guessed the first message was not expected.  Please let us
knowif there's something we can help.


(I was amazed that you finally committed this great feature, libpq pipeline, while you are caring about many patches.)


Regards
Takayuki Tsunakawa
"'alvherre@alvh.no-ip.org'" <alvherre@alvh.no-ip.org> writes:
> So crake failed.  The failure is that it doesn't print the DataRow
> messages.  That's quite odd.  We see this in the trace log:

I think this is a timing problem that's triggered (on some machines)
by force_parallel_mode = regress.  Looking at spurfowl's latest
failure of this type, the postmaster log shows

2021-03-31 14:34:54.982 EDT [18233:15] 001_libpq_pipeline.pl LOG:  execute <unnamed>: SELECT 1.0/g FROM
generate_series(3,-1, -1) g
2021-03-31 14:34:54.992 EDT [18234:1] ERROR:  division by zero
2021-03-31 14:34:54.992 EDT [18234:2] STATEMENT:  SELECT 1.0/g FROM generate_series(3, -1, -1) g
2021-03-31 14:34:54.993 EDT [18233:16] 001_libpq_pipeline.pl ERROR:  division by zero
2021-03-31 14:34:54.993 EDT [18233:17] 001_libpq_pipeline.pl STATEMENT:  SELECT 1.0/g FROM generate_series(3, -1, -1) g
2021-03-31 14:34:54.995 EDT [18216:4] LOG:  background worker "parallel worker" (PID 18234) exited with exit code 1
2021-03-31 14:34:54.995 EDT [18233:18] 001_libpq_pipeline.pl LOG:  could not send data to client: Broken pipe
2021-03-31 14:34:54.995 EDT [18233:19] 001_libpq_pipeline.pl FATAL:  connection to client lost

We can see that the division by zero occurred in a parallel worker.
My theory is that in parallel mode, it's uncertain whether the
error will be reported before or after the "preceding" successful
output rows.  So you need to disable parallelism to make this
test case stable.

            regards, tom lane
On 2021-Mar-31, Tom Lane wrote:

> I think this is a timing problem that's triggered (on some machines)
> by force_parallel_mode = regress.  Looking at spurfowl's latest
> failure of this type, the postmaster log shows
>
> 2021-03-31 14:34:54.982 EDT [18233:15] 001_libpq_pipeline.pl LOG:  execute <unnamed>: SELECT 1.0/g FROM
generate_series(3,-1, -1) g

> 2021-03-31 14:34:54.992 EDT [18234:1] ERROR:  division by zero
> 2021-03-31 14:34:54.992 EDT [18234:2] STATEMENT:  SELECT 1.0/g FROM generate_series(3, -1, -1) g
> 2021-03-31 14:34:54.993 EDT [18233:16] 001_libpq_pipeline.pl ERROR:  division by zero
> 2021-03-31 14:34:54.993 EDT [18233:17] 001_libpq_pipeline.pl STATEMENT:  SELECT 1.0/g FROM generate_series(3, -1, -1)
g
> 2021-03-31 14:34:54.995 EDT [18216:4] LOG:  background worker "parallel worker" (PID 18234) exited with exit code 1
> 2021-03-31 14:34:54.995 EDT [18233:18] 001_libpq_pipeline.pl LOG:  could not send data to client: Broken pipe
> 2021-03-31 14:34:54.995 EDT [18233:19] 001_libpq_pipeline.pl FATAL:  connection to client lost
>
> We can see that the division by zero occurred in a parallel worker.
> My theory is that in parallel mode, it's uncertain whether the
> error will be reported before or after the "preceding" successful
> output rows.  So you need to disable parallelism to make this
> test case stable.

Ooh, that makes sense, thanks.  Added a SET in the program itself to set
it to off.

This is not the *only* issue though; at least animal drongo shows a
completely different failure, where the last few tests don't even get to
run, and the server log just has this:

2021-03-31 20:20:14.460 UTC [178364:4] 001_libpq_pipeline.pl LOG:  disconnection: session time: 0:00:00.469
user=pgrunnerdatabase=postgres host=127.0.0.1 port=52638

2021-03-31 20:20:14.681 UTC [178696:1] [unknown] LOG:  connection received: host=127.0.0.1 port=52639
2021-03-31 20:20:14.687 UTC [178696:2] [unknown] LOG:  connection authorized: user=pgrunner database=postgres
application_name=001_libpq_pipeline.pl
2021-03-31 20:20:15.157 UTC [178696:3] 001_libpq_pipeline.pl LOG:  could not receive data from client: An existing
connectionwas forcibly closed by the remote host.


I suppose the program is crashing for some reason.

--
Álvaro Herrera       Valdivia, Chile
"Los dioses no protegen a los insensatos.  Éstos reciben protección de
otros insensatos mejor dotados" (Luis Wu, Mundo Anillo)
"'alvherre@alvh.no-ip.org'" <alvherre@alvh.no-ip.org> writes:
> This is not the *only* issue though; at least animal drongo shows a
> completely different failure, where the last few tests don't even get to
> run, and the server log just has this:

That is weird - only test 4 (of 8) runs at all, the rest seem to
fail to connect.  What's different about pipelined_insert?

            regards, tom lane
I wrote:
> That is weird - only test 4 (of 8) runs at all, the rest seem to
> fail to connect.  What's different about pipelined_insert?

Oh ... there's a pretty obvious theory.  pipelined_insert is
the only one that is not asked to write a trace file.
So for some reason, opening the trace file fails.
(I wonder why we don't see an error message for this though.)

            regards, tom lane
On 2021-Mar-31, Tom Lane wrote:

> I wrote:
> > That is weird - only test 4 (of 8) runs at all, the rest seem to
> > fail to connect.  What's different about pipelined_insert?
>
> Oh ... there's a pretty obvious theory.  pipelined_insert is
> the only one that is not asked to write a trace file.
> So for some reason, opening the trace file fails.
> (I wonder why we don't see an error message for this though.)

.. oh, I think we forgot to set conn->Pfdebug = NULL when creating the
connection.  So when we do PQtrace(), the first thing it does is
PQuntrace(), and then that tries to do fflush(conn->Pfdebug) ---> crash.
So this should fix it.

--
Álvaro Herrera       Valdivia, Chile
<inflex> really, I see PHP as like a strange amalgamation of C, Perl, Shell
<crab> inflex: you know that "amalgam" means "mixture with mercury",
       more or less, right?
<crab> i.e., "deadly poison"
Attachment
On 2021-Mar-31, 'alvherre@alvh.no-ip.org' wrote:

> .. oh, I think we forgot to set conn->Pfdebug = NULL when creating the
> connection.  So when we do PQtrace(), the first thing it does is
> PQuntrace(), and then that tries to do fflush(conn->Pfdebug) ---> crash.
> So this should fix it.

I tried to use MALLOC_PERTURB_ to prove this theory, but I failed at it.
I'll just push this blind and see what happens.

--
Álvaro Herrera                            39°49'30"S 73°17'W
"Someone said that it is at least an order of magnitude more work to do
production software than a prototype. I think he is wrong by at least
an order of magnitude."                              (Brian Kernighan)
"'alvherre@alvh.no-ip.org'" <alvherre@alvh.no-ip.org> writes:
> On 2021-Mar-31, Tom Lane wrote:
>> So for some reason, opening the trace file fails.
>> (I wonder why we don't see an error message for this though.)

> .. oh, I think we forgot to set conn->Pfdebug = NULL when creating the
> connection.  So when we do PQtrace(), the first thing it does is
> PQuntrace(), and then that tries to do fflush(conn->Pfdebug) ---> crash.
> So this should fix it.

Nope, see the MemSet a few lines further up.  This change seems like
good style, but it won't fix anything --- else we'd have been
having issues with the pre-existing trace logic.

What I suspect is some Windows dependency in the way that
001_libpq_pipeline.pl is setting up the trace output files.
cc'ing Andrew to see if he has any ideas.

            regards, tom lane
I wrote:
> What I suspect is some Windows dependency in the way that
> 001_libpq_pipeline.pl is setting up the trace output files.

While this may have little to do with drongo's issue,
I'm going to take exception to this bit that I see that
the patch added to PQtrace():

    /* Make the trace stream line-buffered */
    setvbuf(debug_port, NULL, _IOLBF, 0);

I do not like that on two grounds:

1. The trace file handle belongs to the calling application,
not to libpq.  I do not think libpq has any business editorializing
on the file's settings.

2. POSIX says that setvbuf() must be done before any other
operation on the file.  Since we have no way to know whether
any output has already been written to the trace file, the
above is a spec violation.


... and as for an actual explanation for drongo's issue,
I'm sort of wondering why libpq_pipeline.c is opening the
trace file in "w+" mode rather than vanilla "w" mode.
That seems unnecessary, and maybe it doesn't work so well
on Windows.

            regards, tom lane
On 2021-Mar-31, Tom Lane wrote:

> While this may have little to do with drongo's issue,
> I'm going to take exception to this bit that I see that
> the patch added to PQtrace():
>
>     /* Make the trace stream line-buffered */
>     setvbuf(debug_port, NULL, _IOLBF, 0);

Mea culpa.  I added this early on because it made PQtrace's use more
comfortable, but I agree that it's a mistake.  Removed.  I put it in
libpq_pipeline.c instead.

> ... and as for an actual explanation for drongo's issue,
> I'm sort of wondering why libpq_pipeline.c is opening the
> trace file in "w+" mode rather than vanilla "w" mode.
> That seems unnecessary, and maybe it doesn't work so well
> on Windows.

well, at least the MSVC documentation claims that it works, but who
knows.  I removed that too.
https://docs.microsoft.com/en-us/cpp/c-runtime-library/reference/fopen-wfopen?view=msvc-160

--
Álvaro Herrera       Valdivia, Chile
On 2021-Mar-31, Tom Lane wrote:

> I wrote:
> > That is weird - only test 4 (of 8) runs at all, the rest seem to
> > fail to connect.  What's different about pipelined_insert?
>
> Oh ... there's a pretty obvious theory.  pipelined_insert is
> the only one that is not asked to write a trace file.
> So for some reason, opening the trace file fails.
> (I wonder why we don't see an error message for this though.)

Eh, so I forgot to strdup(optarg[optind]).  Apparently that works fine
in glibc but other getopt implementations are likely not so friendly.

--
Álvaro Herrera                            39°49'30"S 73°17'W
"I am amazed at [the pgsql-sql] mailing list for the wonderful support, and
lack of hesitasion in answering a lost soul's question, I just wished the rest
of the mailing list could be like this."                               (Fotis)
               (http://archives.postgresql.org/pgsql-sql/2006-06/msg00265.php)
"'alvherre@alvh.no-ip.org'" <alvherre@alvh.no-ip.org> writes:
> Eh, so I forgot to strdup(optarg[optind]).  Apparently that works fine
> in glibc but other getopt implementations are likely not so friendly.

Hmm ... interesting theory, but I don't think I buy it, since the
program isn't doing anything that should damage argv[].  I guess
we'll soon find out.

            regards, tom lane
BTW, what in the world is this supposed to accomplish?

-                        (long long) rows_to_send);
+                        (1L << 62) + (long long) rows_to_send);

Various buildfarm members are complaining that the shift distance
is more than the width of "long", which I'd just fix with s/L/LL/
except that the addition of the constant seems just wrong to
begin with.

            regards, tom lane
On 2021-Apr-01, Tom Lane wrote:

> BTW, what in the world is this supposed to accomplish?
>
> -                        (long long) rows_to_send);
> +                        (1L << 62) + (long long) rows_to_send);
>
> Various buildfarm members are complaining that the shift distance
> is more than the width of "long", which I'd just fix with s/L/LL/
> except that the addition of the constant seems just wrong to
> begin with.

It makes the text representation wider, which means some buffer fills up
faster and the program switches from sending to receiving.

--
Álvaro Herrera       Valdivia, Chile
"Ni aún el genio muy grande llegaría muy lejos
si tuviera que sacarlo todo de su propio interior" (Goethe)
"'alvherre@alvh.no-ip.org'" <alvherre@alvh.no-ip.org> writes:
> On 2021-Apr-01, Tom Lane wrote:
>> BTW, what in the world is this supposed to accomplish?
>> -                        (long long) rows_to_send);
>> +                        (1L << 62) + (long long) rows_to_send);

> It makes the text representation wider, which means some buffer fills up
> faster and the program switches from sending to receiving.

Hm.  If the actual field value isn't relevant, why bother including
rows_to_send in it?  A constant string would be simpler and much
less confusing as to its purpose.

            regards, tom lane
So drongo is still failing, and after a bit of looking around at
other code I finally got hit with the clue hammer.  Per port.h:

 * On Windows, setvbuf() does not support _IOLBF mode, and interprets that
 * as _IOFBF.  To add insult to injury, setvbuf(file, NULL, _IOFBF, 0)
 * crashes outright if "parameter validation" is enabled.  Therefore, in
 * places where we'd like to select line-buffered mode, we fall back to
 * unbuffered mode instead on Windows.  Always use PG_IOLBF not _IOLBF
 * directly in order to implement this behavior.

You want to do the honors?  And do something about that shift bug
while at it.

            regards, tom lane
On 2021-Apr-01, Tom Lane wrote:

> "'alvherre@alvh.no-ip.org'" <alvherre@alvh.no-ip.org> writes:
> > On 2021-Apr-01, Tom Lane wrote:
> >> BTW, what in the world is this supposed to accomplish?
> >> -                        (long long) rows_to_send);
> >> +                        (1L << 62) + (long long) rows_to_send);
>
> > It makes the text representation wider, which means some buffer fills up
> > faster and the program switches from sending to receiving.
>
> Hm.  If the actual field value isn't relevant, why bother including
> rows_to_send in it?  A constant string would be simpler and much
> less confusing as to its purpose.

Hah, yeah, we could as well do that I guess :-)

--
Álvaro Herrera       Valdivia, Chile
"I think my standards have lowered enough that now I think 'good design'
is when the page doesn't irritate the living f*ck out of me." (JWZ)
On 2021-Apr-01, Tom Lane wrote:

> So drongo is still failing, and after a bit of looking around at
> other code I finally got hit with the clue hammer.  Per port.h:
>
>  * On Windows, setvbuf() does not support _IOLBF mode, and interprets that
>  * as _IOFBF.  To add insult to injury, setvbuf(file, NULL, _IOFBF, 0)
>  * crashes outright if "parameter validation" is enabled.  Therefore, in
>  * places where we'd like to select line-buffered mode, we fall back to
>  * unbuffered mode instead on Windows.  Always use PG_IOLBF not _IOLBF
>  * directly in order to implement this behavior.
>
> You want to do the honors?  And do something about that shift bug
> while at it.

Ooh, wow ... now that is a silly bug!  Thanks, I'll push the fix in a
minute.

Andrew also noted that the use of command_ok() in the test file eats all
the output and is what is preventing us from seeing it in the first.
I'll try to get rid of that together with the rest.

--
Álvaro Herrera       Valdivia, Chile
On 2021-Apr-01, 'alvherre@alvh.no-ip.org' wrote:

> Ooh, wow ... now that is a silly bug!  Thanks, I'll push the fix in a
> minute.

It still didn't fix it!  Drongo is now reporting a difference in the
expected trace -- and the differences all seem to be message lengths.
Now that is pretty mysterious, because the messages themselves are
printed identically.  Perl's output is pretty unhelpful, but I wrote them to a
file and diffed manually; it's attached.

So for example when we expect
! # B    123    ErrorResponse     S "ERROR" V "ERROR" C "42601" M "cannot insert multiple commands into a prepared
statement"F "SSSS" L "SSSS" R "SSSS" \\x00


we actually get
! # B    173    ErrorResponse     S "ERROR" V "ERROR" C "42601" M "cannot insert multiple commands into a prepared
statement"F "SSSS" L "SSSS" R "SSSS" \\x00


[slaps forehead] I suppose the difference must be that the message
length includes the redacted string fields.  So the file in the F file
is 50 chars longer, *kaboom*.  (I'm actually very surprised that this
didn't blow up earlier.)

I'm not sure what to do about this. Maybe the message length for
ErrorResponse/NoticeResponse ought to be redacted too.

--
Álvaro Herrera                            39°49'30"S 73°17'W
Hi Alvaro san

Thank you for your fix of trace log code.

> From: 'alvherre@alvh.no-ip.org' <alvherre@alvh.no-ip.org>
> Sent: Friday, April 2, 2021 11:30 AM
...
> It still didn't fix it!  Drongo is now reporting a difference in the expected trace --
> and the differences all seem to be message lengths.
> Now that is pretty mysterious, because the messages themselves are printed
> identically.  Perl's output is pretty unhelpful, but I wrote them to a file and diffed
> manually; it's attached.

Do ErrorResponse and NoticeResponse vary from test to test ...?
If so, it seemed difficult to make the trace logs available for regression test.
I will also investigate the cause of this issue.

Regards,
Aya Iwata
At Fri, 2 Apr 2021 02:56:44 +0000, "iwata.aya@fujitsu.com" <iwata.aya@fujitsu.com> wrote in
> Hi Alvaro san
>
> Thank you for your fix of trace log code.
>
> > From: 'alvherre@alvh.no-ip.org' <alvherre@alvh.no-ip.org>
> > Sent: Friday, April 2, 2021 11:30 AM
> ...
> > It still didn't fix it!  Drongo is now reporting a difference in the expected trace --
> > and the differences all seem to be message lengths.
> > Now that is pretty mysterious, because the messages themselves are printed
> > identically.  Perl's output is pretty unhelpful, but I wrote them to a file and diffed
> > manually; it's attached.
>
> Do ErrorResponse and NoticeResponse vary from test to test ...?
> If so, it seemed difficult to make the trace logs available for regression test.
> I will also investigate the cause of this issue.

The redacted fields, F, L and R contained source file, souce line and
source function respectively. It is reasonable guess that the
difference comes from them but I'm not sure how they make a difference
of 50 bytes in length...

Anyway if the length is wrong, we should get an error after emitting
the log line.

>    if (logCursor - 1 != length)
>        fprintf(conn->Pfdebug,
>                "mismatched message length: consumed %d, expected %d\n",
>                logCursor - 1, length);

So, the cheapest measure for regression test would be just making the
length field, while regress is true...

regards.

--
Kyotaro Horiguchi
NTT Open Source Software Center
Kyotaro Horiguchi <horikyota.ntt@gmail.com> writes:
> At Fri, 2 Apr 2021 02:56:44 +0000, "iwata.aya@fujitsu.com" <iwata.aya@fujitsu.com> wrote in
>> Do ErrorResponse and NoticeResponse vary from test to test ...?
>> If so, it seemed difficult to make the trace logs available for regression test.
>> I will also investigate the cause of this issue.

> The redacted fields, F, L and R contained source file, souce line and
> source function respectively. It is reasonable guess that the
> difference comes from them but I'm not sure how they make a difference
> of 50 bytes in length...

Some compilers include the full path of the source file in F ...

            regards, tom lane
At Fri, 02 Apr 2021 14:40:09 +0900 (JST), Kyotaro Horiguchi <horikyota.ntt@gmail.com> wrote in
> At Fri, 2 Apr 2021 02:56:44 +0000, "iwata.aya@fujitsu.com" <iwata.aya@fujitsu.com> wrote in
> > Hi Alvaro san
> >
> > Thank you for your fix of trace log code.
> >
> > > From: 'alvherre@alvh.no-ip.org' <alvherre@alvh.no-ip.org>
> > > Sent: Friday, April 2, 2021 11:30 AM
> > ...
> > > It still didn't fix it!  Drongo is now reporting a difference in the expected trace --
> > > and the differences all seem to be message lengths.
> > > Now that is pretty mysterious, because the messages themselves are printed
> > > identically.  Perl's output is pretty unhelpful, but I wrote them to a file and diffed
> > > manually; it's attached.
> >
> > Do ErrorResponse and NoticeResponse vary from test to test ...?
> > If so, it seemed difficult to make the trace logs available for regression test.
> > I will also investigate the cause of this issue.
>
> The redacted fields, F, L and R contained source file, souce line and
> source function respectively. It is reasonable guess that the
> difference comes from them but I'm not sure how they make a difference
> of 50 bytes in length...
>
> Anyway if the length is wrong, we should get an error after emitting
> the log line.
>
> >    if (logCursor - 1 != length)
> >        fprintf(conn->Pfdebug,
> >                "mismatched message length: consumed %d, expected %d\n",
> >                logCursor - 1, length);
>
> So, the cheapest measure for regression test would be just making the

So, the cheapest measure for regression test would be just *masking* the

> length field, while regress is true...

tired?

--
Kyotaro Horiguchi
NTT Open Source Software Center
At Fri, 02 Apr 2021 01:45:06 -0400, Tom Lane <tgl@sss.pgh.pa.us> wrote in
> Kyotaro Horiguchi <horikyota.ntt@gmail.com> writes:
> > At Fri, 2 Apr 2021 02:56:44 +0000, "iwata.aya@fujitsu.com" <iwata.aya@fujitsu.com> wrote in
> >> Do ErrorResponse and NoticeResponse vary from test to test ...?
> >> If so, it seemed difficult to make the trace logs available for regression test.
> >> I will also investigate the cause of this issue.
>
> > The redacted fields, F, L and R contained source file, souce line and
> > source function respectively. It is reasonable guess that the
> > difference comes from them but I'm not sure how they make a difference
> > of 50 bytes in length...
>
> Some compilers include the full path of the source file in F ...

Ah. I suspected that but dismissed the possibility looking that on my
environment, gcc8.  That completely makes sense. Thank you!

regards.

--
Kyotaro Horiguchi
NTT Open Source Software Center
On 2021-Apr-02, Kyotaro Horiguchi wrote:

> At Fri, 02 Apr 2021 14:40:09 +0900 (JST), Kyotaro Horiguchi <horikyota.ntt@gmail.com> wrote in

> > So, the cheapest measure for regression test would be just making the
>
> So, the cheapest measure for regression test would be just *masking* the
>
> > length field, while regress is true...

Yeah.

> tired?

Same here.

--
Álvaro Herrera                            39°49'30"S 73°17'W
"Thou shalt not follow the NULL pointer, for chaos and madness await
thee at its end." (2nd Commandment for C programmers)
On 2021-Apr-02, Alvaro Herrera wrote:

> On 2021-Apr-02, Kyotaro Horiguchi wrote:
>
> > At Fri, 02 Apr 2021 14:40:09 +0900 (JST), Kyotaro Horiguchi <horikyota.ntt@gmail.com> wrote in
>
> > > So, the cheapest measure for regression test would be just making the
> >
> > So, the cheapest measure for regression test would be just *masking* the
> >
> > > length field, while regress is true...
>
> Yeah.

As in the attached patch.

--
Álvaro Herrera       Valdivia, Chile
"Investigación es lo que hago cuando no sé lo que estoy haciendo"
(Wernher von Braun)
Attachment
Alvaro Herrera <alvherre@alvh.no-ip.org> writes:
> As in the attached patch.

+1, but the comment could be more specific.  Maybe like "In regress mode,
suppress the length of ErrorResponse and NoticeResponse messages --- the F
(file name) field, in particular, can vary in length depending on compiler
used."

Actually though ... I recall now that elog.c tries to standardize the F
output by stripping the path part:

        /* keep only base name, useful especially for vpath builds */
        slash = strrchr(filename, '/');
        if (slash)
            filename = slash + 1;

I bet what is happening on drongo is that the compiler has generated a
__FILE__ value that contains backslashes not slashes, and this code
doesn't know how to shorten those.  So maybe instead of lobotomizing
this test, we should fix that.

        slash = strrchr(filename, '/');
+        if (!slash)
+            slash = strrchr(filename, '\\');
        if (slash)
            filename = slash + 1;

            regards, tom lane
I wrote:
> I bet what is happening on drongo is that the compiler has generated a
> __FILE__ value that contains backslashes not slashes, and this code
> doesn't know how to shorten those.  So maybe instead of lobotomizing
> this test, we should fix that.

Did that, but we'll have to wait a few hours to see if it makes
drongo happy.

            regards, tom lane
I wrote:
>> I bet what is happening on drongo is that the compiler has generated a
>> __FILE__ value that contains backslashes not slashes, and this code
>> doesn't know how to shorten those.  So maybe instead of lobotomizing
>> this test, we should fix that.

> Did that, but we'll have to wait a few hours to see if it makes
> drongo happy.

On third thought, maybe we should push your patch too.  Although I think
53aafdb9f is going to fix the platform-specific aspect of this, we are
still going to risk some implementation dependence of the libpq_pipeline
results:

* Every so often, the number of digits in the reported line numbers
will change (999 -> 1001 or the like), due to changes in unrelated
code.

* Occasionally we refactor things so that the "same" error is reported
from a different file.

It's hard to judge whether that will happen often enough to be an
annoying maintenance problem, but there's definitely a hazard.
Not sure if we should proactively lobotomize the test, or wait to
see if we get annoyed.

In any case I'd like to wait till after drongo's next run, so
we can confirm whether or not the backslashes-in-__FILE__ hypothesis
is correct.  If it is, then 53aafdb9f is a good fix on its own
merits, independently of libpq_pipeline.

            regards, tom lane
Alvaro Herrera <alvherre@alvh.no-ip.org> writes:
> On 2021-Apr-02, Tom Lane wrote:
>> +1, but the comment could be more specific.  Maybe like "In regress mode,
>> suppress the length of ErrorResponse and NoticeResponse messages --- the F
>> (file name) field, in particular, can vary in length depending on compiler
>> used."

> With your commit this is no longer true, so how about the attached?

Right.  Your text looks fine.

(I see drongo is now green, so it looks like its compiler does indeed emit
backslash-separated full paths.)

            regards, tom lane
On Sat, Jun 5, 2021 at 11:03 AM Alvaro Herrera <alvherre@alvh.no-ip.org> wrote:
> > This added a PQtraceSetFlags() function.  We have a dozen PQset*() functions,
> > but this and PQresultSetInstanceData() are the only PQSomethingSet()
> > functions.  Is it okay if I rename it to PQsetTraceFlags()?  I think that
> > would be more idiomatic for libpq.
>
> Hmm, there is an obvious parallel between PQtrace() and
> PQtraceSetFlags() which is lost with your proposed rename.  I'm not
> wedded to the name though, so I'm just -0.1 on the rename.  If you feel
> strongly about it, I won't oppose it.

I'm +1 for the rename. I think it's a lot more idiomatic.

--
Robert Haas
EDB: http://www.enterprisedb.com
On Mon, Jun 07, 2021 at 11:37:58AM -0400, Robert Haas wrote:
> On Sat, Jun 5, 2021 at 11:03 AM Alvaro Herrera <alvherre@alvh.no-ip.org> wrote:
> > > This added a PQtraceSetFlags() function.  We have a dozen PQset*() functions,
> > > but this and PQresultSetInstanceData() are the only PQSomethingSet()
> > > functions.  Is it okay if I rename it to PQsetTraceFlags()?  I think that
> > > would be more idiomatic for libpq.
> >
> > Hmm, there is an obvious parallel between PQtrace() and
> > PQtraceSetFlags() which is lost with your proposed rename.  I'm not
> > wedded to the name though, so I'm just -0.1 on the rename.  If you feel
> > strongly about it, I won't oppose it.
>
> I'm +1 for the rename. I think it's a lot more idiomatic.

At +1 vs. -0.1, I would have withdrawn the proposal.  Seeing +2 vs. -0.1, I
have pushed it.