Thread: patch: improve SLRU replacement algorithm
On Mon, Apr 2, 2012 at 12:33 PM, Robert Haas <robertmhaas@gmail.com> wrote:
> This particular example shows the above chunk of code taking >13s to
> execute.  Within 3s, every other backend piles up behind that, leading
> to the database getting no work at all done for a good ten seconds.
>
> My guess is that what's happening here is that one backend needs to
> read a page into CLOG, so it calls SlruSelectLRUPage to evict the
> oldest SLRU page, which is dirty.  For some reason, that I/O takes a
> long time.  Then, one by one, other backends comes along and also need
> to read various SLRU pages, but the oldest SLRU page hasn't changed,
> so SlruSelectLRUPage keeps returning the exact same page that it
> returned before, and everybody queues up waiting for that I/O, even
> though there might be other buffers available that aren't even dirty.
>
> I am thinking that SlruSelectLRUPage() should probably do
> SlruRecentlyUsed() on the selected buffer before calling
> SlruInternalWritePage, so that the next backend that comes along
> looking for a buffer doesn't pick the same one.  Possibly we should go
> further and try to avoid replacing dirty buffers in the first place,
> but sometimes there may be no choice, so doing SlruRecentlyUsed() is
> still a good idea.
>
> I'll do some testing to try to confirm whether this theory is correct
> and whether the above fix helps.

Having performed this investigation, I've discovered a couple of
interesting things.  First, SlruRecentlyUsed() is an ineffective way
of keeping a page from getting reused, because it's called extremely
frequently, and on these high-velocity tests it takes almost no time
at all for the most recently used buffer to become the least recently
used buffer.  Therefore, SlruRecentlyUsed() doesn't prevent the lock
pile-up.  In the unpatched code, once a long buffer I/O starts,
everybody immediately goes into the tank until the I/O finishes.  If
you patch the code so that the page is marked recently-used before
beginning the I/O, everybody's next few CLOG requests hit some other
buffer but eventually the long-I/O-in-progress buffer again becomes
least recently used and the next CLOG eviction causes a second backend
to begin waiting for that buffer.  Lather, rinse, repeat, until
literally every backend is once again waiting on that buffer I/O.  You
still get the same problem; it just takes slightly longer to develop.

On reflection, it seems to me that the right fix here is to make
SlruSelectLRUPage() to avoid selecting a page on which an I/O is
already in progress.  In general, those I/Os are all writes.  We don't
end up waiting for reads because all the old CLOG pages we might want
to read are still in the OS cache.  So reads complete quickly, on this
test.  Writes take a long time, because there we have to actually get
the data down to disk, and the disk is busy.  But there's no reason
for a backend doing a replacement to wait for either a read or a write
that is in progress: once the read or write completes, we're going to
loop around and repeat the buffer selection process, and most likely
pick a buffer completely unrelated to the one whose I/O we waited for.
 We might as well just skip the wait and select that other buffer
immediately.  The attached patch implements that.

Applying this patch does in fact eliminate the stalls.  Here are the
top ten places where blocking happens without the patch - these are
counts of times we waited more than 100ms for a lwlock during
30-minute, 32-client pgbench run:

     54 slru.c:311 blocked by slru.c:405
     99 xlog.c:2241 blocked by xlog.c:2090
    172 heapam.c:2758 blocked by heapam.c:2758
    635 indexam.c:521 blocked by heapam.c:2758
    663 xlog.c:2090 blocked by xlog.c:2241
    666 varsup.c:65 blocked by varsup.c:65
    682 heapam.c:2758 blocked by indexam.c:521
    803 xlog.c:1502 blocked by xlog.c:2241
   3002 slru.c:311 blocked by slru.c:529
  23978 xlog.c:909 blocked by xlog.c:909

And with the patch:

     72 hio.c:336 blocked by heapam.c:2758
    109 xlog.c:2241 blocked by xlog.c:2090
    129 slru.c:311 blocked by slru.c:405
    210 heapam.c:2758 blocked by heapam.c:2758
    425 heapam.c:2758 blocked by indexam.c:521
    710 indexam.c:521 blocked by heapam.c:2758
    766 xlog.c:2090 blocked by xlog.c:2241
    915 xlog.c:1502 blocked by xlog.c:2241
   1684 varsup.c:65 blocked by varsup.c:65
  27950 xlog.c:909 blocked by xlog.c:909

As you can see, slru.c:311 blocked by slru.c:529 disappears.  It's not
just no longer in the top ten - it's actually completely gone.
Unfortunately, we get more stalls elsewhere as a result, but that's
only to be expected - contention moves around as you fix things.  The
remaining blocking within slru.c is attributable to the line that says
"129 slru.c:311 blocked by slru.c:405".  I haven't fully verified
this, but I believe that blocking happens there when somebody needs to
read a page that's already being read - the second guy quite naturally
waits for the first guy's I/O to finish.  Those waits are not only
many fewer in number but also much shorter than the problem this patch
fixes, where the whole system piles up waiting on a buffer I/O for no
real good reason.

I ran some 30-minute pgbench tests to try to see how this affected
throughput.  Here are the results; m = master, s =
slru-replacement-fix; the number immediately after that letter is the
client count.  These numbers are without the instrumentation used to
gather the lock-wait data shown above.

m01 tps = 1404.506517 (including connections establishing)
m01 tps = 1378.661239 (including connections establishing)
m01 tps = 1403.880038 (including connections establishing)
s01 tps = 1383.525351 (including connections establishing)
s01 tps = 1365.177884 (including connections establishing)
s01 tps = 1362.275677 (including connections establishing)
m08 tps = 8902.111306 (including connections establishing)
m08 tps = 8864.054359 (including connections establishing)
m08 tps = 8911.271822 (including connections establishing)
s08 tps = 9298.724507 (including connections establishing)
s08 tps = 9473.795213 (including connections establishing)
s08 tps = 9204.661724 (including connections establishing)
m16 tps = 12963.745279 (including connections establishing)
m16 tps = 12654.084955 (including connections establishing)
m16 tps = 13203.021537 (including connections establishing)
s16 tps = 13241.299141 (including connections establishing)
s16 tps = 13280.307298 (including connections establishing)
s16 tps = 12550.540800 (including connections establishing)
m32 tps = 13026.542041 (including connections establishing)
m32 tps = 14362.972612 (including connections establishing)
m32 tps = 14586.169194 (including connections establishing)
s32 tps = 14671.230224 (including connections establishing)
s32 tps = 14487.942766 (including connections establishing)
s32 tps = 14294.915303 (including connections establishing)
m64 tps = 12883.598484 (including connections establishing)
m64 tps = 13927.599008 (including connections establishing)
m64 tps = 13487.756722 (including connections establishing)
s64 tps = 13761.857778 (including connections establishing)
s64 tps = 14001.861641 (including connections establishing)
s64 tps = 14087.215634 (including connections establishing)

There's some apparent regression on the single-client test, but I'm
inclined to think that's a testing artifact of some kind and also
probably not very important.  It would be worth paying a small price
in throughput to avoid many-second entire-database stalls, but on this
test throughput actually goes up in all cases other than a single
client; and it's hard to take the single client case seriously as a
regression anyway because if there's only one thing running, the only
effect of this patch is to slightly increase the amount of CPU effort
that we spend before replacement the same buffer we would have
replaced anyway.  There's no way that's enough to cut 3% off
performance; I think the explanation must be something like, say,
autovacuum runs a bit faster because it doesn't hang as much, but then
that triggers a checkpoint sooner; or something's shuffled itself
around across cache lines in a way that works out a little worse; or
maybe it's just that the patched code was tested second.

A couple of other notes:

1. It's probably also a good idea to hand off fsyncs of CLOG pages to
the background writer, as suggested on the other thread.  However,
even if we do that, this is still a good idea, because I've now found
that occasionally the *write* can be slow rather than (or in addition
to) the fsync.

2. I think we might want to revisit Simon's idea of background-writing
SLRU pages.  That didn't work out well before, but now I think I know
why: without this patch, any write or fsync that takes a while
practically guarantees that the whole system will pile up waiting for
the page lock.  So anything that, like background writing, promises to
increase the total number of writes works out poorly.  But this patch
should remove that obstacle, because now doing a write or fsync that
ends up being slow will only cause latency problems for the person
actually doing it - and it seems clearly preferable for that to be a
background task.  The devil is in the details, of course, but I think
it's worth retesting with this fixed applied, at the least.

3. I noticed that the blocking described by "slru.c:311 blocked by
slru.c:405" seemed to be clumpy - I would get a bunch of messages
about that all at once.  This makes me wonder if the SLRU machinery is
occasionally making a real bad decision about what page to evict, and
then everybody piles up waiting for that page to be read back in.
That is sheer hand-waving at this point and might be complete bologna,
but I'm hoping to find time to investigate further.

--
Robert Haas
EnterpriseDB: http://www.enterprisedb.com
The Enterprise PostgreSQL Company
Attachment
On Wed, Apr 4, 2012 at 8:00 AM, Robert Haas <robertmhaas@gmail.com> wrote:
> There's some apparent regression on the single-client test, but I'm
> inclined to think that's a testing artifact of some kind and also
> probably not very important.  It would be worth paying a small price
> in throughput to avoid many-second entire-database stalls, but on this
> test throughput actually goes up in all cases other than a single
> client; and it's hard to take the single client case seriously as a
> regression anyway because if there's only one thing running, the only
> effect of this patch is to slightly increase the amount of CPU effort
> that we spend before replacement the same buffer we would have
> replaced anyway.  There's no way that's enough to cut 3% off
> performance; I think the explanation must be something like, say,
> autovacuum runs a bit faster because it doesn't hang as much, but then
> that triggers a checkpoint sooner; or something's shuffled itself
> around across cache lines in a way that works out a little worse; or
> maybe it's just that the patched code was tested second.

I reran the single client tests and this time got:

m01 tps = 1357.485132 (including connections establishing)
m01 tps = 1425.967027 (including connections establishing)
m01 tps = 1381.468519 (including connections establishing)
s01 tps = 1411.590074 (including connections establishing)
s01 tps = 1374.938182 (including connections establishing)
s01 tps = 1402.680618 (including connections establishing)

...which seems like ample evidence that there's no real regression
here, if anyone was still worried.

--
Robert Haas
EnterpriseDB: http://www.enterprisedb.com
The Enterprise PostgreSQL Company
On Wed, Apr 4, 2012 at 1:00 PM, Robert Haas <robertmhaas@gmail.com> wrote:
> , everybody's next few CLOG requests hit some other
> buffer but eventually the long-I/O-in-progress buffer again becomes
> least recently used and the next CLOG eviction causes a second backend
> to begin waiting for that buffer.

This still sounds like evidence that the slru is just too small for
this transaction rate. Otherwise there would be some other buffer that
would be accessed similarly infrequently.

Your fix sounds right to me but I would hope it should be fixing
something that would only happen rarely, not every time theres a
write. It sounds like the slru is thrashing quite a bit more than the
code anticipates.

--
greg
On Wed, Apr 4, 2012 at 1:00 PM, Robert Haas <robertmhaas@gmail.com> wrote:
> 3. I noticed that the blocking described by "slru.c:311 blocked by
> slru.c:405" seemed to be clumpy - I would get a bunch of messages
> about that all at once.  This makes me wonder if the SLRU machinery is
> occasionally making a real bad decision about what page to evict, and
> then everybody piles up waiting for that page to be read back in.
> That is sheer hand-waving at this point and might be complete bologna,
> but I'm hoping to find time to investigate further.

Hm, actually, isn't this something your patch would cause? Is it
possible the clumpy ones are the 129 minus 54 additional blocking on this
lock in the patched code? Did it do that in the unpatched code? And
did it do it with fewer than 16 clients?

Because there are only 16 slru pages and 64 clients so occasionally 16
of clients will all be reading a page in and someone will try to flush
the very hottest page from the slru. Or I suppose it would happen
sooner as soon as someone gets pushed up into the working set and hits
a hot enough page.

i didn't actually read the patch. I assume you covered the case where
all the pages are in I/O and so there are no eligible pages to flush?

--
greg
Excerpts from Greg Stark's message of mié abr 04 14:11:29 -0300 2012:
> On Wed, Apr 4, 2012 at 1:00 PM, Robert Haas <robertmhaas@gmail.com> wrote:
> > , everybody's next few CLOG requests hit some other
> > buffer but eventually the long-I/O-in-progress buffer again becomes
> > least recently used and the next CLOG eviction causes a second backend
> > to begin waiting for that buffer.
>
> This still sounds like evidence that the slru is just too small for
> this transaction rate.

What this statement means to me is that the number of slru buffers
should be configurable, not compile-time fixed.

--
Álvaro Herrera <alvherre@commandprompt.com>
The PostgreSQL Company - Command Prompt, Inc.
PostgreSQL Replication, Consulting, Custom Development, 24x7 support
On Wed, Apr 4, 2012 at 1:11 PM, Greg Stark <stark@mit.edu> wrote:
> On Wed, Apr 4, 2012 at 1:00 PM, Robert Haas <robertmhaas@gmail.com> wrote:
>> , everybody's next few CLOG requests hit some other
>> buffer but eventually the long-I/O-in-progress buffer again becomes
>> least recently used and the next CLOG eviction causes a second backend
>> to begin waiting for that buffer.
>
> This still sounds like evidence that the slru is just too small for
> this transaction rate. Otherwise there would be some other buffer that
> would be accessed similarly infrequently.
>
> Your fix sounds right to me but I would hope it should be fixing
> something that would only happen rarely, not every time theres a
> write. It sounds like the slru is thrashing quite a bit more than the
> code anticipates.

Yes, the SLRU is thrashing heavily.  In this configuration, there are
32 CLOG buffers.  I just added an elog() every time we replace a
buffer.  Here's a sample of how often that's firing, by second, on
this test (pgbench with 32 clients):
  4191 19:54:21  4540 19:54:22  4295 19:54:23  3931 19:54:24  4294 19:54:25   478 19:54:26    72 19:54:27   818
19:54:28  876 19:54:29  1498 19:54:30  3526 19:54:31  1874 19:54:32   551 19:54:35  3746 19:54:36  3846 19:54:37  3803
19:54:38 3593 19:54:39  3016 19:54:40  3233 19:54:41  3190 19:54:42  3291 19:54:43  5068 19:54:44  3877 19:54:45     2
19:54:46 1678 19:54:47  1005 19:54:48   947 19:54:49  1007 19:54:50   921 19:54:51   931 19:54:52   147 19:54:53  1103
19:54:54  898 19:54:55   674 19:54:56   274 19:54:57  1081 19:54:58  1874 19:54:59  1067 19:55:00   328 19:55:01  1507
19:55:02 3735 19:55:03   138 19:55:04     1 19:55:05  2667 19:55:09  5373 19:55:10  5175 19:55:11  5062 19:55:12


So, yes, we're thrashing CLOG pretty hard.  But, I think that's a
mostly separate issue.  Reworking the SLRU code so that it can
efficiently handle a larger number of buffers is probably a good thing
to do, but unless we're planning to make the CLOG SLRU so large that
we NEVER have multiple people trying to replace buffers at the same
time, this fix is still necessary and appropriate.

--
Robert Haas
EnterpriseDB: http://www.enterprisedb.com
The Enterprise PostgreSQL Company

diff --git a/src/backend/access/transam/slru.c
b/src/backend/access/transam/slru.c
index 3049e01..6f92679 100644
--- a/src/backend/access/transam/slru.c
+++ b/src/backend/access/transam/slru.c
@@ -390,6 +390,9 @@ SimpleLruReadPage(SlruCtl ctl, int pageno, bool write_ok,                       return slotno;
        }


+               elog(LOG, "SLRU %d reading page %d", shared->ControlLock,
+                       pageno);
+               /* We found no match; assert we selected a freeable slot */
Assert(shared->page_status[slotno]== SLRU_PAGE_EMPTY ||                          (shared->page_status[slotno] ==
SLRU_PAGE_VALID&&
On Wed, Apr 4, 2012 at 1:00 PM, Robert Haas <robertmhaas@gmail.com> wrote:

>> I'll do some testing to try to confirm whether this theory is correct
>> and whether the above fix helps.
Very interesting work.


> Having performed this investigation, I've discovered a couple of
> interesting things.  First, SlruRecentlyUsed() is an ineffective way
> of keeping a page from getting reused, because it's called extremely
> frequently, and on these high-velocity tests it takes almost no time
> at all for the most recently used buffer to become the least recently
> used buffer.

Measurement?

> Therefore, SlruRecentlyUsed() doesn't prevent the lock
> pile-up.  In the unpatched code, once a long buffer I/O starts,
> everybody immediately goes into the tank until the I/O finishes.  If
> you patch the code so that the page is marked recently-used before
> beginning the I/O, everybody's next few CLOG requests hit some other
> buffer but eventually the long-I/O-in-progress buffer again becomes
> least recently used and the next CLOG eviction causes a second backend
> to begin waiting for that buffer.  Lather, rinse, repeat, until
> literally every backend is once again waiting on that buffer I/O.  You
> still get the same problem; it just takes slightly longer to develop.

Sounds believable, I just want to make sure we have measured things.

> On reflection, it seems to me that the right fix here is to make
> SlruSelectLRUPage() to avoid selecting a page on which an I/O is
> already in progress.  In general, those I/Os are all writes.  We don't
> end up waiting for reads because all the old CLOG pages we might want
> to read are still in the OS cache.  So reads complete quickly, on this
> test.

I believe that, but if all buffers are I/O busy we should avoid
waiting on a write I/O if possible.

>  Writes take a long time, because there we have to actually get
> the data down to disk, and the disk is busy.  But there's no reason
> for a backend doing a replacement to wait for either a read or a write
> that is in progress: once the read or write completes, we're going to
> loop around and repeat the buffer selection process, and most likely
> pick a buffer completely unrelated to the one whose I/O we waited for.
>  We might as well just skip the wait and select that other buffer
> immediately.  The attached patch implements that.

That seems much smarter. I'm thinking this should be back patched
because it appears to be fairly major, so I'm asking for some more
certainty that every thing you say here is valid. No doubt much of it
is valid, but that's not enough.

> Applying this patch does in fact eliminate the stalls.

I'd like to see that measured from a user perspective. It would be
good to see the response time distribution for run with and without
the patch.

> 2. I think we might want to revisit Simon's idea of background-writing
> SLRU pages.

Agreed. No longer anywhere near as important. I'll take a little
credit for identifying the right bottleneck, since you weren't a
believer before.

--
 Simon Riggs                   http://www.2ndQuadrant.com/
 PostgreSQL Development, 24x7 Support, Training & Services
On Wed, Apr 4, 2012 at 6:25 PM, Alvaro Herrera
<alvherre@commandprompt.com> wrote:
>
> Excerpts from Greg Stark's message of mié abr 04 14:11:29 -0300 2012:
>> On Wed, Apr 4, 2012 at 1:00 PM, Robert Haas <robertmhaas@gmail.com> wrote:
>> > , everybody's next few CLOG requests hit some other
>> > buffer but eventually the long-I/O-in-progress buffer again becomes
>> > least recently used and the next CLOG eviction causes a second backend
>> > to begin waiting for that buffer.
>>
>> This still sounds like evidence that the slru is just too small for
>> this transaction rate.
>
> What this statement means to me is that the number of slru buffers
> should be configurable, not compile-time fixed.

I think the compile time fixed allows it to be loop unrolled and
executed in parallel.

Using a parameter makes the lookups slower. Worth testing. Life changes.

--
 Simon Riggs                   http://www.2ndQuadrant.com/
 PostgreSQL Development, 24x7 Support, Training & Services
On Wed, Apr 4, 2012 at 9:05 PM, Robert Haas <robertmhaas@gmail.com> wrote:

> Yes, the SLRU is thrashing heavily.  In this configuration, there are
> 32 CLOG buffers.  I just added an elog() every time we replace a
> buffer.  Here's a sample of how often that's firing, by second, on
> this test (pgbench with 32 clients):

Interesting. You've spoken at length how this hardly ever happens and
so this can't have any performance effect. That was the reason for
kicking out my patch addressing clog history, wasn't it?

Why is this pgbench run accessing so much unhinted data that is > 1
million transactions old? Do you believe those numbers? Looks weird.

Perhaps we should retest the clog history patch?

--
 Simon Riggs                   http://www.2ndQuadrant.com/
 PostgreSQL Development, 24x7 Support, Training & Services
On Wed, Apr 4, 2012 at 9:34 PM, Simon Riggs <simon@2ndquadrant.com> wrote:
> Why is this pgbench run accessing so much unhinted data that is > 1
> million transactions old? Do you believe those numbers? Looks weird.

I think this is in the nature of the workload pgbench does. Because
the updates are uniformly distributed, not concentrated 90% in 10% of
the buffers like most real-world systems, (and I believe pgbench only
does index lookups) the second time a tuple is looked at is going to
average N/2 transactions later where N is the number of tuples. Given
a scale factor of 300 that's 15 million transactions.

More aggressively hinting other tuples on the page that we have no
other business looking at might help, though that would require extra
finess to avoid causing extra clog reads. Presumably you would only
want to hint other tuples whose xids were in clog pages that were
actually in memory currently.

--
greg
On Wed, Apr 4, 2012 at 9:05 PM, Robert Haas <robertmhaas@gmail.com> wrote:
> Here's a sample of how often that's firing, by second, on
> this test (pgbench with 32 clients):
>
>   4191 19:54:21
>   4540 19:54:22

Hm, so if that's evenly spread out that's 1/4ms between slru flushes
and if each flush takes 5-10ms that's going to be 20-40 flushes
concurrently going on.

I'm curious to see a distribution of how many flushes are already
concurrently happening whenever a flush is initiated. This should be
possible to get by counting the number of pages that were skipped in
your patch as it went through the slru.

Also, oops, sorry. I mixed up the 32 clog buffers with the 16 files
that the slru.c remembers during a flush to fsync later. I still don't
understand why it doesn't just allocate enough space to remember to
fsync the worst case which is one file per clog buffer though which
would only be twice as many.

--
greg
Greg Stark <stark@mit.edu> writes:
> On Wed, Apr 4, 2012 at 9:34 PM, Simon Riggs <simon@2ndquadrant.com> wrote:
>> Why is this pgbench run accessing so much unhinted data that is > 1
>> million transactions old? Do you believe those numbers? Looks weird.

> I think this is in the nature of the workload pgbench does. Because
> the updates are uniformly distributed, not concentrated 90% in 10% of
> the buffers like most real-world systems, (and I believe pgbench only
> does index lookups) the second time a tuple is looked at is going to
> average N/2 transactions later where N is the number of tuples.

That's a good point, and it makes me wonder whether pgbench is the right
test case to be micro-optimizing around.  It would be a good idea to at
least compare the numbers for something with more locality of reference.
        regards, tom lane
On 4/4/12 4:02 PM, Tom Lane wrote:
> Greg Stark <stark@mit.edu> writes:
>> On Wed, Apr 4, 2012 at 9:34 PM, Simon Riggs <simon@2ndquadrant.com> wrote:
>>> Why is this pgbench run accessing so much unhinted data that is > 1
>>> million transactions old? Do you believe those numbers? Looks weird.
>
>> I think this is in the nature of the workload pgbench does. Because
>> the updates are uniformly distributed, not concentrated 90% in 10% of
>> the buffers like most real-world systems, (and I believe pgbench only
>> does index lookups) the second time a tuple is looked at is going to
>> average N/2 transactions later where N is the number of tuples.
>
> That's a good point, and it makes me wonder whether pgbench is the right
> test case to be micro-optimizing around.  It would be a good idea to at
> least compare the numbers for something with more locality of reference.

Jignesh, would DVDstore help for this?


--
Josh Berkus
PostgreSQL Experts Inc.
http://pgexperts.com
On Wed, Apr 4, 2012 at 4:23 PM, Simon Riggs <simon@2ndquadrant.com> wrote:
> Measurement?
>
> Sounds believable, I just want to make sure we have measured things.

Yes, I measured things.  I didn't post the results because they're
almost identical to the previous set of results which I already
posted.  That is, I wrote the patch; I ran it through the
instrumentation framework; the same long waits with the same set of
file/line combinations were still present.  Then I wrote the patch
that is attached to the OP, and also tested that, and those long waits
went away completely.

> I believe that, but if all buffers are I/O busy we should avoid
> waiting on a write I/O if possible.

I thought about that, but I don't see that there's any point in
further complicating the algorithm.  The current patch eliminates ALL
the long waits present in this code path, which means that the
situation where every CLOG buffer is I/O-busy at the same time either
never happens, or never causes any significant stalls.  I think it's a
bad idea to make this any more complicated than is necessary to do the
right thing in real-world cases.

> That seems much smarter. I'm thinking this should be back patched
> because it appears to be fairly major, so I'm asking for some more
> certainty that every thing you say here is valid. No doubt much of it
> is valid, but that's not enough.

Yeah, I was thinking about that.  What we're doing right now seems
pretty stupid, so maybe it's worth considering a back-patch.  OTOH,
I'm usually loathe to tinker with performance in stable releases.
I'll defer to the opinions of others on this point.

>> Applying this patch does in fact eliminate the stalls.
>
> I'd like to see that measured from a user perspective. It would be
> good to see the response time distribution for run with and without
> the patch.

My feeling is that you're not going to see very much difference in a
latency-by-second graph, because XLogInsert is responsible for lots
and lots of huge stalls also.  That's going to mask the impact of
fixing this problem.  However, it's not much work to run the test, so
I'll do that.

>> 2. I think we might want to revisit Simon's idea of background-writing
>> SLRU pages.
>
> Agreed. No longer anywhere near as important. I'll take a little
> credit for identifying the right bottleneck, since you weren't a
> believer before.

I don't think I ever said it was a bad idea; I just couldn't measure
any benefit.  I think now we know why, or at least have a clue; and
maybe some ideas about how to measure it better.

--
Robert Haas
EnterpriseDB: http://www.enterprisedb.com
The Enterprise PostgreSQL Company
On Wed, Apr 4, 2012 at 4:34 PM, Simon Riggs <simon@2ndquadrant.com> wrote:
> Interesting. You've spoken at length how this hardly ever happens and
> so this can't have any performance effect. That was the reason for
> kicking out my patch addressing clog history, wasn't it?

Uh, no, the reason for kicking out your clog history patch was that it
caused throughput to drop by a factor of 3 on a pgbench test at scale
factor 300.  I assume you've got a bug there somewhere, or maybe
there's some other effect that hasn't been quantified.

> Why is this pgbench run accessing so much unhinted data that is > 1
> million transactions old? Do you believe those numbers? Looks weird.

Seems pretty normal to me, for the reasons Greg Stark states.

--
Robert Haas
EnterpriseDB: http://www.enterprisedb.com
The Enterprise PostgreSQL Company
On Wed, Apr 4, 2012 at 7:02 PM, Tom Lane <tgl@sss.pgh.pa.us> wrote:
> Greg Stark <stark@mit.edu> writes:
>> On Wed, Apr 4, 2012 at 9:34 PM, Simon Riggs <simon@2ndquadrant.com> wrote:
>>> Why is this pgbench run accessing so much unhinted data that is > 1
>>> million transactions old? Do you believe those numbers? Looks weird.
>
>> I think this is in the nature of the workload pgbench does. Because
>> the updates are uniformly distributed, not concentrated 90% in 10% of
>> the buffers like most real-world systems, (and I believe pgbench only
>> does index lookups) the second time a tuple is looked at is going to
>> average N/2 transactions later where N is the number of tuples.
>
> That's a good point, and it makes me wonder whether pgbench is the right
> test case to be micro-optimizing around.  It would be a good idea to at
> least compare the numbers for something with more locality of reference.

I agree that there are other benchmarks that are worth optimizing for,
but this particular change is more in the nature of a bug fix.  The
current code is waiting for an I/O on buffer A when there's no real
need and we're going afterwards proceed to NOT select buffer A anyway
(or at least, with no more probability than that it will select any
other buffer).

I don't think we're micro-optimizing, either.  I don't consider
avoiding a 10-second cessation of all database activity to be a
micro-optimization even on a somewhat artificial benchmark.

One other thing to think about is that pgbench at scale factor 300 is
not exactly a large working set.  You could easily imagine a
real-world data set that is more the size of scale factor 3000, and
10% of it is hot, and you'd have pretty much the same problem.  The
indexes would be a little deeper and so on, but I see no reason why
you wouldn't be able to reproduce this effect with the right test
set-up.  I am sure there will come a point when we've learned as much
as we can from pgbench and must graduate to more complex benchmarks to
have any hope of finding problems worth fixing, but we are surely
still quite a long ways off from that happy day.

--
Robert Haas
EnterpriseDB: http://www.enterprisedb.com
The Enterprise PostgreSQL Company
On Thu, Apr 5, 2012 at 1:23 AM, Robert Haas <robertmhaas@gmail.com> wrote:

> I don't think we're micro-optimizing, either.  I don't consider
> avoiding a 10-second cessation of all database activity to be a
> micro-optimization even on a somewhat artificial benchmark.

Robert is not skewing the SLRU mechanism towards this case, he is
simply fixing something so gross that "bug" is the only word for it,
and that shows up clearly on this test. I'm happy that the fix
proposed has general utility without negative impact on other
workloads.

In general terms, I agree we shouldn't rely on pgbench as a general
workload, nor should we solely tune Postgres for throughput without
regard to response time. But that point is not relevant to this
specific issue.

--
 Simon Riggs                   http://www.2ndQuadrant.com/
 PostgreSQL Development, 24x7 Support, Training & Services
On Thu, Apr 5, 2012 at 12:25 AM, Robert Haas <robertmhaas@gmail.com> wrote:

>> That seems much smarter. I'm thinking this should be back patched
>> because it appears to be fairly major, so I'm asking for some more
>> certainty that every thing you say here is valid. No doubt much of it
>> is valid, but that's not enough.
>
> Yeah, I was thinking about that.  What we're doing right now seems
> pretty stupid, so maybe it's worth considering a back-patch.  OTOH,
> I'm usually loathe to tinker with performance in stable releases.
> I'll defer to the opinions of others on this point.

I'm also loathe to back patch. But its not very often we find a
problem that causes all backends to wait behind a single I/O.

The wait-behind-I/O aspect is "OK" because that is what is designed to
happen. The unexpected bit is the point that the system *quickly*
switches around so that *all* backends choose to wait behind that same
I/O, which is mad.

There is no doubt that your I/Os are slow here and that the specific
test accentuates that, but neither of those things are rare.

If it was an optimiser bug that made something run in 10sec that
should have run in 10ms we fix it. So we fix this also.

--
 Simon Riggs                   http://www.2ndQuadrant.com/
 PostgreSQL Development, 24x7 Support, Training & Services
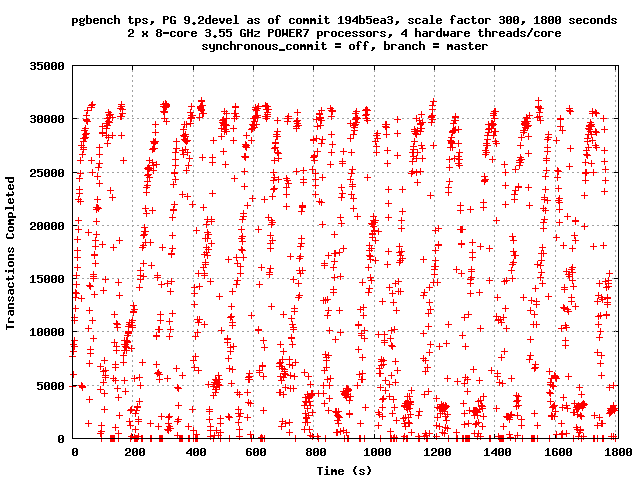
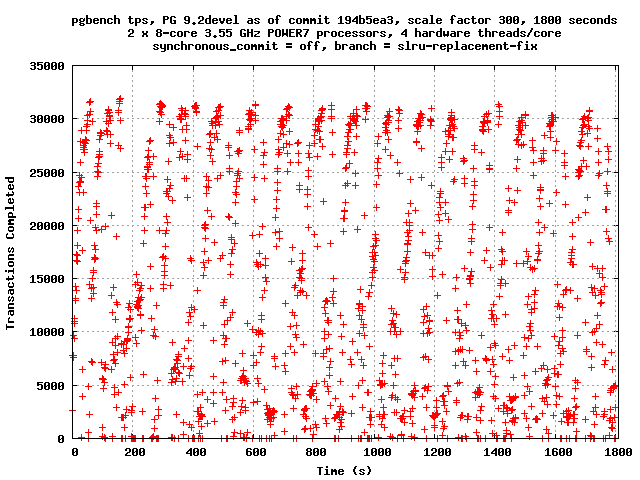
On Thu, Apr 5, 2012 at 5:41 AM, Simon Riggs <simon@2ndquadrant.com> wrote:
> I'm also loathe to back patch. But its not very often we find a
> problem that causes all backends to wait behind a single I/O.

You have a point.

Meanwhile, here are the benchmark results you requested.  I did half
hour runs with -l.  Here are the 90th-100th percentile latencies,
without patch and then with patch.

90 1668 1620
91 1747 1690
92 1845 1785
93 1953 1907
94 2064 2035
95 2176 2160
96 2300 2291
97 2461 2451
98 2739 2710
99 3542 3495
100 12955473 19072385

Overall tps, first without and then with patch:

tps = 14546.644712 (including connections establishing)
tps = 14550.515173 (including connections establishing)

TPS graphs by second attached.

--
Robert Haas
EnterpriseDB: http://www.enterprisedb.com
The Enterprise PostgreSQL Company
Attachment
On Thu, Apr 5, 2012 at 12:56 PM, Robert Haas <robertmhaas@gmail.com> wrote:

> Overall tps, first without and then with patch:
>
> tps = 14546.644712 (including connections establishing)
> tps = 14550.515173 (including connections establishing)
>
> TPS graphs by second attached.

Again, I'm not that fussed about throughput because it just hides the
detail. I am concerned about the distribution of response times, so
I'd like to see the numbers about that if you don't mind. i.e. does
the patch remove long waits.

--
 Simon Riggs                   http://www.2ndQuadrant.com/
 PostgreSQL Development, 24x7 Support, Training & Services
On Thu, Apr 5, 2012 at 8:30 AM, Simon Riggs <simon@2ndquadrant.com> wrote:
> On Thu, Apr 5, 2012 at 12:56 PM, Robert Haas <robertmhaas@gmail.com> wrote:
>
>> Overall tps, first without and then with patch:
>>
>> tps = 14546.644712 (including connections establishing)
>> tps = 14550.515173 (including connections establishing)
>>
>> TPS graphs by second attached.
>
> Again, I'm not that fussed about throughput because it just hides the
> detail. I am concerned about the distribution of response times, so
> I'd like to see the numbers about that if you don't mind. i.e. does
> the patch remove long waits.

Sorry, I don't understand specifically what you're looking for.  I
provided latency percentiles in the last email; what else do you want?

--
Robert Haas
EnterpriseDB: http://www.enterprisedb.com
The Enterprise PostgreSQL Company
On Thu, Apr 5, 2012 at 2:24 PM, Robert Haas <robertmhaas@gmail.com> wrote:
> Sorry, I don't understand specifically what you're looking for.  I
> provided latency percentiles in the last email; what else do you want?

I think he wants how many waits were there that were between 0 and 1s
how many between 1s and 2s, etc. Mathematically it's equivalent but I
also have trouble visualizing just how much improvement is represented
by 90th percentile dropping from 1688 to 1620 (ms?)


--
greg
On Thu, Apr 5, 2012 at 9:29 AM, Greg Stark <stark@mit.edu> wrote:
> On Thu, Apr 5, 2012 at 2:24 PM, Robert Haas <robertmhaas@gmail.com> wrote:
>> Sorry, I don't understand specifically what you're looking for.  I
>> provided latency percentiles in the last email; what else do you want?
>
> I think he wants how many waits were there that were between 0 and 1s
> how many between 1s and 2s, etc. Mathematically it's equivalent but I
> also have trouble visualizing just how much improvement is represented
> by 90th percentile dropping from 1688 to 1620 (ms?)

Yes, milliseconds.  Sorry for leaving out that detail.  I've run these
scripts so many times that my eyes are crossing.  Here are the
latencies, bucketized by seconds, first for master and then for the
patch, on the same test run as before:

0 26179411
1 3642
2 660
3 374
4 166
5 356
6 41
7 8
8 56
9 0
10 0
11 21
12 11

0 26199130
1 4840
2 267
3 290
4 40
5 77
6 36
7 3
8 2
9 33
10 37
11 2
12 1
13 4
14 5
15 3
16 0
17 1
18 1
19 1

I'm not sure I find those numbers all that helpful, but there they
are.  There are a couple of outliers beyond 12 s on the patched run,
but I wouldn't read anything into that; the absolute worst values
bounce around a lot from test to test.  However, note that every
bucket between 2s and 8s improves, sometimes dramatically.  It's worth
keeping in mind here that the system is under extreme I/O strain on
this test, and the kernel responds by forcing user processes to sleep
when they try to do I/O.  So the long stalls that this patch
eliminates are bound are actually allowing the I/O queues to drain out
a little, and without that rest time, you're bound to see more I/O
stalls elsewhere.  It's also worth keeping in mind that this is an
extremely write-intensive benchmark, and that Linux 3.2 changed
behavior in this area quite a bit.  It's not impossible that on an
older kernel, the type of I/O thrashing that happens when too many
backends are blocked by dirty_ratio or dirty_bytes might actually make
this change a regression compared to letting those backends block on a
semaphore, which may be a reason to NOT back-patch this change.  I
think that the patch is fixing a fairly obvious defect in our
algorithm, but that doesn't mean that there's no set of circumstances
under which it could backfire, especially when deployed onto three or
four year old kernels.

--
Robert Haas
EnterpriseDB: http://www.enterprisedb.com
The Enterprise PostgreSQL Company
On Thu, Apr 5, 2012 at 7:05 AM, Robert Haas <robertmhaas@gmail.com> wrote:
> On Thu, Apr 5, 2012 at 9:29 AM, Greg Stark <stark@mit.edu> wrote:
>> On Thu, Apr 5, 2012 at 2:24 PM, Robert Haas <robertmhaas@gmail.com> wrote:
>>> Sorry, I don't understand specifically what you're looking for.  I
>>> provided latency percentiles in the last email; what else do you want?
>>
>> I think he wants how many waits were there that were between 0 and 1s
>> how many between 1s and 2s, etc. Mathematically it's equivalent but I
>> also have trouble visualizing just how much improvement is represented
>> by 90th percentile dropping from 1688 to 1620 (ms?)
>
> Yes, milliseconds.  Sorry for leaving out that detail.  I've run these
> scripts so many times that my eyes are crossing.  Here are the
> latencies, bucketized by seconds, first for master and then for the
> patch, on the same test run as before:
>
> 0 26179411
> 1 3642
> 2 660
> 3 374
> 4 166
> 5 356
> 6 41
> 7 8
> 8 56
> 9 0
> 10 0
> 11 21
> 12 11
>
> 0 26199130
> 1 4840
> 2 267
> 3 290
> 4 40
> 5 77
> 6 36
> 7 3
> 8 2
> 9 33
> 10 37
> 11 2
> 12 1
> 13 4
> 14 5
> 15 3
> 16 0
> 17 1
> 18 1
> 19 1
>
> I'm not sure I find those numbers all that helpful, but there they
> are.  There are a couple of outliers beyond 12 s on the patched run,
> but I wouldn't read anything into that; the absolute worst values
> bounce around a lot from test to test.  However, note that every
> bucket between 2s and 8s improves, sometimes dramatically.


However, if it "improved" a bucket by pushing the things out of it
into a higher bucket, that is not really an improvement.  At 8 seconds
*or higher*, for example, it goes from 88 things in master to 90
things in the patch.

Maybe something like a Kaplan-Meier survival curve analysis would be
the way to go (where a long transaction "survival" is bad).  But
probably overkill.

What were full_page_writes and wal_buffers set to for these runs?


> It's worth
> keeping in mind here that the system is under extreme I/O strain on
> this test, and the kernel responds by forcing user processes to sleep
> when they try to do I/O.

Should the tests be dialed back a bit so that the I/O strain is less
extreme?  Analysis is probably best done right after where the
scalability knee is, not long after that point where the server has
already collapsed to a quivering mass.

Cheers,

Jeff
On Thu, Apr 5, 2012 at 3:05 PM, Robert Haas <robertmhaas@gmail.com> wrote:
> I'm not sure I find those numbers all that helpful, but there they
> are.  There are a couple of outliers beyond 12 s on the patched run,
> but I wouldn't read anything into that; the absolute worst values
> bounce around a lot from test to test.  However, note that every
> bucket between 2s and 8s improves, sometimes dramatically.

The numbers seem pretty compelling to me. They seem to indicate that
you've killed one of the big source of stalls but that there are more
lurking including at least one which causes small number of small
stalls.

The only fear I have is that I'm still wondering what happens to your
code when *all* the buffers become blocked on I/O. Can you catch
whether this ever occurred in your test and explain what should happen
in that case?

--
greg
On Thu, Apr 5, 2012 at 12:30 PM, Jeff Janes <jeff.janes@gmail.com> wrote:
>> I'm not sure I find those numbers all that helpful, but there they
>> are.  There are a couple of outliers beyond 12 s on the patched run,
>> but I wouldn't read anything into that; the absolute worst values
>> bounce around a lot from test to test.  However, note that every
>> bucket between 2s and 8s improves, sometimes dramatically.
>
> However, if it "improved" a bucket by pushing the things out of it
> into a higher bucket, that is not really an improvement.  At 8 seconds
> *or higher*, for example, it goes from 88 things in master to 90
> things in the patch.
>
> Maybe something like a Kaplan-Meier survival curve analysis would be
> the way to go (where a long transaction "survival" is bad).  But
> probably overkill.

I think we are well into the realm of overkill here.  At ten thousand
feet, this patch is preventing us from having every backend wait on an
I/O that only one of those backends actually cares about.  While it
possible that, in some set of circumstances, a bizarre behavior of
that type could happen to work out well, we are not in the business of
coding stupid algorithms and hoping that a meteor hits us and makes
them work out to be wins.  We should not be too afraid of changing
behavior that is obviously wrong, and this is an example of that.
I've presented extensive data showing that, in fact, this patch
eliminates exactly the behavior that it is intended to eliminate
without causing regressions elsewhere.

The fact that there is some criteria that you can apply to the results
of those tests where the patch doesn't win is unsurprising.  If you
slice data that contains a large amount of random noise in enough
different ways, one of them will almost certainly show a regression;
that's what "noise" is.  Yes, it's true that if you look at the number
of transactions that stall for >= 8s, the patch appears to be a very
slight loss.  But first, this is only one trial.  A second run would
produce different numbers that might be better or worse.  And second,
if you picked >= 7s, then the run with the patch would win by about as
much as it loses in the >= 8 s test.   If you pick >= 11 s, it wins by
a lot.

> What were full_page_writes and wal_buffers set to for these runs?

on, 16MB.

>> It's worth
>> keeping in mind here that the system is under extreme I/O strain on
>> this test, and the kernel responds by forcing user processes to sleep
>> when they try to do I/O.
>
> Should the tests be dialed back a bit so that the I/O strain is less
> extreme?  Analysis is probably best done right after where the
> scalability knee is, not long after that point where the server has
> already collapsed to a quivering mass.

I think that would be missing the point, which IMV is to avoid having
a server collapse into a quivering mass just because we apply a heavy
write workload.  Actually, I think we're doing pretty well with that
up to about 16-24 concurrent writers, and even going somewhat beyond
that we're not really slowing down so much as just not scaling.  For
many people that's not a problem because they don't have that much
write workload, but if someone does have that much write workload, we
can hardly tell them: well, you know, if you don't apply so much load
to the database, it will perform better.  No kidding.  Anybody can
write a database that performs well when it's totally unloaded.  The
trick is to write one that scales as far as possible and degrades as
gracefully as possible when it can no longer scale.

--
Robert Haas
EnterpriseDB: http://www.enterprisedb.com
The Enterprise PostgreSQL Company
On Thu, Apr 5, 2012 at 12:44 PM, Greg Stark <stark@mit.edu> wrote:
> On Thu, Apr 5, 2012 at 3:05 PM, Robert Haas <robertmhaas@gmail.com> wrote:
>> I'm not sure I find those numbers all that helpful, but there they
>> are.  There are a couple of outliers beyond 12 s on the patched run,
>> but I wouldn't read anything into that; the absolute worst values
>> bounce around a lot from test to test.  However, note that every
>> bucket between 2s and 8s improves, sometimes dramatically.
>
> The numbers seem pretty compelling to me.

Thanks.

> They seem to indicate that
> you've killed one of the big source of stalls but that there are more
> lurking including at least one which causes small number of small
> stalls.

The data in my OP identifies the other things that can cause stalls >=
100 ms with considerable specificity.

> The only fear I have is that I'm still wondering what happens to your
> code when *all* the buffers become blocked on I/O. Can you catch
> whether this ever occurred in your test and explain what should happen
> in that case?

If all the buffers are I/O-busy, it just falls back to picking the
least-recently-used buffer, which is a reasonable heuristic, since
that I/O is likely to be done first.  However, when I ran this with
all the debugging instrumentation enabled, it reported no waits in
slru.c consistent with that situation ever having occurred.  So if
something like that did happen during the test run, it produced a wait
of less than 100 ms, but I think it's more likely that it never
happened at all.

I think part of the confusion here may relate to a previous discussion
about increasing the number of CLOG buffers.  During that discussion,
I postulated that increasing the number of CLOG buffers improved
performance because we could encounter a situation where every buffer
is I/O-busy, causing new backends that wanted to perform an I/O to
have to wait until some backend that had been doing an I/O finished
it.  It's now clear that I was totally wrong, because you don't need
to have every buffer busy before the next backend that needs a CLOG
page blocks on an I/O.  As soon as ONE backend blocks on a CLOG buffer
I/O, every other backend that needs to evict a page will pile up on
the same I/O.  I just assumed that we couldn't possibly be doing
anything that silly, but we are.

So here's my new theory: the real reason why increasing the number of
CLOG pages improved performance is because it caused dirty pages to
reach the tail of the LRU list less frequently.  It's particularly bad
if a page gets written and fsync'd but then someone still needs to
WRITE that page, so it gets pulled back in and written and fsync'd a
second time.  Such events are less likely with more buffers.  Of
course, increasing the number of buffers also decreases cache pressure
in general.  What's clear from these numbers as well is that there is
a tremendous amount of CLOG cache churn, and therefore we can infer
that most of those I/Os complete almost immediately - if they did not,
it would be impossible to replace 5000 CLOG buffers in a second no
matter how many backends you have.  It's the occasional I/Os that
don't completely almost immediately that are at issue here.

--
Robert Haas
EnterpriseDB: http://www.enterprisedb.com
The Enterprise PostgreSQL Company
On Wed, Apr 4, 2012 at 7:06 PM, Josh Berkus <josh@agliodbs.com> wrote:
> On 4/4/12 4:02 PM, Tom Lane wrote:
>> Greg Stark <stark@mit.edu> writes:
>>> On Wed, Apr 4, 2012 at 9:34 PM, Simon Riggs <simon@2ndquadrant.com> wrote:
>>>> Why is this pgbench run accessing so much unhinted data that is > 1
>>>> million transactions old? Do you believe those numbers? Looks weird.
>>
>>> I think this is in the nature of the workload pgbench does. Because
>>> the updates are uniformly distributed, not concentrated 90% in 10% of
>>> the buffers like most real-world systems, (and I believe pgbench only
>>> does index lookups) the second time a tuple is looked at is going to
>>> average N/2 transactions later where N is the number of tuples.
>>
>> That's a good point, and it makes me wonder whether pgbench is the right
>> test case to be micro-optimizing around.  It would be a good idea to at
>> least compare the numbers for something with more locality of reference.
>
> Jignesh, would DVDstore help for this?
>
>
> --
> Josh Berkus
> PostgreSQL Experts Inc.
> http://pgexperts.com

I will try this out next week.. I am scrounging for decent hardware
and I think I found one.. though I will get access to it on Monday.

The way you could do locality in DVDStore is do the build with say
10GB size but while running the actual run just mention the size as
1GB and that should get you the 10% active population scenario.


Regards,
Jignesh
Robert Haas <robertmhaas@gmail.com> writes:
> On reflection, it seems to me that the right fix here is to make
> SlruSelectLRUPage() to avoid selecting a page on which an I/O is
> already in progress.

This patch seems reasonably sane to me.  It's not intuitively obvious
that we should ignore I/O-busy pages, but your tests seem to prove
that that's a better algorithm.

However, I do have a couple of quibbles with the comments.  The first
para in the large block comment in SlruSelectLRUPage:
 * If we find any EMPTY slot, just select that one. Else locate the * least-recently-used slot to replace.

seems now to be quite out of touch with reality, and correcting it two
paras down doesn't really fix that.  Besides which, you ought to explain
*why* it's ignoring I/O-busy pages.  So perhaps merge the first and
third paras of the comment into something like
 * If we find any EMPTY slot, just select that one.  Else choose * a victim page to replace.  We normally take the
leastrecently * used valid page, but we will never take the slot containing * latest_page_number, even if it appears
leastrecently used. * Slots that are already I/O busy are never selected, either: * a read-busy slot will not be least
recentlyused once the read * finishes, while waiting behind someone else's write has been * shown to be less efficient
thanstarting another write.


Or maybe you have a better short description of why this is a good idea,
but there ought to be something here about it.

Also, as a matter of style, I think this comment ought to be inside the
"if" block not before it:
/* * All pages (except possibly the latest one) are I/O busy. We'll have * to wait for an I/O to complete and then
retry. We choose to wait * for the I/O on the least recently used slot, on the assumption that * it was likely
initiatedfirst of all the I/Os in progress and may * therefore finish first. */if (best_valid_delta < 0){
SimpleLruWaitIO(ctl,bestinvalidslot);    continue;}


I don't know about you, but I read a comment like this as asserting a
fact about the situation when control reaches where the comment is.
So it needs to be inside the "if".  (Analogy: if it were an actual
Assert(all-pages-are-IO-busy), it would have to be inside the if, no?)
        regards, tom lane
On Sun, Apr 8, 2012 at 12:53 PM, Tom Lane <tgl@sss.pgh.pa.us> wrote:
> However, I do have a couple of quibbles with the comments.

Good points.  I made some adjustments; see what you think.

--
Robert Haas
EnterpriseDB: http://www.enterprisedb.com
The Enterprise PostgreSQL Company