Thread: Big Performance drop of Exceptions in UDFs between V11.2 and 13.4
Big Performance drop of Exceptions in UDFs between V11.2 and 13.4
Hello all,
I think I have identified a major performance issue between V11.2 and 13.4 with respect to exception handling in UDFs. I have the following simplified query that pivots data and makes use of a UDF to convert data to a specific type, in this case, float:
select "iccqa_iccassmt_fk"
, Tilda.toFloat(MAX("iccqar_ans_val") filter (where "iccqar_ques_code"= 'DEPTH (CM)') ,null) as "iccqa_DEPTH_CM"
, Tilda.toFloat(MAX("iccqar_ans_val") filter (where "iccqar_ques_code"= 'LENGTH (CM)') ,null) as "iccqa_LENGTH_CM"
, Tilda.toFloat(MAX("iccqar_ans_val") filter (where "iccqar_ques_code"= 'WIDTH (CM)') ,null) as "iccqa_WIDTH_CM"
, Tilda.toFloat(MAX("iccqar_ans_val") filter (where "iccqar_ques_code"= 'DRAIN PRESENT') ,null) as "iccqa_DRAIN_PRESENT"
, Tilda.toFloat(MAX("iccqar_ans_val") filter (where "iccqar_ques_code"= 'MEASUREMENTS TAKEN') ,null) as "iccqa_MEASUREMENTS_TAKEN"
, Tilda.toFloat(MAX("iccqar_ans_val") filter (where "iccqar_ques_code"= 'SIGNS AND SYMPTOMS OF INFECTION') ,null) as "iccqa_SIGNS_AND_SYMPTOMS_OF_INFECTION"
from (
-- 'A pivoted view of ICC QA assessments'
select VNAHGEDW_FACTS.AssessmentICCQA_Raw."iccqar_iccassmt_fk" as "iccqa_iccassmt_fk" -- The key identifying an ICC assessment.
, VNAHGEDW_FACTS.AssessmentICCQA_Raw."iccqar_ques_code" as "iccqar_ques_code" -- The question long code from the meta-data.
, max(VNAHGEDW_FACTS.AssessmentICCQA_Raw."iccqar_ans_val") as "iccqar_ans_val" -- The official answer, if applicable) from the meta-data.
from VNAHGEDW_FACTS.AssessmentICCQA_Raw
where VNAHGEDW_FACTS.AssessmentICCQA_Raw."iccqar_ques_code" in ('DEPTH (CM)', 'LENGTH (CM)', 'WIDTH (CM)'
, 'DRAIN PRESENT', 'MEASUREMENTS TAKEN', 'SIGNS AND SYMPTOMS OF INFECTION'
) group by 1, 2
) T
group by 1
;
The UDF is simple as follows:
CREATE OR REPLACE FUNCTION TILDA.toFloat(str varchar, val real)
RETURNS real AS $$
BEGIN
RETURN case when str is null then val else str::real end;
EXCEPTION WHEN OTHERS THEN
RETURN val;
END;
$$ LANGUAGE plpgsql COST 1 IMMUTABLE;
It works as a coalesce but with a conversion. I think I have identified some large performance difference with the exception handling. It so happens that with the last 3 columns ('DRAIN PRESENT', 'MEASUREMENTS TAKEN' and 'SIGNS AND SYMPTOMS OF INFECTION'), the data is VERY dirty. There is a mix of 0/1, YES/NO, and other mistyped stuff. This means these 3 columns throw lots of exceptions in the UDF. To illustrate, I simply break this into 2 queries.
select "iccqa_iccassmt_fk"
, (Tilda.toFloat(MAX("iccqar_ans_val") filter (where "iccqar_ques_code"= 'DEPTH (CM)') ,null))::real as "iccqa_DEPTH_CM"
, (Tilda.toFloat(MAX("iccqar_ans_val") filter (where "iccqar_ques_code"= 'LENGTH (CM)') ,null))::real as "iccqa_LENGTH_CM"
, (Tilda.toFloat(MAX("iccqar_ans_val") filter (where "iccqar_ques_code"= 'WIDTH (CM)') ,null))::real as "iccqa_WIDTH_CM"
-- , (Tilda.toFloat(MAX("iccqar_ans_val") filter (where "iccqar_ques_code"= 'DRAIN PRESENT') ,null))::real as "iccqa_DRAIN_PRESENT"
-- , (Tilda.toFloat(MAX("iccqar_ans_val") filter (where "iccqar_ques_code"= 'MEASUREMENTS TAKEN') ,null))::real as "iccqa_MEASUREMENTS_TAKEN"
-- , (Tilda.toFloat(MAX("iccqar_ans_val") filter (where "iccqar_ques_code"= 'SIGNS AND SYMPTOMS OF INFECTION') ,null))::real as "iccqa_SIGNS_AND_SYMPTOMS_OF_INFECTION"
from (
-- 'A pivoted view of ICC QA assessments'
select VNAHGEDW_FACTS.AssessmentICCQA_Raw."iccqar_iccassmt_fk" as "iccqa_iccassmt_fk" -- The key identifying an ICC assessment.
, VNAHGEDW_FACTS.AssessmentICCQA_Raw."iccqar_ques_code" as "iccqar_ques_code" -- The question long code from the meta-data.
, max(VNAHGEDW_FACTS.AssessmentICCQA_Raw."iccqar_ans_val") as "iccqar_ans_val" -- The official answer, if applicable) from the meta-data.
from VNAHGEDW_FACTS.AssessmentICCQA_Raw
where VNAHGEDW_FACTS.AssessmentICCQA_Raw."iccqar_ques_code" in ('DEPTH (CM)', 'LENGTH (CM)', 'WIDTH (CM)'
, 'DRAIN PRESENT', 'MEASUREMENTS TAKEN', 'SIGNS AND SYMPTOMS OF INFECTION'
)
group by 1, 2
) T
group by 1
;
The performance is as expected.
HashAggregate (cost=448463.70..448467.20 rows=200 width=16) (actual time=6760.797..9585.397 rows=677899 loops=1)
Group Key: assessmenticcqa_raw.iccqar_iccassmt_fk
Batches: 1 Memory Usage: 147489kB
Buffers: shared hit=158815
-> HashAggregate (cost=405997.87..417322.09 rows=1132422 width=56) (actual time=4576.514..5460.770 rows=2374628 loops=1)
Group Key: assessmenticcqa_raw.iccqar_iccassmt_fk, assessmenticcqa_raw.iccqar_ques_code
Batches: 1 Memory Usage: 368657kB
Buffers: shared hit=158815
-> Seq Scan on assessmenticcqa_raw (cost=0.00..388224.53 rows=2369779 width=38) (actual time=0.033..3298.544 rows=2374628 loops=1)
Filter: ((iccqar_ques_code)::text = ANY ('{"DEPTH (CM)","LENGTH (CM)","WIDTH (CM)","DRAIN PRESENT","MEASUREMENTS TAKEN","SIGNS AND SYMPTOMS OF INFECTION"}'::text[]))
Rows Removed by Filter: 10734488
Buffers: shared hit=158815
Planning:
Buffers: shared hit=3
Planning Time: 0.198 ms
Execution Time: 9678.120 ms
However, once we switch with the three “bad” columns, the results fall apart.
select "iccqa_iccassmt_fk"
-- , (Tilda.toFloat(MAX("iccqar_ans_val") filter (where "iccqar_ques_code"= 'DEPTH (CM)') ,null))::real as "iccqa_DEPTH_CM"
-- , (Tilda.toFloat(MAX("iccqar_ans_val") filter (where "iccqar_ques_code"= 'LENGTH (CM)') ,null))::real as "iccqa_LENGTH_CM"
-- , (Tilda.toFloat(MAX("iccqar_ans_val") filter (where "iccqar_ques_code"= 'WIDTH (CM)') ,null))::real as "iccqa_WIDTH_CM"
, (Tilda.toFloat(MAX("iccqar_ans_val") filter (where "iccqar_ques_code"= 'DRAIN PRESENT') ,null))::real as "iccqa_DRAIN_PRESENT"
, (Tilda.toFloat(MAX("iccqar_ans_val") filter (where "iccqar_ques_code"= 'MEASUREMENTS TAKEN') ,null))::real as "iccqa_MEASUREMENTS_TAKEN"
, (Tilda.toFloat(MAX("iccqar_ans_val") filter (where "iccqar_ques_code"= 'SIGNS AND SYMPTOMS OF INFECTION') ,null))::real as "iccqa_SIGNS_AND_SYMPTOMS_OF_INFECTION"
from (
-- 'A pivoted view of ICC QA assessments'
select VNAHGEDW_FACTS.AssessmentICCQA_Raw."iccqar_iccassmt_fk" as "iccqa_iccassmt_fk" -- The key identifying an ICC assessment.
, VNAHGEDW_FACTS.AssessmentICCQA_Raw."iccqar_ques_code" as "iccqar_ques_code" -- The question long code from the meta-data.
, max(VNAHGEDW_FACTS.AssessmentICCQA_Raw."iccqar_ans_val") as "iccqar_ans_val" -- The official answer, if applicable) from the meta-data.
from VNAHGEDW_FACTS.AssessmentICCQA_Raw
where VNAHGEDW_FACTS.AssessmentICCQA_Raw."iccqar_ques_code" in ('DEPTH (CM)', 'LENGTH (CM)', 'WIDTH (CM)'
, 'DRAIN PRESENT', 'MEASUREMENTS TAKEN', 'SIGNS AND SYMPTOMS OF INFECTION'
)
group by 1, 2
) T
group by 1
;
The performance falls apart. It is a huge performance difference from ~10s to ~11mn and the only difference that I can think of is that the data is dirty which causes the exception path to be taken. The explain is:
HashAggregate (cost=448463.70..448467.20 rows=200 width=16) (actual time=6672.921..696753.080 rows=677899 loops=1)
Group Key: assessmenticcqa_raw.iccqar_iccassmt_fk
Batches: 1 Memory Usage: 131105kB
Buffers: shared hit=158815
-> HashAggregate (cost=405997.87..417322.09 rows=1132422 width=56) (actual time=4574.918..5446.022 rows=2374628 loops=1)
Group Key: assessmenticcqa_raw.iccqar_iccassmt_fk, assessmenticcqa_raw.iccqar_ques_code
Batches: 1 Memory Usage: 368657kB
Buffers: shared hit=158815
-> Seq Scan on assessmenticcqa_raw (cost=0.00..388224.53 rows=2369779 width=38) (actual time=0.032..3300.616 rows=2374628 loops=1)
Filter: ((iccqar_ques_code)::text = ANY ('{"DEPTH (CM)","LENGTH (CM)","WIDTH (CM)","DRAIN PRESENT","MEASUREMENTS TAKEN","SIGNS AND SYMPTOMS OF INFECTION"}'::text[]))
Rows Removed by Filter: 10734488
Buffers: shared hit=158815
Planning:
Buffers: shared hit=3
Planning Time: 0.201 ms
Execution Time: 696868.845 ms
Now, on V11.2, the explain is:
HashAggregate (cost=492171.36..492174.86 rows=200 width=16) (actual time=19322.522..50556.738 rows=743723 loops=1)
Group Key: assessmenticcqa_raw.iccqar_iccassmt_fk
Buffers: shared hit=11 read=174155 dirtied=13
-> HashAggregate (cost=445458.43..457915.21 rows=1245678 width=56) (actual time=16260.015..17575.088 rows=2601088 loops=1)
Group Key: assessmenticcqa_raw.iccqar_iccassmt_fk, assessmenticcqa_raw.iccqar_ques_code
Buffers: shared read=174155 dirtied=13
-> Seq Scan on assessmenticcqa_raw (cost=0.00..425803.93 rows=2620600 width=38) (actual time=0.126..14425.239 rows=2601088 loops=1)
Filter: ((iccqar_ques_code)::text = ANY ('{"DEPTH (CM)","LENGTH (CM)","WIDTH (CM)","DRAIN PRESENT","MEASUREMENTS TAKEN","SIGNS AND SYMPTOMS OF INFECTION"}'::text[]))
Rows Removed by Filter: 11778360
Buffers: shared read=174155 dirtied=13
Planning Time: 36.121 ms
Execution Time: 50730.255 ms
So, we are seeing two issues:
- I think exception handling is significantly slower between V11.2 and v13.4. I see almost a 14x difference from 50s to 700s.
- Comparing the two queries on V11.2, the difference is 13s vs 50s. So even on V11.2, the exception handling adds a significant overhead which I was not expecting.
I’ll be happy to update my test cases and share additional info if needed.
Thank you,
Laurent Hasson.
RE: Big Performance drop of Exceptions in UDFs between V11.2 and 13.4
OK… I apologize for the long email before. Right after I sent it, I thought of a much simpler use-case to illustrate the issue which doesn’t depend on any special data I have access o and complex pivoting. It’s as raw as I can make it.
I create a table with 1M rows and 2 columns. Column “a” is a random string, while column “b” is a random integer as a string. Then I use a UDF that converts strings to floats and handles an exception if the incoming string is not parsable as a float. Then I do a simple select of each column. In the “a” case, the UDF throws and catches lots of exceptions. In the “b” case, the conversion is clean and exceptions are not thrown.
create table sampletest (a varchar, b varchar);
insert into sampletest (a, b)
select substr(md5(random()::text), 0, 15), (100000000*random())::integer::varchar
from generate_series(1,1000000);
CREATE OR REPLACE FUNCTION toFloat(str varchar, val real)
RETURNS real AS $$
BEGIN
RETURN case when str is null then val else str::real end;
EXCEPTION WHEN OTHERS THEN
RETURN val;
END;
$$ LANGUAGE plpgsql COST 1 IMMUTABLE;
select MAX(toFloat(a, null)) as "a" from sampletest;
select MAX(toFloat(b, null)) as "b" from sampletest;
On purpose, I am doing a max(toFloat) instead of toFloat(max) to exercise the UDF 1M times.
V13.4 “a” scenario (exceptions)
-------------------------------------------------------------
Aggregate (cost=14778.40..14778.41 rows=1 width=4) (actual time=774098.537..774098.538 rows=1 loops=1)
Buffers: shared hit=6373
-> Seq Scan on sampletest (cost=0.00..11975.60 rows=560560 width=32) (actual time=0.011..285.458 rows=1000000 loops=1)
Buffers: shared hit=6370
Planning Time: 0.066 ms
Execution Time: 774,098.563 ms
V13.4 “b” scenario (no exceptions)
-------------------------------------------------------------
Aggregate (cost=14778.40..14778.41 rows=1 width=4) (actual time=1510.200..1510.201 rows=1 loops=1)
Buffers: shared hit=6385
-> Seq Scan on sampletest (cost=0.00..11975.60 rows=560560 width=32) (actual time=0.024..115.196 rows=1000000 loops=1)
Buffers: shared hit=6370
Planning:
Buffers: shared hit=26
Planning Time: 0.361 ms
Execution Time: 1,530.659 ms
V11.2 “a” scenario (exceptions)
-------------------------------------------------------------
Aggregate (cost=21658.00..21658.01 rows=1 width=4) (actual time=26528.286..26528.286 rows=1 loops=1)
Buffers: shared hit=6393
-> Seq Scan on sampletest (cost=0.00..16562.00 rows=1019200 width=15) (actual time=0.037..190.633 rows=1000000 loops=1)
Buffers: shared hit=6370
Planning Time: 1.182 ms
Execution Time: 26,530.492 ms
V11.2 “b” scenario (no exceptions)
-------------------------------------------------------------
Aggregate (cost=21658.00..21658.01 rows=1 width=4) (actual time=1856.116..1856.116 rows=1 loops=1)
Buffers: shared hit=6370
-> Seq Scan on sampletest (cost=0.00..16562.00 rows=1019200 width=8) (actual time=0.014..88.152 rows=1000000 loops=1)
Buffers: shared hit=6370
Planning Time: 0.098 ms
Execution Time: 1,856.152 ms
Summary:
- Scenario V11.2/a: 26.6s
- Scenario V11.2/b: 1.9s
- Scenario V13.4/a: 774.1s
- Scenario V13.4/b: 1.5s
Conclusion:
- The no-exception scenario performs 20% better on 13.4 vs 11.2 (nice for a straight scan!)
- On 11.2, exceptions add an overhead of over 14x (1.9s vs 26.6s). I did not expect exceptions to add such a large overhead. Why is that?
- Between 11.2 and 13.4, the no-exceptions scenario “b” performs 30x slower (26.6s vs 774.1s).
Thank you!
Laurent Hasson.
From: ldh@laurent-hasson.com <ldh@laurent-hasson.com>
Sent: Saturday, August 21, 2021 03:57
To: pgsql-performance@postgresql.org
Subject: Big Performance drop of Exceptions in UDFs between V11.2 and 13.4
Hello all,
I think I have identified a major performance issue between V11.2 and 13.4 with respect to exception handling in UDFs. I have the following simplified query that pivots data and makes use of a UDF to convert data to a specific type, in this case, float:
select "iccqa_iccassmt_fk"
, Tilda.toFloat(MAX("iccqar_ans_val") filter (where "iccqar_ques_code"= 'DEPTH (CM)') ,null) as "iccqa_DEPTH_CM"
, Tilda.toFloat(MAX("iccqar_ans_val") filter (where "iccqar_ques_code"= 'LENGTH (CM)') ,null) as "iccqa_LENGTH_CM"
, Tilda.toFloat(MAX("iccqar_ans_val") filter (where "iccqar_ques_code"= 'WIDTH (CM)') ,null) as "iccqa_WIDTH_CM"
, Tilda.toFloat(MAX("iccqar_ans_val") filter (where "iccqar_ques_code"= 'DRAIN PRESENT') ,null) as "iccqa_DRAIN_PRESENT"
, Tilda.toFloat(MAX("iccqar_ans_val") filter (where "iccqar_ques_code"= 'MEASUREMENTS TAKEN') ,null) as "iccqa_MEASUREMENTS_TAKEN"
, Tilda.toFloat(MAX("iccqar_ans_val") filter (where "iccqar_ques_code"= 'SIGNS AND SYMPTOMS OF INFECTION') ,null) as "iccqa_SIGNS_AND_SYMPTOMS_OF_INFECTION"
from (
-- 'A pivoted view of ICC QA assessments'
select VNAHGEDW_FACTS.AssessmentICCQA_Raw."iccqar_iccassmt_fk" as "iccqa_iccassmt_fk" -- The key identifying an ICC assessment.
, VNAHGEDW_FACTS.AssessmentICCQA_Raw."iccqar_ques_code" as "iccqar_ques_code" -- The question long code from the meta-data.
, max(VNAHGEDW_FACTS.AssessmentICCQA_Raw."iccqar_ans_val") as "iccqar_ans_val" -- The official answer, if applicable) from the meta-data.
from VNAHGEDW_FACTS.AssessmentICCQA_Raw
where VNAHGEDW_FACTS.AssessmentICCQA_Raw."iccqar_ques_code" in ('DEPTH (CM)', 'LENGTH (CM)', 'WIDTH (CM)'
, 'DRAIN PRESENT', 'MEASUREMENTS TAKEN', 'SIGNS AND SYMPTOMS OF INFECTION'
) group by 1, 2
) T
group by 1
;
The UDF is simple as follows:
CREATE OR REPLACE FUNCTION TILDA.toFloat(str varchar, val real)
RETURNS real AS $$
BEGIN
RETURN case when str is null then val else str::real end;
EXCEPTION WHEN OTHERS THEN
RETURN val;
END;
$$ LANGUAGE plpgsql COST 1 IMMUTABLE;
It works as a coalesce but with a conversion. I think I have identified some large performance difference with the exception handling. It so happens that with the last 3 columns ('DRAIN PRESENT', 'MEASUREMENTS TAKEN' and 'SIGNS AND SYMPTOMS OF INFECTION'), the data is VERY dirty. There is a mix of 0/1, YES/NO, and other mistyped stuff. This means these 3 columns throw lots of exceptions in the UDF. To illustrate, I simply break this into 2 queries.
select "iccqa_iccassmt_fk"
, (Tilda.toFloat(MAX("iccqar_ans_val") filter (where "iccqar_ques_code"= 'DEPTH (CM)') ,null))::real as "iccqa_DEPTH_CM"
, (Tilda.toFloat(MAX("iccqar_ans_val") filter (where "iccqar_ques_code"= 'LENGTH (CM)') ,null))::real as "iccqa_LENGTH_CM"
, (Tilda.toFloat(MAX("iccqar_ans_val") filter (where "iccqar_ques_code"= 'WIDTH (CM)') ,null))::real as "iccqa_WIDTH_CM"
-- , (Tilda.toFloat(MAX("iccqar_ans_val") filter (where "iccqar_ques_code"= 'DRAIN PRESENT') ,null))::real as "iccqa_DRAIN_PRESENT"
-- , (Tilda.toFloat(MAX("iccqar_ans_val") filter (where "iccqar_ques_code"= 'MEASUREMENTS TAKEN') ,null))::real as "iccqa_MEASUREMENTS_TAKEN"
-- , (Tilda.toFloat(MAX("iccqar_ans_val") filter (where "iccqar_ques_code"= 'SIGNS AND SYMPTOMS OF INFECTION') ,null))::real as "iccqa_SIGNS_AND_SYMPTOMS_OF_INFECTION"
from (
-- 'A pivoted view of ICC QA assessments'
select VNAHGEDW_FACTS.AssessmentICCQA_Raw."iccqar_iccassmt_fk" as "iccqa_iccassmt_fk" -- The key identifying an ICC assessment.
, VNAHGEDW_FACTS.AssessmentICCQA_Raw."iccqar_ques_code" as "iccqar_ques_code" -- The question long code from the meta-data.
, max(VNAHGEDW_FACTS.AssessmentICCQA_Raw."iccqar_ans_val") as "iccqar_ans_val" -- The official answer, if applicable) from the meta-data.
from VNAHGEDW_FACTS.AssessmentICCQA_Raw
where VNAHGEDW_FACTS.AssessmentICCQA_Raw."iccqar_ques_code" in ('DEPTH (CM)', 'LENGTH (CM)', 'WIDTH (CM)'
, 'DRAIN PRESENT', 'MEASUREMENTS TAKEN', 'SIGNS AND SYMPTOMS OF INFECTION'
)
group by 1, 2
) T
group by 1
;
The performance is as expected.
HashAggregate (cost=448463.70..448467.20 rows=200 width=16) (actual time=6760.797..9585.397 rows=677899 loops=1)
Group Key: assessmenticcqa_raw.iccqar_iccassmt_fk
Batches: 1 Memory Usage: 147489kB
Buffers: shared hit=158815
-> HashAggregate (cost=405997.87..417322.09 rows=1132422 width=56) (actual time=4576.514..5460.770 rows=2374628 loops=1)
Group Key: assessmenticcqa_raw.iccqar_iccassmt_fk, assessmenticcqa_raw.iccqar_ques_code
Batches: 1 Memory Usage: 368657kB
Buffers: shared hit=158815
-> Seq Scan on assessmenticcqa_raw (cost=0.00..388224.53 rows=2369779 width=38) (actual time=0.033..3298.544 rows=2374628 loops=1)
Filter: ((iccqar_ques_code)::text = ANY ('{"DEPTH (CM)","LENGTH (CM)","WIDTH (CM)","DRAIN PRESENT","MEASUREMENTS TAKEN","SIGNS AND SYMPTOMS OF INFECTION"}'::text[]))
Rows Removed by Filter: 10734488
Buffers: shared hit=158815
Planning:
Buffers: shared hit=3
Planning Time: 0.198 ms
Execution Time: 9678.120 ms
However, once we switch with the three “bad” columns, the results fall apart.
select "iccqa_iccassmt_fk"
-- , (Tilda.toFloat(MAX("iccqar_ans_val") filter (where "iccqar_ques_code"= 'DEPTH (CM)') ,null))::real as "iccqa_DEPTH_CM"
-- , (Tilda.toFloat(MAX("iccqar_ans_val") filter (where "iccqar_ques_code"= 'LENGTH (CM)') ,null))::real as "iccqa_LENGTH_CM"
-- , (Tilda.toFloat(MAX("iccqar_ans_val") filter (where "iccqar_ques_code"= 'WIDTH (CM)') ,null))::real as "iccqa_WIDTH_CM"
, (Tilda.toFloat(MAX("iccqar_ans_val") filter (where "iccqar_ques_code"= 'DRAIN PRESENT') ,null))::real as "iccqa_DRAIN_PRESENT"
, (Tilda.toFloat(MAX("iccqar_ans_val") filter (where "iccqar_ques_code"= 'MEASUREMENTS TAKEN') ,null))::real as "iccqa_MEASUREMENTS_TAKEN"
, (Tilda.toFloat(MAX("iccqar_ans_val") filter (where "iccqar_ques_code"= 'SIGNS AND SYMPTOMS OF INFECTION') ,null))::real as "iccqa_SIGNS_AND_SYMPTOMS_OF_INFECTION"
from (
-- 'A pivoted view of ICC QA assessments'
select VNAHGEDW_FACTS.AssessmentICCQA_Raw."iccqar_iccassmt_fk" as "iccqa_iccassmt_fk" -- The key identifying an ICC assessment.
, VNAHGEDW_FACTS.AssessmentICCQA_Raw."iccqar_ques_code" as "iccqar_ques_code" -- The question long code from the meta-data.
, max(VNAHGEDW_FACTS.AssessmentICCQA_Raw."iccqar_ans_val") as "iccqar_ans_val" -- The official answer, if applicable) from the meta-data.
from VNAHGEDW_FACTS.AssessmentICCQA_Raw
where VNAHGEDW_FACTS.AssessmentICCQA_Raw."iccqar_ques_code" in ('DEPTH (CM)', 'LENGTH (CM)', 'WIDTH (CM)'
, 'DRAIN PRESENT', 'MEASUREMENTS TAKEN', 'SIGNS AND SYMPTOMS OF INFECTION'
)
group by 1, 2
) T
group by 1
;
The performance falls apart. It is a huge performance difference from ~10s to ~11mn and the only difference that I can think of is that the data is dirty which causes the exception path to be taken. The explain is:
HashAggregate (cost=448463.70..448467.20 rows=200 width=16) (actual time=6672.921..696753.080 rows=677899 loops=1)
Group Key: assessmenticcqa_raw.iccqar_iccassmt_fk
Batches: 1 Memory Usage: 131105kB
Buffers: shared hit=158815
-> HashAggregate (cost=405997.87..417322.09 rows=1132422 width=56) (actual time=4574.918..5446.022 rows=2374628 loops=1)
Group Key: assessmenticcqa_raw.iccqar_iccassmt_fk, assessmenticcqa_raw.iccqar_ques_code
Batches: 1 Memory Usage: 368657kB
Buffers: shared hit=158815
-> Seq Scan on assessmenticcqa_raw (cost=0.00..388224.53 rows=2369779 width=38) (actual time=0.032..3300.616 rows=2374628 loops=1)
Filter: ((iccqar_ques_code)::text = ANY ('{"DEPTH (CM)","LENGTH (CM)","WIDTH (CM)","DRAIN PRESENT","MEASUREMENTS TAKEN","SIGNS AND SYMPTOMS OF INFECTION"}'::text[]))
Rows Removed by Filter: 10734488
Buffers: shared hit=158815
Planning:
Buffers: shared hit=3
Planning Time: 0.201 ms
Execution Time: 696868.845 ms
Now, on V11.2, the explain is:
HashAggregate (cost=492171.36..492174.86 rows=200 width=16) (actual time=19322.522..50556.738 rows=743723 loops=1)
Group Key: assessmenticcqa_raw.iccqar_iccassmt_fk
Buffers: shared hit=11 read=174155 dirtied=13
-> HashAggregate (cost=445458.43..457915.21 rows=1245678 width=56) (actual time=16260.015..17575.088 rows=2601088 loops=1)
Group Key: assessmenticcqa_raw.iccqar_iccassmt_fk, assessmenticcqa_raw.iccqar_ques_code
Buffers: shared read=174155 dirtied=13
-> Seq Scan on assessmenticcqa_raw (cost=0.00..425803.93 rows=2620600 width=38) (actual time=0.126..14425.239 rows=2601088 loops=1)
Filter: ((iccqar_ques_code)::text = ANY ('{"DEPTH (CM)","LENGTH (CM)","WIDTH (CM)","DRAIN PRESENT","MEASUREMENTS TAKEN","SIGNS AND SYMPTOMS OF INFECTION"}'::text[]))
Rows Removed by Filter: 11778360
Buffers: shared read=174155 dirtied=13
Planning Time: 36.121 ms
Execution Time: 50730.255 ms
So, we are seeing two issues:
- I think exception handling is significantly slower between V11.2 and v13.4. I see almost a 14x difference from 50s to 700s.
- Comparing the two queries on V11.2, the difference is 13s vs 50s. So even on V11.2, the exception handling adds a significant overhead which I was not expecting.
I’ll be happy to update my test cases and share additional info if needed.
Thank you,
Laurent Hasson.
"ldh@laurent-hasson.com" <ldh@laurent-hasson.com> writes:
> OK... I apologize for the long email before. Right after I sent it, I thought of a much simpler use-case to
illustratethe issue which doesn't depend on any special data I have access o and complex pivoting. It's as raw as I can
makeit.
> I create a table with 1M rows and 2 columns. Column "a" is a random string, while column "b" is a random integer as a
string.Then I use a UDF that converts strings to floats and handles an exception if the incoming string is not parsable
asa float. Then I do a simple select of each column. In the "a" case, the UDF throws and catches lots of exceptions. In
the"b" case, the conversion is clean and exceptions are not thrown.

I tried this script on a few different versions and got
these psql-measured timings for the test queries:

HEAD:
Time: 12234.297 ms (00:12.234)
Time: 3029.643 ms (00:03.030)

v14:
Time: 12519.038 ms (00:12.519)
Time: 3211.315 ms (00:03.211)

v13:
Time: 12132.026 ms (00:12.132)
Time: 3114.582 ms (00:03.115)

v12:
Time: 11787.554 ms (00:11.788)
Time: 3520.875 ms (00:03.521)

v11:
Time: 13066.495 ms (00:13.066)
Time: 3503.790 ms (00:03.504)

v10:
Time: 15890.844 ms (00:15.891)
Time: 4999.843 ms (00:05.000)

(Caveats: these are assert-enabled debug builds, so they're all
slower than production builds, but the overhead should be pretty
uniform across branches I think.  Also, I wasn't trying hard to
eliminate noise, e.g. I didn't do multiple runs.  So I wouldn't
trust these results to be reproducible to better than 10% or so.)

The overhead of an EXCEPTION block is definitely high, and more
so when an exception actually occurs, but these are known facts
and my results are not out of line with my expectations.  Yours
are though, so something is drastically slowing the exception-
recovery path in your installation.  Do you have any extensions
loaded?

            regards, tom lane
I know that 14 is a beta version but the performance is significantly
worse than v13 (I assume it's 13.4). Head revision is better than v14
but still worse than v13.  Can you expand a bit on the difference? Where
does the difference come from? Are there any differences in the
execution plan?  I am looking at the first query, taking slightly more
than 12s.

Regards

On 8/21/21 11:04 AM, Tom Lane wrote:
> HEAD:
> Time: 12234.297 ms (00:12.234)
> Time: 3029.643 ms (00:03.030)
>
> v14:
> Time: 12519.038 ms (00:12.519)
> Time: 3211.315 ms (00:03.211)
>
> v13:
> Time: 12132.026 ms (00:12.132)
> Time: 3114.582 ms (00:03.115)

--
Mladen Gogala
Database Consultant
Tel: (347) 321-1217
https://dbwhisperer.wordpress.com
RE: Big Performance drop of Exceptions in UDFs between V11.2 and 13.4
-----Original Message-----
From: Tom Lane <tgl@sss.pgh.pa.us>
Sent: Saturday, August 21, 2021 11:05
To: ldh@laurent-hasson.com
Cc: pgsql-performance@postgresql.org
Subject: Re: Big Performance drop of Exceptions in UDFs between V11.2 and 13.4

"ldh@laurent-hasson.com" <ldh@laurent-hasson.com> writes:
> OK... I apologize for the long email before. Right after I sent it, I thought of a much simpler use-case to
illustratethe issue which doesn't depend on any special data I have access o and complex pivoting. It's as raw as I can
makeit.
> I create a table with 1M rows and 2 columns. Column "a" is a random string, while column "b" is a random integer as a
string.Then I use a UDF that converts strings to floats and handles an exception if the incoming string is not parsable
asa float. Then I do a simple select of each column. In the "a" case, the UDF throws and catches lots of exceptions. In
the"b" case, the conversion is clean and exceptions are not thrown.

I tried this script on a few different versions and got these psql-measured timings for the test queries:

HEAD:
Time: 12234.297 ms (00:12.234)
Time: 3029.643 ms (00:03.030)

v14:
Time: 12519.038 ms (00:12.519)
Time: 3211.315 ms (00:03.211)

v13:
Time: 12132.026 ms (00:12.132)
Time: 3114.582 ms (00:03.115)

v12:
Time: 11787.554 ms (00:11.788)
Time: 3520.875 ms (00:03.521)

v11:
Time: 13066.495 ms (00:13.066)
Time: 3503.790 ms (00:03.504)

v10:
Time: 15890.844 ms (00:15.891)
Time: 4999.843 ms (00:05.000)

(Caveats: these are assert-enabled debug builds, so they're all slower than production builds, but the overhead should
bepretty uniform across branches I think.  Also, I wasn't trying hard to eliminate noise, e.g. I didn't do multiple
runs. So I wouldn't trust these results to be reproducible to better than 10% or so.)

The overhead of an EXCEPTION block is definitely high, and more so when an exception actually occurs, but these are
knownfacts and my results are not out of line with my expectations.  Yours are though, so something is drastically
slowingthe exception- recovery path in your installation.  Do you have any extensions loaded?

            regards, tom lane


------------------------------------------------------------------------------------------------------

So you mean that on average, the 4x overhead of exceptions is around what you'd expect?

As for results in general, yes, your numbers look pretty uniform across versions. On my end, comparing V11.2 vs V13.4
showsa much different picture!

I have a few extensions installed: plpgsql, fuzzystrmatch, pg_trgm and tablefunc. Same on either versions of the db
installsI have, and same extension versions.

V11.2:
extname      |extowner|extnamespace|extrelocatable|extversion|extconfig|extcondition|
-------------|--------|------------|--------------|----------|---------|------------|
plpgsql      |      10|          11|false         |1.0       |NULL     |NULL        |
fuzzystrmatch|      10|        2200|true          |1.1       |NULL     |NULL        |
pg_trgm      |      10|        2200|true          |1.3       |NULL     |NULL        |
tablefunc    |      10|        2200|true          |1.0       |NULL     |NULL        |

V13.4
oid  |extname      |extowner|extnamespace|extrelocatable|extversion|extconfig|extcondition|
-----|-------------|--------|------------|--------------|----------|---------|------------|
13428|plpgsql      |      10|          11|false         |1.0       |NULL     |NULL        |
16676|fuzzystrmatch|      10|        2200|true          |1.1       |NULL     |NULL        |
16677|pg_trgm      |      10|        2200|true          |1.4       |NULL     |NULL        |
16678|tablefunc    |      10|        2200|true          |1.0       |NULL     |NULL        |

Thank you,
Laurent.
Mladen Gogala <gogala.mladen@gmail.com> writes:
> I know that 14 is a beta version but the performance is significantly
> worse than v13 (I assume it's 13.4). Head revision is better than v14
> but still worse than v13.  Can you expand a bit on the difference?

[ shrug... ]  I don't see any meaningful differences between those
numbers --- they're within 3% or so across versions, which is less
than the margin of error considering I wasn't trying to control
for outside effects like CPU speed stepping.  Microbenchmarks like
this one are notoriously noisy.  Maybe there's some real difference
there, but these numbers aren't to be trusted that much.

What I was looking for was some evidence matching Laurent's report of
the exception-recovery path being 500X slower than non-exception.
That would have been obvious even with the sloppiest of measurements
... but I'm not seeing it.

            regards, tom lane
"ldh@laurent-hasson.com" <ldh@laurent-hasson.com> writes:
> So you mean that on average, the 4x overhead of exceptions is around what you'd expect?

Doesn't surprise me any, no.  Exception recovery has to clean up after
a wide variety of possible errors, with only minimal assumptions about
what the system state had been.  So it's expensive.  More to the point,
the overhead's been broadly the same for quite some time.

> As for results in general, yes, your numbers look pretty uniform across versions. On my end, comparing V11.2 vs V13.4
showsa much different picture!

I'm baffled why that should be so.  I do not think any of the extensions
you mention add any exception-recovery overhead, especially not in
sessions that haven't used them.

As an additional test, I checked out 11.2 exactly, and got timings
that pretty much matched my previous test of v11 branch tip.  So that
eliminates the theory that we broke something since 11.2 in a patch
that was also back-patched into that branch.

            regards, tom lane
On Sat, Aug 21, 2021 at 02:17:26PM -0400, Tom Lane wrote:
> "ldh@laurent-hasson.com" <ldh@laurent-hasson.com> writes:
> > So you mean that on average, the 4x overhead of exceptions is around what you'd expect?
>
> Doesn't surprise me any, no.  Exception recovery has to clean up after
> a wide variety of possible errors, with only minimal assumptions about
> what the system state had been.  So it's expensive.  More to the point,
> the overhead's been broadly the same for quite some time.
>
> > As for results in general, yes, your numbers look pretty uniform across versions. On my end, comparing V11.2 vs
V13.4shows a much different picture!

>
> I'm baffled why that should be so.  I do not think any of the extensions
> you mention add any exception-recovery overhead, especially not in
> sessions that haven't used them.

Laurent, did you install binaries for v13.4 or compile it ?

What about these ?

SHOW shared_preload_libraries;
SHOW session_preload_libraries;
SHOW local_preload_libraries;

Would you try to reproduce the issue with a fresh database:
CREATE DATABASE udftest; ...

Or a fresh instance created with initdb.

As I recall, you're running postgres under a windows VM - I'm not sure if
that's relevant.

--
Justin
On Sat, Aug 21, 2021 at 02:19:50PM -0500, Justin Pryzby wrote:
> As I recall, you're running postgres under a windows VM - I'm not sure if
> that's relevant.

I tried under a couple hyperv VMs but could not reproduce the issue (only an
~8x difference "with exceptions").

Which hypervisor are you using ?

I don't know if any of it matters, but would you also send:

SELECT version();
SELECT * FROM pg_config();

And maybe the CPU info ?

--
Justin
RE: Big Performance drop of Exceptions in UDFs between V11.2 and 13.4
   >  -----Original Message-----
   >  From: Tom Lane <tgl@sss.pgh.pa.us>
   >  Sent: Saturday, August 21, 2021 14:05
   >  To: Mladen Gogala <gogala.mladen@gmail.com>
   >  Cc: pgsql-performance@lists.postgresql.org
   >  Subject: Re: Big Performance drop of Exceptions in UDFs between V11.2
   >  and 13.4
   >
   >  Mladen Gogala <gogala.mladen@gmail.com> writes:
   >  > I know that 14 is a beta version but the performance is significantly
   >  > worse than v13 (I assume it's 13.4). Head revision is better than v14
   >  > but still worse than v13.  Can you expand a bit on the difference?
   >
   >  [ shrug... ]  I don't see any meaningful differences between those
   >  numbers --- they're within 3% or so across versions, which is less than
   >  the margin of error considering I wasn't trying to control for outside
   >  effects like CPU speed stepping.  Microbenchmarks like this one are
   >  notoriously noisy.  Maybe there's some real difference there, but these
   >  numbers aren't to be trusted that much.
   >
   >  What I was looking for was some evidence matching Laurent's report of
   >  the exception-recovery path being 500X slower than non-exception.
   >  That would have been obvious even with the sloppiest of measurements
   >  ... but I'm not seeing it.
   >
   >              regards, tom lane
   >

Hello Tom,

The difference for the Exceptions-scenario between V11.2 and V13.4 that I observed was 30x.
It is the difference on V13.4 between the Exceptions and no-exceptions scenarios that is 500x+.

Just to clarify.

I am following up with Justin's suggestions and will respond with updated info soon.

Thank you!
Laurent Hasson.
RE: Big Performance drop of Exceptions in UDFs between V11.2 and 13.4
   >  -----Original Message-----
   >  From: Justin Pryzby <pryzby@telsasoft.com>
   >  Sent: Saturday, August 21, 2021 15:20
   >  To: Tom Lane <tgl@sss.pgh.pa.us>
   >  Cc: ldh@laurent-hasson.com; pgsql-performance@postgresql.org
   >  Subject: Re: Big Performance drop of Exceptions in UDFs between V11.2
   >  and 13.4
   >
   >  On Sat, Aug 21, 2021 at 02:17:26PM -0400, Tom Lane wrote:
   >  > "ldh@laurent-hasson.com" <ldh@laurent-hasson.com> writes:
   >  > > So you mean that on average, the 4x overhead of exceptions is
   >  around what you'd expect?
   >  >
   >  > Doesn't surprise me any, no.  Exception recovery has to clean up after
   >  > a wide variety of possible errors, with only minimal assumptions about
   >  > what the system state had been.  So it's expensive.  More to the
   >  > point, the overhead's been broadly the same for quite some time.
   >  >
   >  > > As for results in general, yes, your numbers look pretty uniform
   >  across versions. On my end, comparing V11.2 vs V13.4 shows a much
   >  different picture!
   >  >
   >  > I'm baffled why that should be so.  I do not think any of the
   >  > extensions you mention add any exception-recovery overhead,
   >  especially
   >  > not in sessions that haven't used them.
   >
   >  Laurent, did you install binaries for v13.4 or compile it ?
   >
   >  What about these ?
   >
   >  SHOW shared_preload_libraries;
   >  SHOW session_preload_libraries;
   >  SHOW local_preload_libraries;
   >
   >  Would you try to reproduce the issue with a fresh database:
   >  CREATE DATABASE udftest; ...
   >
   >  Or a fresh instance created with initdb.
   >
   >  As I recall, you're running postgres under a windows VM - I'm not sure if
   >  that's relevant.
   >
   >  --
   >  Justin

Hello Justin,

- I used the standard installer from https://www.enterprisedb.com/downloads/postgres-postgresql-downloads for Windows
X64and upgraded from 13.3, which itself was pg_upgraded from 11.2.
- Yes, windows VM on VMWARE.
- No entries from shared_preload_libraries, session_preload_libraries or local_preload_libraries.
- Version is "PostgreSQL 13.4, compiled by Visual C++ build 1914, 64-bit".
- I created a new database and reran the scenarios without much of a change.
- I think I am going to install a whole fresh new instance from scratch and see if there may have been some weird stuff
happeningwith the upgrade path I took?

Thank you,
Laurent Hasson.
Could you send SELECT * FROM pg_config()
and try to find the CPU model ?

I think it's possible the hypervisor is trapping and emulating unhandled CPU
instructions.

Actually, it would be interesting to see if the performance differs between
11.2 and 11.13.  It's possible that EDB compiled 11.13 on a newer CPU (or a
newer compiler) than 11.2 was compiled.

If you test that, it should be on a separate VM, unless the existing data dir
can be restored from backup.  Once you've started a cluster with updated
binaries, you should avoid downgrading the binaries.
RE: Big Performance drop of Exceptions in UDFs between V11.2 and 13.4
   >  -----Original Message-----
   >  From: Justin Pryzby <pryzby@telsasoft.com>
   >  Sent: Saturday, August 21, 2021 18:17
   >  To: ldh@laurent-hasson.com
   >  Cc: Tom Lane <tgl@sss.pgh.pa.us>; pgsql-performance@postgresql.org
   >  Subject: Re: Big Performance drop of Exceptions in UDFs between V11.2
   >  and 13.4
   >
   >  Could you send SELECT * FROM pg_config() and try to find the CPU
   >  model ?
   >
   >  I think it's possible the hypervisor is trapping and emulating unhandled
   >  CPU instructions.
   >
   >  Actually, it would be interesting to see if the performance differs
   >  between
   >  11.2 and 11.13.  It's possible that EDB compiled 11.13 on a newer CPU
   >  (or a newer compiler) than 11.2 was compiled.
   >
   >  If you test that, it should be on a separate VM, unless the existing data
   >  dir can be restored from backup.  Once you've started a cluster with
   >  updated binaries, you should avoid downgrading the binaries.


Hello all,

OK, I was able to do a clean install of 13.4 on the VM. All stock settings, no extensions loaded, pure clean straight
outof the install.


create table sampletest (a varchar, b varchar);
-- truncate table sampletest;
insert into sampletest (a, b)
select substr(md5(random()::text), 0, 15), (100000000*random())::integer::varchar
  from generate_series(1,1000000);

CREATE OR REPLACE FUNCTION toFloat(str varchar, val real)
RETURNS real AS $$
BEGIN
  RETURN case when str is null then val else str::real end;
EXCEPTION WHEN OTHERS THEN
  RETURN val;
END;
$$ LANGUAGE plpgsql COST 1 IMMUTABLE;


explain (analyze,buffers,COSTS,TIMING) select MAX(toFloat(b, null)) as "b" from sampletest

Aggregate  (cost=21370.00..21370.01 rows=1 width=4) (actual time=1780.561..1780.563 rows=1 loops=1)
  Buffers: shared hit=6387
  ->  Seq Scan on sampletest  (cost=0.00..16370.00 rows=1000000 width=8) (actual time=0.053..97.329 rows=1000000
loops=1)
        Buffers: shared hit=6370
Planning:
  Buffers: shared hit=36
Planning Time: 2.548 ms
Execution Time: 1,810.330 ms


explain (analyze,buffers,COSTS,TIMING) select MAX(toFloat(a, null)) as "a" from sampletest

Aggregate  (cost=21370.00..21370.01 rows=1 width=4) (actual time=863243.876..863243.877 rows=1 loops=1)
  Buffers: shared hit=6373
  ->  Seq Scan on sampletest  (cost=0.00..16370.00 rows=1000000 width=15) (actual time=0.009..301.553 rows=1000000
loops=1)
        Buffers: shared hit=6370
Planning:
  Buffers: shared hit=44
Planning Time: 0.469 ms
Execution Time: 863,243.911 ms


So I am still able to reproduce this on a different VM and a clean install of 13.4 ☹


SELECT * FROM pg_config();

BINDIR    C:/PROGRA~1/POSTGR~1/13/bin
DOCDIR    C:/PROGRA~1/POSTGR~1/13/doc
HTMLDIR    C:/PROGRA~1/POSTGR~1/13/doc
INCLUDEDIR    C:/PROGRA~1/POSTGR~1/13/include
PKGINCLUDEDIR    C:/PROGRA~1/POSTGR~1/13/include
INCLUDEDIR-SERVER    C:/PROGRA~1/POSTGR~1/13/include/server
LIBDIR    C:/PROGRA~1/POSTGR~1/13/lib
PKGLIBDIR    C:/PROGRA~1/POSTGR~1/13/lib
LOCALEDIR    C:/PROGRA~1/POSTGR~1/13/share/locale
MANDIR    C:/Program Files/PostgreSQL/13/man
SHAREDIR    C:/PROGRA~1/POSTGR~1/13/share
SYSCONFDIR    C:/Program Files/PostgreSQL/13/etc
PGXS    C:/Program Files/PostgreSQL/13/lib/pgxs/src/makefiles/pgxs.mk
CONFIGURE    --enable-thread-safety --enable-nls --with-ldap --with-openssl --with-uuid --with-libxml --with-libxslt
--with-icu--with-tcl --with-perl --with-python

CC    not recorded
CPPFLAGS    not recorded
CFLAGS    not recorded
CFLAGS_SL    not recorded
LDFLAGS    not recorded
LDFLAGS_EX    not recorded
LDFLAGS_SL    not recorded
LIBS    not recorded
VERSION    PostgreSQL 13.4


And here is SYSINFO:

C:\Users\LHASSON>systeminfo

Host Name:                 PRODDB
OS Name:                   Microsoft Windows Server 2012 R2 Standard
OS Version:                6.3.9600 N/A Build 9600
OS Manufacturer:           Microsoft Corporation
OS Configuration:          Member Server
OS Build Type:             Multiprocessor Free
Original Install Date:     2015-09-19, 18:19:41
System Boot Time:          2021-07-22, 11:45:09
System Manufacturer:       VMware, Inc.
System Model:              VMware Virtual Platform
System Type:               x64-based PC
Processor(s):              4 Processor(s) Installed.
                           [01]: Intel64 Family 6 Model 79 Stepping 1 GenuineIntel ~2397 Mhz
                           [02]: Intel64 Family 6 Model 79 Stepping 1 GenuineIntel ~2397 Mhz
                           [03]: Intel64 Family 6 Model 79 Stepping 1 GenuineIntel ~2397 Mhz
                           [04]: Intel64 Family 6 Model 79 Stepping 1 GenuineIntel ~2397 Mhz
BIOS Version:              Phoenix Technologies LTD 6.00, 2020-05-28
Windows Directory:         C:\Windows
System Directory:          C:\Windows\system32
Boot Device:               \Device\HarddiskVolume1
System Locale:             en-us;English (United States)
Input Locale:              en-us;English (United States)
Time Zone:                 (UTC-05:00) Eastern Time (US & Canada)
Total Physical Memory:     65,535 MB
Available Physical Memory: 57,791 MB
Virtual Memory: Max Size:  75,263 MB
Virtual Memory: Available: 66,956 MB
Virtual Memory: In Use:    8,307 MB
Page File Location(s):     C:\pagefile.sys
RE: Big Performance drop of Exceptions in UDFs between V11.2 and 13.4
   >  -----Original Message-----
   >  From: ldh@laurent-hasson.com <ldh@laurent-hasson.com>
   >  Sent: Saturday, August 21, 2021 19:02
   >  To: Justin Pryzby <pryzby@telsasoft.com>
   >  Cc: Tom Lane <tgl@sss.pgh.pa.us>; pgsql-performance@postgresql.org
   >  Subject: RE: Big Performance drop of Exceptions in UDFs between V11.2
   >  and 13.4
   >
   >
   >
   >     >  -----Original Message-----
   >     >  From: Justin Pryzby <pryzby@telsasoft.com>
   >     >  Sent: Saturday, August 21, 2021 18:17
   >     >  To: ldh@laurent-hasson.com
   >     >  Cc: Tom Lane <tgl@sss.pgh.pa.us>; pgsql-
   >  performance@postgresql.org
   >     >  Subject: Re: Big Performance drop of Exceptions in UDFs between
   >  V11.2
   >     >  and 13.4
   >     >
   >     >  Could you send SELECT * FROM pg_config() and try to find the CPU
   >     >  model ?
   >     >
   >     >  I think it's possible the hypervisor is trapping and emulating
   >  unhandled
   >     >  CPU instructions.
   >     >
   >     >  Actually, it would be interesting to see if the performance differs
   >     >  between
   >     >  11.2 and 11.13.  It's possible that EDB compiled 11.13 on a newer
   >  CPU
   >     >  (or a newer compiler) than 11.2 was compiled.
   >     >
   >     >  If you test that, it should be on a separate VM, unless the existing
   >  data
   >     >  dir can be restored from backup.  Once you've started a cluster with
   >     >  updated binaries, you should avoid downgrading the binaries.
   >
   >
   >
   >  Hello all,
   >
   >  OK, I was able to do a clean install of 13.4 on the VM. All stock settings,
   >  no extensions loaded, pure clean straight out of the install.
   >
   >  create table sampletest (a varchar, b varchar);
   >  -- truncate table sampletest;
   >  insert into sampletest (a, b)
   >  select substr(md5(random()::text), 0, 15),
   >  (100000000*random())::integer::varchar
   >    from generate_series(1,1000000);
   >
   >  CREATE OR REPLACE FUNCTION toFloat(str varchar, val real) RETURNS
   >  real AS $$ BEGIN
   >    RETURN case when str is null then val else str::real end; EXCEPTION
   >  WHEN OTHERS THEN
   >    RETURN val;
   >  END;
   >  $$ LANGUAGE plpgsql COST 1 IMMUTABLE;
   >
   >
   >  explain (analyze,buffers,COSTS,TIMING) select MAX(toFloat(b, null)) as
   >  "b" from sampletest
   >
   >  Aggregate  (cost=21370.00..21370.01 rows=1 width=4) (actual
   >  time=1780.561..1780.563 rows=1 loops=1)
   >    Buffers: shared hit=6387
   >    ->  Seq Scan on sampletest  (cost=0.00..16370.00 rows=1000000
   >  width=8) (actual time=0.053..97.329 rows=1000000 loops=1)
   >          Buffers: shared hit=6370
   >  Planning:
   >    Buffers: shared hit=36
   >  Planning Time: 2.548 ms
   >  Execution Time: 1,810.330 ms
   >
   >
   >  explain (analyze,buffers,COSTS,TIMING) select MAX(toFloat(a, null)) as
   >  "a" from sampletest
   >
   >  Aggregate  (cost=21370.00..21370.01 rows=1 width=4) (actual
   >  time=863243.876..863243.877 rows=1 loops=1)
   >    Buffers: shared hit=6373
   >    ->  Seq Scan on sampletest  (cost=0.00..16370.00 rows=1000000
   >  width=15) (actual time=0.009..301.553 rows=1000000 loops=1)
   >          Buffers: shared hit=6370
   >  Planning:
   >    Buffers: shared hit=44
   >  Planning Time: 0.469 ms
   >  Execution Time: 863,243.911 ms
   >
   >
   >  So I am still able to reproduce this on a different VM and a clean install
   >  of 13.4 ☹
   >
   >
   >  SELECT * FROM pg_config();
   >
   >  BINDIR    C:/PROGRA~1/POSTGR~1/13/bin
   >  DOCDIR    C:/PROGRA~1/POSTGR~1/13/doc
   >  HTMLDIR    C:/PROGRA~1/POSTGR~1/13/doc
   >  INCLUDEDIR    C:/PROGRA~1/POSTGR~1/13/include
   >  PKGINCLUDEDIR    C:/PROGRA~1/POSTGR~1/13/include
   >  INCLUDEDIR-SERVER    C:/PROGRA~1/POSTGR~1/13/include/server
   >  LIBDIR    C:/PROGRA~1/POSTGR~1/13/lib
   >  PKGLIBDIR    C:/PROGRA~1/POSTGR~1/13/lib
   >  LOCALEDIR    C:/PROGRA~1/POSTGR~1/13/share/locale
   >  MANDIR    C:/Program Files/PostgreSQL/13/man
   >  SHAREDIR    C:/PROGRA~1/POSTGR~1/13/share
   >  SYSCONFDIR    C:/Program Files/PostgreSQL/13/etc
   >  PGXS    C:/Program Files/PostgreSQL/13/lib/pgxs/src/makefiles/pgxs.mk
   >  CONFIGURE    --enable-thread-safety --enable-nls --with-ldap --with-
   >  openssl --with-uuid --with-libxml --with-libxslt --with-icu --with-tcl --with-
   >  perl --with-python
   >  CC    not recorded
   >  CPPFLAGS    not recorded
   >  CFLAGS    not recorded
   >  CFLAGS_SL    not recorded
   >  LDFLAGS    not recorded
   >  LDFLAGS_EX    not recorded
   >  LDFLAGS_SL    not recorded
   >  LIBS    not recorded
   >  VERSION    PostgreSQL 13.4
   >
   >
   >  And here is SYSINFO:
   >
   >  C:\Users\LHASSON>systeminfo
   >
   >  Host Name:                 PRODDB
   >  OS Name:                   Microsoft Windows Server 2012 R2 Standard
   >  OS Version:                6.3.9600 N/A Build 9600
   >  OS Manufacturer:           Microsoft Corporation
   >  OS Configuration:          Member Server
   >  OS Build Type:             Multiprocessor Free
   >  Original Install Date:     2015-09-19, 18:19:41
   >  System Boot Time:          2021-07-22, 11:45:09
   >  System Manufacturer:       VMware, Inc.
   >  System Model:              VMware Virtual Platform
   >  System Type:               x64-based PC
   >  Processor(s):              4 Processor(s) Installed.
   >                             [01]: Intel64 Family 6 Model 79 Stepping 1 GenuineIntel
   >  ~2397 Mhz
   >                             [02]: Intel64 Family 6 Model 79 Stepping 1 GenuineIntel
   >  ~2397 Mhz
   >                             [03]: Intel64 Family 6 Model 79 Stepping 1 GenuineIntel
   >  ~2397 Mhz
   >                             [04]: Intel64 Family 6 Model 79 Stepping 1 GenuineIntel
   >  ~2397 Mhz
   >  BIOS Version:              Phoenix Technologies LTD 6.00, 2020-05-28
   >  Windows Directory:         C:\Windows
   >  System Directory:          C:\Windows\system32
   >  Boot Device:               \Device\HarddiskVolume1
   >  System Locale:             en-us;English (United States)
   >  Input Locale:              en-us;English (United States)
   >  Time Zone:                 (UTC-05:00) Eastern Time (US & Canada)
   >  Total Physical Memory:     65,535 MB
   >  Available Physical Memory: 57,791 MB
   >  Virtual Memory: Max Size:  75,263 MB
   >  Virtual Memory: Available: 66,956 MB
   >  Virtual Memory: In Use:    8,307 MB
   >  Page File Location(s):     C:\pagefile.sys
   >


And by the way, I reproduced this again on my personal laptop with a fresh clean base-line install of 13.4.

Systeminfo
-------------------
OS Name:                   Microsoft Windows 10 Pro
OS Version:                10.0.19043 N/A Build 19043
OS Manufacturer:           Microsoft Corporation
OS Configuration:          Standalone Workstation
OS Build Type:             Multiprocessor Free
Registered Owner:          Windows User
Registered Organization:
Product ID:                00330-50535-98614-AAOEM
Original Install Date:     2021-04-04, 09:50:59
System Boot Time:          2021-08-19, 10:18:03
System Manufacturer:       LENOVO
System Model:              20HRCTO1WW
System Type:               x64-based PC
Processor(s):              1 Processor(s) Installed.
                           [01]: Intel64 Family 6 Model 142 Stepping 9 GenuineIntel ~801 Mhz
BIOS Version:              LENOVO N1MET64W (1.49 ), 2020-10-14
Windows Directory:         C:\WINDOWS
System Directory:          C:\WINDOWS\system32
Boot Device:               \Device\HarddiskVolume1
System Locale:             en-us;English (United States)
Input Locale:              en-us;English (United States)
Time Zone:                 (UTC-05:00) Eastern Time (US & Canada)
Total Physical Memory:     16,219 MB
Available Physical Memory: 4,971 MB
Virtual Memory: Max Size:  32,603 MB
Virtual Memory: Available: 12,168 MB
Virtual Memory: In Use:    20,435 MB
Page File Location(s):     C:\pagefile.sys


SELECT * FROM pg_config();
--------------------------------------------
BINDIR    C:/PROGRA~1/POSTGR~1/13/bin
DOCDIR    C:/PROGRA~1/POSTGR~1/13/doc
HTMLDIR    C:/PROGRA~1/POSTGR~1/13/doc
INCLUDEDIR    C:/PROGRA~1/POSTGR~1/13/include
PKGINCLUDEDIR    C:/PROGRA~1/POSTGR~1/13/include
INCLUDEDIR-SERVER    C:/PROGRA~1/POSTGR~1/13/include/server
LIBDIR    C:/PROGRA~1/POSTGR~1/13/lib
PKGLIBDIR    C:/PROGRA~1/POSTGR~1/13/lib
LOCALEDIR    C:/PROGRA~1/POSTGR~1/13/share/locale
MANDIR    C:/Program Files/PostgreSQL/13/man
SHAREDIR    C:/PROGRA~1/POSTGR~1/13/share
SYSCONFDIR    C:/Program Files/PostgreSQL/13/etc
PGXS    C:/Program Files/PostgreSQL/13/lib/pgxs/src/makefiles/pgxs.mk
CONFIGURE    --enable-thread-safety --enable-nls --with-ldap --with-openssl --with-uuid --with-libxml --with-libxslt
--with-icu--with-tcl --with-perl --with-python

CC    not recorded
CPPFLAGS    not recorded
CFLAGS    not recorded
CFLAGS_SL    not recorded
LDFLAGS    not recorded
LDFLAGS_EX    not recorded
LDFLAGS_SL    not recorded
LIBS    not recorded
VERSION    PostgreSQL 13.4
> -----Original Message-----
> From: ldh@laurent-hasson.com <ldh@laurent-hasson.com>
> Sent: Saturday, August 21, 2021 19:02
> To: Justin Pryzby <pryzby@telsasoft.com>
> Cc: Tom Lane <tgl@sss.pgh.pa.us>; pgsql-performance@postgresql.org
> Subject: RE: Big Performance drop of Exceptions in UDFs between V11.2
> and 13.4
>
>
>
> > -----Original Message-----
> > From: Justin Pryzby <pryzby@telsasoft.com>
> > Sent: Saturday, August 21, 2021 18:17
> > To: ldh@laurent-hasson.com
> > Cc: Tom Lane <tgl@sss.pgh.pa.us>; pgsql-
> performance@postgresql.org
> > Subject: Re: Big Performance drop of Exceptions in UDFs between
> V11.2
> > and 13.4
> >
> > Could you send SELECT * FROM pg_config() and try to find the CPU
> > model ?
> >
> > I think it's possible the hypervisor is trapping and emulating
> unhandled
> > CPU instructions.
> >
> > Actually, it would be interesting to see if the performance differs
> > between
> > 11.2 and 11.13. It's possible that EDB compiled 11.13 on a newer
> CPU
> > (or a newer compiler) than 11.2 was compiled.
> >
> > If you test that, it should be on a separate VM, unless the existing
> data
> > dir can be restored from backup. Once you've started a cluster with
> > updated binaries, you should avoid downgrading the binaries.
>
>
>
> Hello all,
>
> OK, I was able to do a clean install of 13.4 on the VM. All stock settings,
> no extensions loaded, pure clean straight out of the install.
>
> create table sampletest (a varchar, b varchar);
> -- truncate table sampletest;
> insert into sampletest (a, b)
> select substr(md5(random()::text), 0, 15),
> (100000000*random())::integer::varchar
> from generate_series(1,1000000);
>
> CREATE OR REPLACE FUNCTION toFloat(str varchar, val real) RETURNS
> real AS $$ BEGIN
> RETURN case when str is null then val else str::real end; EXCEPTION
> WHEN OTHERS THEN
> RETURN val;
> END;
> $$ LANGUAGE plpgsql COST 1 IMMUTABLE;
>
>
> explain (analyze,buffers,COSTS,TIMING) select MAX(toFloat(b, null)) as
> "b" from sampletest
>
> Aggregate (cost=21370.00..21370.01 rows=1 width=4) (actual
> time=1780.561..1780.563 rows=1 loops=1)
> Buffers: shared hit=6387
> -> Seq Scan on sampletest (cost=0.00..16370.00 rows=1000000
> width=8) (actual time=0.053..97.329 rows=1000000 loops=1)
> Buffers: shared hit=6370
> Planning:
> Buffers: shared hit=36
> Planning Time: 2.548 ms
> Execution Time: 1,810.330 ms
>
>
> explain (analyze,buffers,COSTS,TIMING) select MAX(toFloat(a, null)) as
> "a" from sampletest
>
> Aggregate (cost=21370.00..21370.01 rows=1 width=4) (actual
> time=863243.876..863243.877 rows=1 loops=1)
> Buffers: shared hit=6373
> -> Seq Scan on sampletest (cost=0.00..16370.00 rows=1000000
> width=15) (actual time=0.009..301.553 rows=1000000 loops=1)
> Buffers: shared hit=6370
> Planning:
> Buffers: shared hit=44
> Planning Time: 0.469 ms
> Execution Time: 863,243.911 ms
>
>
> So I am still able to reproduce this on a different VM and a clean install
> of 13.4 ☹
>
>
> SELECT * FROM pg_config();
>
> BINDIR C:/PROGRA~1/POSTGR~1/13/bin
> DOCDIR C:/PROGRA~1/POSTGR~1/13/doc
> HTMLDIR C:/PROGRA~1/POSTGR~1/13/doc
> INCLUDEDIR C:/PROGRA~1/POSTGR~1/13/include
> PKGINCLUDEDIR C:/PROGRA~1/POSTGR~1/13/include
> INCLUDEDIR-SERVER C:/PROGRA~1/POSTGR~1/13/include/server
> LIBDIR C:/PROGRA~1/POSTGR~1/13/lib
> PKGLIBDIR C:/PROGRA~1/POSTGR~1/13/lib
> LOCALEDIR C:/PROGRA~1/POSTGR~1/13/share/locale
> MANDIR C:/Program Files/PostgreSQL/13/man
> SHAREDIR C:/PROGRA~1/POSTGR~1/13/share
> SYSCONFDIR C:/Program Files/PostgreSQL/13/etc
> PGXS C:/Program Files/PostgreSQL/13/lib/pgxs/src/makefiles/pgxs.mk
> CONFIGURE --enable-thread-safety --enable-nls --with-ldap --with-
> openssl --with-uuid --with-libxml --with-libxslt --with-icu --with-tcl --with-
> perl --with-python
> CC not recorded
> CPPFLAGS not recorded
> CFLAGS not recorded
> CFLAGS_SL not recorded
> LDFLAGS not recorded
> LDFLAGS_EX not recorded
> LDFLAGS_SL not recorded
> LIBS not recorded
> VERSION PostgreSQL 13.4
>
>
> And here is SYSINFO:
>
> C:\Users\LHASSON>systeminfo
>
> Host Name: PRODDB
> OS Name: Microsoft Windows Server 2012 R2 Standard
> OS Version: 6.3.9600 N/A Build 9600
> OS Manufacturer: Microsoft Corporation
> OS Configuration: Member Server
> OS Build Type: Multiprocessor Free
> Original Install Date: 2015-09-19, 18:19:41
> System Boot Time: 2021-07-22, 11:45:09
> System Manufacturer: VMware, Inc.
> System Model: VMware Virtual Platform
> System Type: x64-based PC
> Processor(s): 4 Processor(s) Installed.
> [01]: Intel64 Family 6 Model 79 Stepping 1 GenuineIntel
> ~2397 Mhz
> [02]: Intel64 Family 6 Model 79 Stepping 1 GenuineIntel
> ~2397 Mhz
> [03]: Intel64 Family 6 Model 79 Stepping 1 GenuineIntel
> ~2397 Mhz
> [04]: Intel64 Family 6 Model 79 Stepping 1 GenuineIntel
> ~2397 Mhz
> BIOS Version: Phoenix Technologies LTD 6.00, 2020-05-28
> Windows Directory: C:\Windows
> System Directory: C:\Windows\system32
> Boot Device: \Device\HarddiskVolume1
> System Locale: en-us;English (United States)
> Input Locale: en-us;English (United States)
> Time Zone: (UTC-05:00) Eastern Time (US & Canada)
> Total Physical Memory: 65,535 MB
> Available Physical Memory: 57,791 MB
> Virtual Memory: Max Size: 75,263 MB
> Virtual Memory: Available: 66,956 MB
> Virtual Memory: In Use: 8,307 MB
> Page File Location(s): C:\pagefile.sys
>
And by the way, I reproduced this again on my personal laptop with a fresh clean base-line install of 13.4.
Systeminfo
-------------------
OS Name: Microsoft Windows 10 Pro
OS Version: 10.0.19043 N/A Build 19043
OS Manufacturer: Microsoft Corporation
OS Configuration: Standalone Workstation
OS Build Type: Multiprocessor Free
Registered Owner: Windows User
Registered Organization:
Product ID: 00330-50535-98614-AAOEM
Original Install Date: 2021-04-04, 09:50:59
System Boot Time: 2021-08-19, 10:18:03
System Manufacturer: LENOVO
System Model: 20HRCTO1WW
System Type: x64-based PC
Processor(s): 1 Processor(s) Installed.
[01]: Intel64 Family 6 Model 142 Stepping 9 GenuineIntel ~801 Mhz
BIOS Version: LENOVO N1MET64W (1.49 ), 2020-10-14
Windows Directory: C:\WINDOWS
System Directory: C:\WINDOWS\system32
Boot Device: \Device\HarddiskVolume1
System Locale: en-us;English (United States)
Input Locale: en-us;English (United States)
Time Zone: (UTC-05:00) Eastern Time (US & Canada)
Total Physical Memory: 16,219 MB
Available Physical Memory: 4,971 MB
Virtual Memory: Max Size: 32,603 MB
Virtual Memory: Available: 12,168 MB
Virtual Memory: In Use: 20,435 MB
Page File Location(s): C:\pagefile.sys
SELECT * FROM pg_config();
--------------------------------------------
BINDIR C:/PROGRA~1/POSTGR~1/13/bin
DOCDIR C:/PROGRA~1/POSTGR~1/13/doc
HTMLDIR C:/PROGRA~1/POSTGR~1/13/doc
INCLUDEDIR C:/PROGRA~1/POSTGR~1/13/include
PKGINCLUDEDIR C:/PROGRA~1/POSTGR~1/13/include
INCLUDEDIR-SERVER C:/PROGRA~1/POSTGR~1/13/include/server
LIBDIR C:/PROGRA~1/POSTGR~1/13/lib
PKGLIBDIR C:/PROGRA~1/POSTGR~1/13/lib
LOCALEDIR C:/PROGRA~1/POSTGR~1/13/share/locale
MANDIR C:/Program Files/PostgreSQL/13/man
SHAREDIR C:/PROGRA~1/POSTGR~1/13/share
SYSCONFDIR C:/Program Files/PostgreSQL/13/etc
PGXS C:/Program Files/PostgreSQL/13/lib/pgxs/src/makefiles/pgxs.mk
CONFIGURE --enable-thread-safety --enable-nls --with-ldap --with-openssl --with-uuid --with-libxml --with-libxslt --with-icu --with-tcl --with-perl --with-python
CC not recorded
CPPFLAGS not recorded
CFLAGS not recorded
CFLAGS_SL not recorded
LDFLAGS not recorded
LDFLAGS_EX not recorded
LDFLAGS_SL not recorded
LIBS not recorded
VERSION PostgreSQL 13.4
QUERY PLAN
------------------------------------------------------------------------------------------------------------------------------
Aggregate (cost=21370.00..21370.01 rows=1 width=4) (actual time=103064.061..103064.062 rows=1 loops=1)
Buffers: shared hit=6370
-> Seq Scan on sampletest (cost=0.00..16370.00 rows=1000000 width=15) (actual time=0.037..1253.552 rows=1000000 loops=1)
Buffers: shared hit=6370
Planning Time: 0.252 ms
Execution Time: 103064.136 ms
(6 rows)
1: QUERY PLAN (typeid = 25, len = -1, typmod = -1, byval = f)
----
1: QUERY PLAN = "Aggregate (cost=21370.00..21370.01 rows=1 width=4) (actual time=61820.815..61820.816 rows=1 loops=1)" (typeid = 25, len = -1, typmod = -1, byval = f)
----
1: QUERY PLAN = " Buffers: shared hit=11 read=6379" (typeid = 25, len = -1, typmod = -1, byval = f)
----
1: QUERY PLAN = " -> Seq Scan on sampletest (cost=0.00..16370.00 rows=1000000 width=15) (actual time=0.113..1607.444 rows=1000000 loops=1)" (typeid = 25, len = -1, typmod = -1, byval = f)
----
1: QUERY PLAN = " Buffers: shared read=6370" (typeid = 25, len = -1, typmod = -1, byval = f)
----
1: QUERY PLAN = "Planning:" (typeid = 25, len = -1, typmod = -1, byval = f)
----
1: QUERY PLAN = " Buffers: shared hit=51 read=24" (typeid = 25, len = -1, typmod = -1, byval = f)
----
1: QUERY PLAN = "Planning Time: 21.647 ms" (typeid = 25, len = -1, typmod = -1, byval = f)
----
1: QUERY PLAN = "Execution Time: 61835.470 ms" (typeid = 25, len = -1, typmod = -1, byval = f)
Attachment
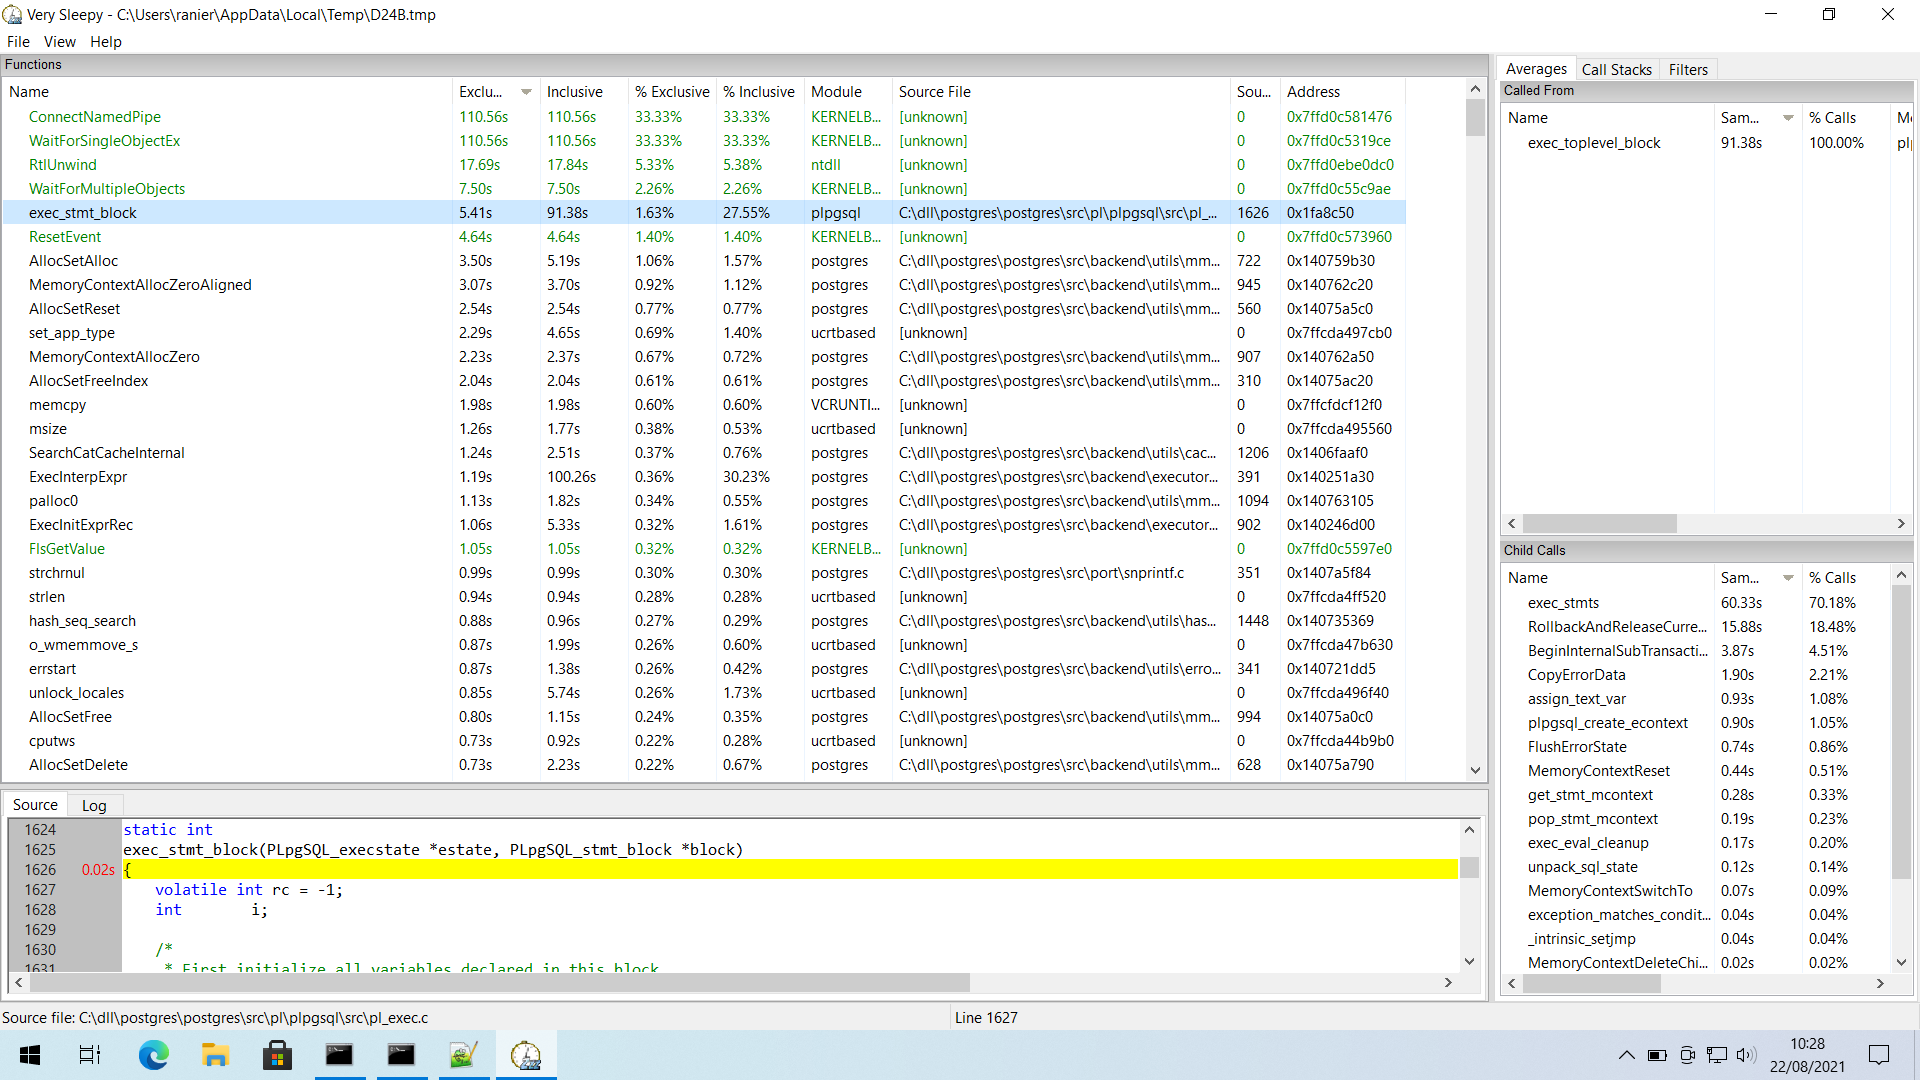
Justin Pryzby <pryzby@telsasoft.com> writes:
> This looks useful, thanks.  It seems like maybe win64 builds are very slow
> running this:

> exec_stmt_block() /
> BeginInternalSubTransaction() /
> AbortSubTransaction() /
> reschedule_timeouts() /
> schedule_alarm() /
> setitimer() /
> pg_timer_thread() /
> WaitForSingleObjectEx ()

Hmm ... we should not be there unless there are active timeout events,
which there aren't by default.  I wonder whether either Ranier or
Laurent have statement_timeout or some similar option enabled.

I tried setting statement_timeout = '1 min' just to see if that
would affect the results.  It does, but only incrementally on
my Linux box (on v13, the exception-causing query slows from
~13sec to ~14sec).  It's possible that our Windows version of
setitimer() is far slower, but that doesn't make a lot of
sense really --- the client side of that just briefly takes
a critical section.  It shouldn't be blocking.

Also, the Windows version (src/backend/port/win32/timer.c)
hasn't changed at all since before v11.  So even if it's
slow, that doesn't tell us what changed.

There is a patch in v14 (09cf1d522) that drastically reduces
the rate at which we make setitimer() calls, which would likely
be enough to fix any performance problem that may exist here.
But it's still unclear what's different between v11 and v13.

            regards, tom lane
RE: Big Performance drop of Exceptions in UDFs between V11.2 and 13.4
> -----Original Message-----
> From: Justin Pryzby <pryzby@telsasoft.com>
> Sent: Sunday, August 22, 2021 11:48
> To: Ranier Vilela <ranier.vf@gmail.com>
> Cc: ldh@laurent-hasson.com; Tom Lane <tgl@sss.pgh.pa.us>; pgsql-
> performance@postgresql.org
> Subject: Re: Big Performance drop of Exceptions in UDFs between V11.2
> and 13.4
>
> On Sun, Aug 22, 2021 at 10:50:47AM -0300, Ranier Vilela wrote:
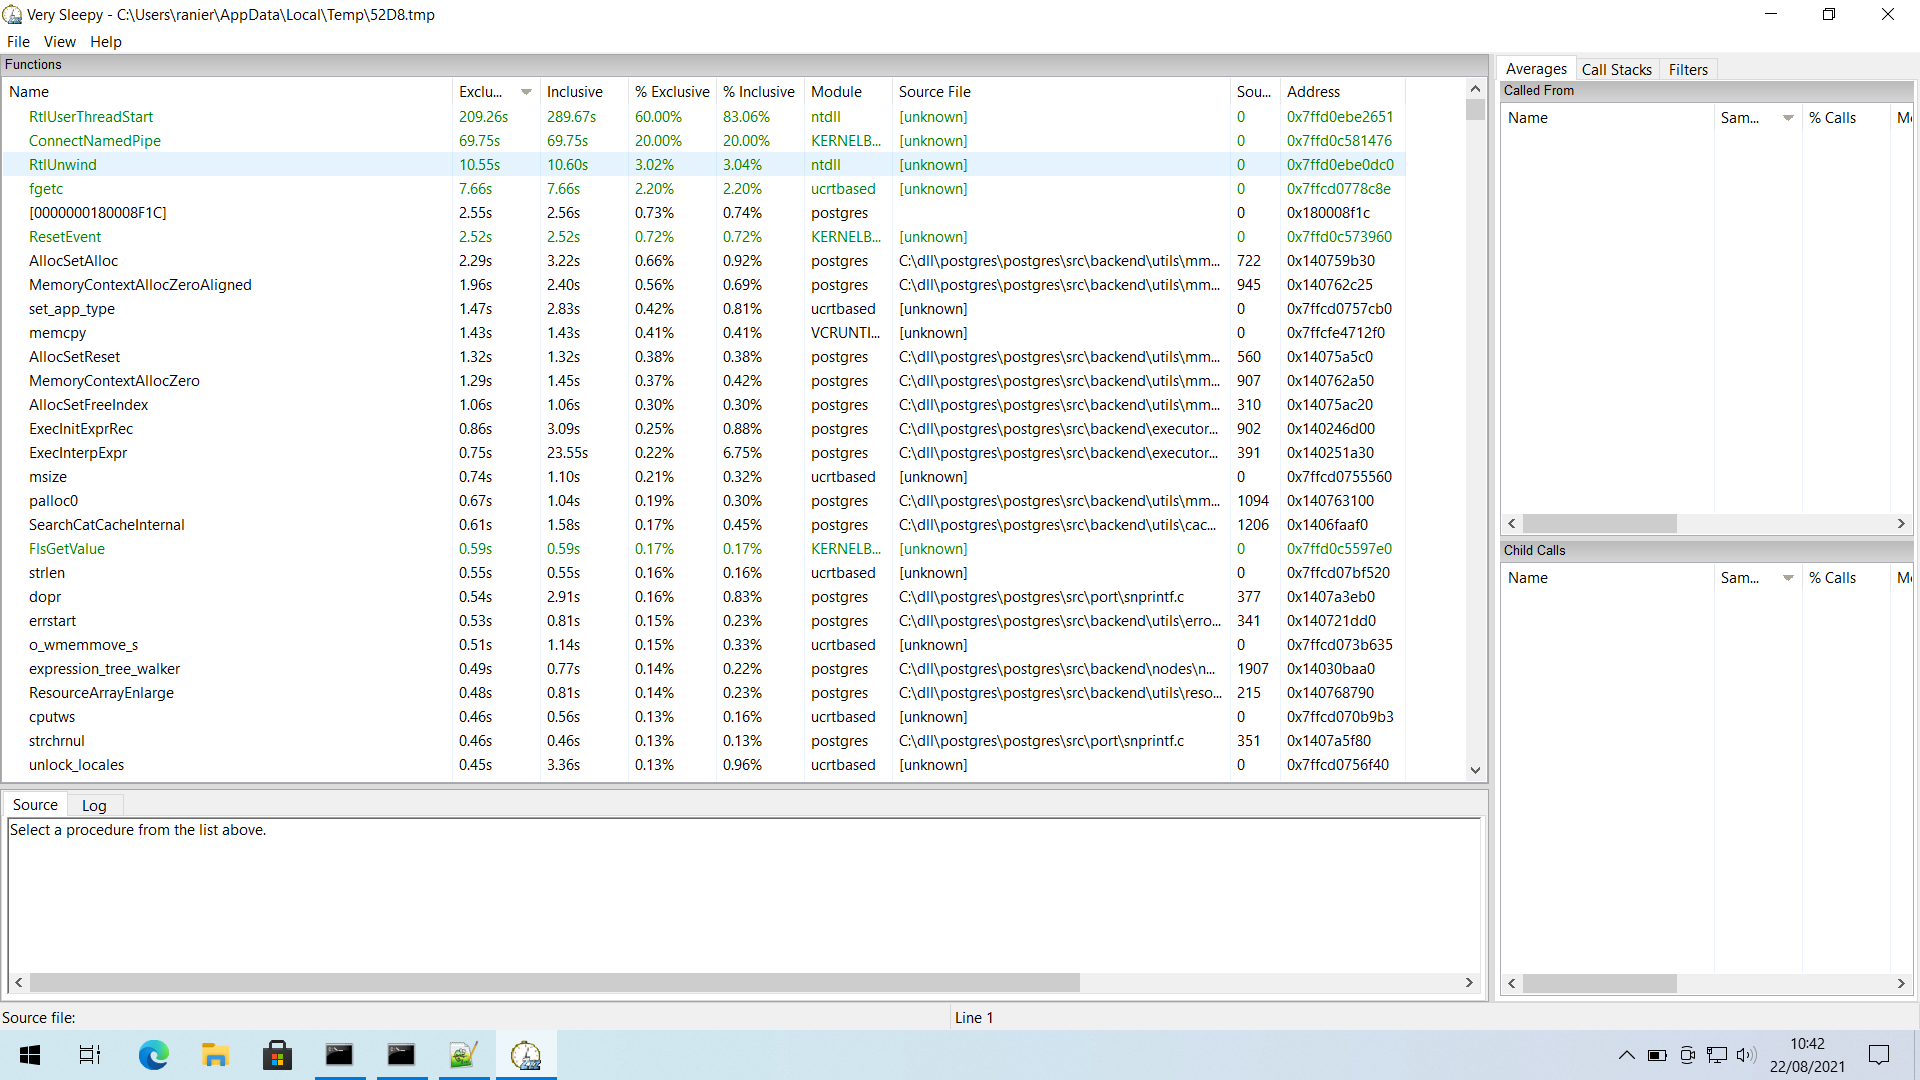
> > > Tried to check this with Very Sleepy at Windows 10 (bare metal).
> > > Not sure it can help if someone can guide how to test this better?
>
> > explain (analyze,buffers,COSTS,TIMING) select MAX(toFloat(a, null)) as
> > "a" from sampletest;
>
> Your 100sec result *seems* to reproduce the problem, but it'd be more
> clear if you showed the results of both queries (toFloat(a) vs toFloat(b)).
> Laurent's queries took 800sec vs 2sec.
>
> > postgres.png (print screen from Very Sleepy) postgres.csv
>
> This looks useful, thanks. It seems like maybe win64 builds are very slow
> running this:
>
> exec_stmt_block() /
> BeginInternalSubTransaction() /
> AbortSubTransaction() /
> reschedule_timeouts() /
> schedule_alarm() /
> setitimer() /
> pg_timer_thread() /
> WaitForSingleObjectEx ()
>
> We should confirm whether there's a dramatic regression caused by
> postgres source code (and not by compilation environment or windows
> version changes).
> Test if there's a dramatic difference between v11 and v12, or v12 and
> v13.
> To be clear, the ~4x difference in v11 between Laurent's "exceptional"
> and "nonexceptional" cases is expected. But the 400x difference in v13
> is not.
>
> If it's due to a change in postgres source code, we should find what
> commit caused the regression.
>
> First, check if v12 is affected. Right now, we know that v11.2 is ok and
> v13.4 is not ok. Then (unless someone has a hunch where to look), you
> could use git bisect to find the culprit commit.
>
> Git log shows 85 commits affecting those files across the 2 branches -
> once we determine whether v12 is affected, that alone eliminates a
> significant fraction of the commits to be checked.
>
> git log --oneline --cherry-pick
> origin/REL_11_STABLE...origin/REL_13_STABLE
> src/backend/access/transam/xact.c src/backend/port/win32/timer.c
> src/backend/utils/misc/timeout.c src/pl/plpgsql/src/pl_exec.c
>
> --
> Justin
So, I have other installs of Postgres I can also test on my laptop. No VM, straight install of Windows 10.
PostgreSQL 12.3, compiled by Visual C++ build 1914, 64-bit install
No-exceptions scenario
---------------------------------------
Aggregate (cost=14778.40..14778.41 rows=1 width=4) (actual time=1462.836..1462.837 rows=1 loops=1)
Buffers: shared hit=6379
-> Seq Scan on sampletest (cost=0.00..11975.60 rows=560560 width=32) (actual time=0.020..86.506 rows=1000000
loops=1)
Buffers: shared hit=6370
Planning Time: 0.713 ms
Execution Time: 1463.359 ms
Exceptions scenario
---------------------------------------
I canceled the query after 18mn...
PostgreSQL 11.1, compiled by Visual C++ build 1914, 64-bit
No-exceptions scenario
---------------------------------------
Aggregate (cost=14778.40..14778.41 rows=1 width=4) (actual time=1784.915..1784.915 rows=1 loops=1)
Buffers: shared hit=6377
-> Seq Scan on sampletest (cost=0.00..11975.60 rows=560560 width=32) (actual time=0.026..107.194 rows=1000000
loops=1)
Buffers: shared hit=6370
Planning Time: 0.374 ms
Execution Time: 1785.203 ms
Exceptions scenario
---------------------------------------
Aggregate (cost=14778.40..14778.41 rows=1 width=4) (actual time=33891.778..33891.778 rows=1 loops=1)
Buffers: shared hit=6372
-> Seq Scan on sampletest (cost=0.00..11975.60 rows=560560 width=32) (actual time=0.015..171.325 rows=1000000
loops=1)
Buffers: shared hit=6370
Planning Time: 0.090 ms
Execution Time: 33891.806 ms
RE: Big Performance drop of Exceptions in UDFs between V11.2 and 13.4
   >  -----Original Message-----
   >  From: Tom Lane <tgl@sss.pgh.pa.us>
   >  Sent: Sunday, August 22, 2021 13:51
   >  To: Justin Pryzby <pryzby@telsasoft.com>
   >  Cc: Ranier Vilela <ranier.vf@gmail.com>; ldh@laurent-hasson.com;
   >  pgsql-performance@postgresql.org
   >  Subject: Re: Big Performance drop of Exceptions in UDFs between V11.2
   >  and 13.4
   >
   >  Justin Pryzby <pryzby@telsasoft.com> writes:
   >  > This looks useful, thanks.  It seems like maybe win64 builds are very
   >  > slow running this:
   >
   >  > exec_stmt_block() /
   >  > BeginInternalSubTransaction() /
   >  > AbortSubTransaction() /
   >  > reschedule_timeouts() /
   >  > schedule_alarm() /
   >  > setitimer() /
   >  > pg_timer_thread() /
   >  > WaitForSingleObjectEx ()
   >
   >  Hmm ... we should not be there unless there are active timeout events,
   >  which there aren't by default.  I wonder whether either Ranier or
   >  Laurent have statement_timeout or some similar option enabled.
   >
   >  I tried setting statement_timeout = '1 min' just to see if that would affect
   >  the results.  It does, but only incrementally on my Linux box (on v13, the
   >  exception-causing query slows from ~13sec to ~14sec).  It's possible that
   >  our Windows version of
   >  setitimer() is far slower, but that doesn't make a lot of sense really --- the
   >  client side of that just briefly takes a critical section.  It shouldn't be
   >  blocking.
   >
   >  Also, the Windows version (src/backend/port/win32/timer.c) hasn't
   >  changed at all since before v11.  So even if it's slow, that doesn't tell us
   >  what changed.
   >
   >  There is a patch in v14 (09cf1d522) that drastically reduces the rate at
   >  which we make setitimer() calls, which would likely be enough to fix any
   >  performance problem that may exist here.
   >  But it's still unclear what's different between v11 and v13.
   >
   >              regards, tom lane


Hello Tom,

On both my clean 13.4 install and current 11.2 install, I have
#statement_timeout = 0            # in milliseconds, 0 is disabled

Note that the 13.4 clean install I gave last measurements for has all stock settings.

Thank you,
Laurent.
RE: Big Performance drop of Exceptions in UDFs between V11.2 and 13.4
   >  -----Original Message-----
   >  From: ldh@laurent-hasson.com <ldh@laurent-hasson.com>
   >  Sent: Sunday, August 22, 2021 14:37
   >  To: Tom Lane <tgl@sss.pgh.pa.us>; Justin Pryzby
   >  <pryzby@telsasoft.com>
   >  Cc: Ranier Vilela <ranier.vf@gmail.com>; pgsql-
   >  performance@postgresql.org
   >  Subject: RE: Big Performance drop of Exceptions in UDFs between V11.2
   >  and 13.4
   >
   >
   >
   >     >  -----Original Message-----
   >     >  From: Tom Lane <tgl@sss.pgh.pa.us>
   >     >  Sent: Sunday, August 22, 2021 13:51
   >     >  To: Justin Pryzby <pryzby@telsasoft.com>
   >     >  Cc: Ranier Vilela <ranier.vf@gmail.com>; ldh@laurent-hasson.com;
   >     >  pgsql-performance@postgresql.org
   >     >  Subject: Re: Big Performance drop of Exceptions in UDFs between
   >  V11.2
   >     >  and 13.4
   >     >
   >     >  Justin Pryzby <pryzby@telsasoft.com> writes:
   >     >  > This looks useful, thanks.  It seems like maybe win64 builds are
   >  very
   >     >  > slow running this:
   >     >
   >     >  > exec_stmt_block() /
   >     >  > BeginInternalSubTransaction() /
   >     >  > AbortSubTransaction() /
   >     >  > reschedule_timeouts() /
   >     >  > schedule_alarm() /
   >     >  > setitimer() /
   >     >  > pg_timer_thread() /
   >     >  > WaitForSingleObjectEx ()
   >     >
   >     >  Hmm ... we should not be there unless there are active timeout
   >  events,
   >     >  which there aren't by default.  I wonder whether either Ranier or
   >     >  Laurent have statement_timeout or some similar option enabled.
   >     >
   >     >  I tried setting statement_timeout = '1 min' just to see if that would
   >  affect
   >     >  the results.  It does, but only incrementally on my Linux box (on v13,
   >  the
   >     >  exception-causing query slows from ~13sec to ~14sec).  It's possible
   >  that
   >     >  our Windows version of
   >     >  setitimer() is far slower, but that doesn't make a lot of sense really ---
   >  the
   >     >  client side of that just briefly takes a critical section.  It shouldn't be
   >     >  blocking.
   >     >
   >     >  Also, the Windows version (src/backend/port/win32/timer.c) hasn't
   >     >  changed at all since before v11.  So even if it's slow, that doesn't tell
   >  us
   >     >  what changed.
   >     >
   >     >  There is a patch in v14 (09cf1d522) that drastically reduces the rate
   >  at
   >     >  which we make setitimer() calls, which would likely be enough to fix
   >  any
   >     >  performance problem that may exist here.
   >     >  But it's still unclear what's different between v11 and v13.
   >     >
   >     >              regards, tom lane
   >
   >
   >  Hello Tom,
   >
   >  On both my clean 13.4 install and current 11.2 install, I have
   >  #statement_timeout = 0            # in milliseconds, 0 is
   >  disabled
   >
   >  Note that the 13.4 clean install I gave last measurements for has all stock
   >  settings.
   >
   >  Thank you,
   >  Laurent.
   >
   >

One more fresh install, of 11.13 this time and the issue is not there... 😊

Aggregate  (cost=14778.40..14778.41 rows=1 width=4) (actual time=1963.573..1963.574 rows=1 loops=1)
  Buffers: shared hit=6377
  ->  Seq Scan on sampletest  (cost=0.00..11975.60 rows=560560 width=32) (actual time=0.027..110.896 rows=1000000
loops=1)
        Buffers: shared hit=6370
Planning Time: 0.427 ms
Execution Time: 1963.981 ms


Aggregate  (cost=21370.00..21370.01 rows=1 width=4) (actual time=31685.853..31685.853 rows=1 loops=1)
  Buffers: shared hit=6370
  ->  Seq Scan on sampletest  (cost=0.00..16370.00 rows=1000000 width=15) (actual time=0.029..180.664 rows=1000000
loops=1)
        Buffers: shared hit=6370
Planning Time: 0.092 ms
Execution Time: 31685.904 ms

I am still experiencing a larger slowdown in the "with-exceptions" scenario being 16x slower compared to other
measurementsyou have all produced.. But at least, it's manageable compared to the multi 100x times.


So, now, in summary:

- I have tried V13.4, V12.3, 11.13, 11.2, 11.1 on several Windows VMs and my personal laptop (no VM).
- All V11.x seem to behave uniformly.
- Starting with 12.3, I am experiencing the major slowdown in the "with exceptions" scenario.


So, I was thinking about stuff and a lot of your intuitions seem to drive towards an issue with the compiler used to
compilethe Winx64 version... But is it possible that the JIT is getting in there and making things weird? Given that
it'sa major change in V12 and this is when I am starting to see the issue popup, I figured it might be another avenue
tolook into?


Thank you,
Laurent Hasson.
"ldh@laurent-hasson.com" <ldh@laurent-hasson.com> writes:
> So, now, in summary:

> - I have tried V13.4, V12.3, 11.13, 11.2, 11.1 on several Windows VMs and my personal laptop (no VM).
> - All V11.x seem to behave uniformly.
> - Starting with 12.3, I am experiencing the major slowdown in the "with exceptions" scenario.

Interesting.  There's no meaningful difference between v11 and v12 as far
as timeout handling goes, so I'm starting to think that that's a red
herring.

(Although, after having done some web-searching, I do wonder why timer.c
is using a manual-reset event.  It looks like auto-reset would work
just as well with less code, and I found some suggestions that it might
perform better.)

> So, I was thinking about stuff and a lot of your intuitions seem to drive towards an issue with the compiler used to
compilethe Winx64 version... But is it possible that the JIT is getting in there and making things weird? Given that
it'sa major change in V12 and this is when I am starting to see the issue popup, I figured it might be another avenue
tolook into?

Hm, is JIT even enabled in your build?  If so, does setting jit = 0
change anything?

            regards, tom lane
RE: Big Performance drop of Exceptions in UDFs between V11.2 and 13.4
   >  -----Original Message-----
   >  From: Tom Lane <tgl@sss.pgh.pa.us>
   >  Sent: Sunday, August 22, 2021 15:24
   >  To: ldh@laurent-hasson.com
   >  Cc: Justin Pryzby <pryzby@telsasoft.com>; Ranier Vilela
   >  <ranier.vf@gmail.com>; pgsql-performance@postgresql.org
   >  Subject: Re: Big Performance drop of Exceptions in UDFs between V11.2
   >  and 13.4
   >
   >  "ldh@laurent-hasson.com" <ldh@laurent-hasson.com> writes:
   >  > So, now, in summary:
   >
   >  > - I have tried V13.4, V12.3, 11.13, 11.2, 11.1 on several Windows VMs
   >  and my personal laptop (no VM).
   >  > - All V11.x seem to behave uniformly.
   >  > - Starting with 12.3, I am experiencing the major slowdown in the
   >  "with exceptions" scenario.
   >
   >  Interesting.  There's no meaningful difference between v11 and v12 as
   >  far as timeout handling goes, so I'm starting to think that that's a red
   >  herring.
   >
   >  (Although, after having done some web-searching, I do wonder why
   >  timer.c is using a manual-reset event.  It looks like auto-reset would
   >  work just as well with less code, and I found some suggestions that it
   >  might perform better.)
   >
   >  > So, I was thinking about stuff and a lot of your intuitions seem to drive
   >  towards an issue with the compiler used to compile the Winx64
   >  version... But is it possible that the JIT is getting in there and making
   >  things weird? Given that it's a major change in V12 and this is when I am
   >  starting to see the issue popup, I figured it might be another avenue to
   >  look into?
   >
   >  Hm, is JIT even enabled in your build?  If so, does setting jit = 0 change
   >  anything?
   >
   >              regards, tom lane

Hello Tom,

I just ran the test with jit=off in the config and restated the server. No change on 13.4. I'd think that the query
costas per the planner would be too small to kick in the JIT but thought to check anyways. Doesn't seem to be the
cause.

Thanks.,
Laurent.
RE: Big Performance drop of Exceptions in UDFs between V11.2 and 13.4
   >  -----Original Message-----
   >  From: ldh@laurent-hasson.com <ldh@laurent-hasson.com>
   >  Sent: Sunday, August 22, 2021 15:29
   >  To: Tom Lane <tgl@sss.pgh.pa.us>
   >  Cc: Justin Pryzby <pryzby@telsasoft.com>; Ranier Vilela
   >  <ranier.vf@gmail.com>; pgsql-performance@postgresql.org
   >  Subject: RE: Big Performance drop of Exceptions in UDFs between V11.2
   >  and 13.4
   >
   >
   >
   >     >  -----Original Message-----
   >     >  From: Tom Lane <tgl@sss.pgh.pa.us>
   >     >  Sent: Sunday, August 22, 2021 15:24
   >     >  To: ldh@laurent-hasson.com
   >     >  Cc: Justin Pryzby <pryzby@telsasoft.com>; Ranier Vilela
   >     >  <ranier.vf@gmail.com>; pgsql-performance@postgresql.org
   >     >  Subject: Re: Big Performance drop of Exceptions in UDFs between
   >  V11.2
   >     >  and 13.4
   >     >
   >     >  "ldh@laurent-hasson.com" <ldh@laurent-hasson.com> writes:
   >     >  > So, now, in summary:
   >     >
   >     >  > - I have tried V13.4, V12.3, 11.13, 11.2, 11.1 on several Windows
   >  VMs
   >     >  and my personal laptop (no VM).
   >     >  > - All V11.x seem to behave uniformly.
   >     >  > - Starting with 12.3, I am experiencing the major slowdown in the
   >     >  "with exceptions" scenario.
   >     >
   >     >  Interesting.  There's no meaningful difference between v11 and v12
   >  as
   >     >  far as timeout handling goes, so I'm starting to think that that's a red
   >     >  herring.
   >     >
   >     >  (Although, after having done some web-searching, I do wonder why
   >     >  timer.c is using a manual-reset event.  It looks like auto-reset would
   >     >  work just as well with less code, and I found some suggestions that it
   >     >  might perform better.)
   >     >
   >     >  > So, I was thinking about stuff and a lot of your intuitions seem to
   >  drive
   >     >  towards an issue with the compiler used to compile the Winx64
   >     >  version... But is it possible that the JIT is getting in there and making
   >     >  things weird? Given that it's a major change in V12 and this is when I
   >  am
   >     >  starting to see the issue popup, I figured it might be another avenue
   >  to
   >     >  look into?
   >     >
   >     >  Hm, is JIT even enabled in your build?  If so, does setting jit = 0
   >  change
   >     >  anything?
   >     >
   >     >              regards, tom lane
   >
   >  Hello Tom,
   >
   >  I just ran the test with jit=off in the config and restated the server. No
   >  change on 13.4. I'd think that the query cost as per the planner would be
   >  too small to kick in the JIT but thought to check anyways. Doesn't seem
   >  to be the cause.
   >
   >  Thanks.,
   >  Laurent.
   >
   >
   >
   >


Also Tom,

I do have a Linux install of 13.3, and things work beautifully, so this is definitely a Windows thing here that started
inV12.

No exceptions
-----------------------------
Aggregate  (cost=21370.00..21370.01 rows=1 width=4) (actual time=1796.311..1796.313 rows=1 loops=1)
  Buffers: shared hit=6370
  ->  Seq Scan on sampletest  (cost=0.00..16370.00 rows=1000000 width=8) (actual time=0.006..113.720 rows=1000000
loops=1)
        Buffers: shared hit=6370
Planning:
  Buffers: shared hit=5
Planning Time: 0.121 ms
Execution Time: 1796.346 ms

With Exceptions
------------------------------
Aggregate  (cost=14778.40..14778.41 rows=1 width=4) (actual time=6355.051..6355.052 rows=1 loops=1)
  Buffers: shared hit=6373
  ->  Seq Scan on sampletest  (cost=0.00..11975.60 rows=560560 width=32) (actual time=0.011..163.499 rows=1000000
loops=1)
        Buffers: shared hit=6370
Planning Time: 0.064 ms
Execution Time: 6355.077 ms
"ldh@laurent-hasson.com" <ldh@laurent-hasson.com> writes:
> I do have a Linux install of 13.3, and things work beautifully, so this is definitely a Windows thing here that
startedin V12.

It's good to have a box around it, but that's still a pretty large
box :-(.

I'm hoping that one of our Windows-using developers will see if
they can reproduce this, and if so, try to bisect where it started.
Not sure how to make further progress without that.

            regards, tom lane
RE: Big Performance drop of Exceptions in UDFs between V11.2 and 13.4
   >  -----Original Message-----
   >  From: Tom Lane <tgl@sss.pgh.pa.us>
   >  Sent: Sunday, August 22, 2021 16:11
   >  To: ldh@laurent-hasson.com
   >  Cc: Justin Pryzby <pryzby@telsasoft.com>; Ranier Vilela
   >  <ranier.vf@gmail.com>; pgsql-performance@postgresql.org
   >  Subject: Re: Big Performance drop of Exceptions in UDFs between V11.2
   >  and 13.4
   >
   >  "ldh@laurent-hasson.com" <ldh@laurent-hasson.com> writes:
   >  > I do have a Linux install of 13.3, and things work beautifully, so this is
   >  definitely a Windows thing here that started in V12.
   >
   >  It's good to have a box around it, but that's still a pretty large box :-(.
   >
   >  I'm hoping that one of our Windows-using developers will see if they can
   >  reproduce this, and if so, try to bisect where it started.
   >  Not sure how to make further progress without that.
   >
   >              regards, tom lane

Hello Tom,

If there is any way I can help further... I am definitely not able to do a dev environment and local build, but if we
havea windows developer reproducing the issue between 11 and 12, then that should help. If someone makes a debug build
availableto me, I can provide additional help based on that.

That being said, do you have any suggestion how I could circumvent the issue altogether? Is there a way I could convert
aString to some type (integer, float, date...) without exceptions and in case of failure, return a default value? Maybe
thereis a way to do this and I can avoid exception handling altogether? Or use something else than plpgsql? I am always
underthe impression that plpgsql is the best performing option?

I have seen regex-based options out there, but none being fully satisfying for floating points in particular.

Thank you,
Laurent.
On 8/22/21 4:11 PM, Tom Lane wrote:
> "ldh@laurent-hasson.com" <ldh@laurent-hasson.com> writes:
>> I do have a Linux install of 13.3, and things work beautifully, so this is definitely a Windows thing here that
startedin V12.

> It's good to have a box around it, but that's still a pretty large
> box :-(.
>
> I'm hoping that one of our Windows-using developers will see if
> they can reproduce this, and if so, try to bisect where it started.
> Not sure how to make further progress without that.
>
>


Can do. Assuming the assertion that it started in Release 12 is correct,
I should be able to find it by bisecting between the branch point for 12
and the tip of that branch. That's a little over 20 probes by my
calculation.


cheers


andrew


--
Andrew Dunstan
EDB: https://www.enterprisedb.com
RE: Big Performance drop of Exceptions in UDFs between V11.2 and 13.4
   >  -----Original Message-----
   >  From: Andrew Dunstan <andrew@dunslane.net>
   >  Sent: Sunday, August 22, 2021 17:27
   >  To: Tom Lane <tgl@sss.pgh.pa.us>; ldh@laurent-hasson.com
   >  Cc: Justin Pryzby <pryzby@telsasoft.com>; Ranier Vilela
   >  <ranier.vf@gmail.com>; pgsql-performance@postgresql.org
   >  Subject: Re: Big Performance drop of Exceptions in UDFs between V11.2
   >  and 13.4
   >
   >
   >  On 8/22/21 4:11 PM, Tom Lane wrote:
   >  > "ldh@laurent-hasson.com" <ldh@laurent-hasson.com> writes:
   >  >> I do have a Linux install of 13.3, and things work beautifully, so this is
   >  definitely a Windows thing here that started in V12.
   >  > It's good to have a box around it, but that's still a pretty large box
   >  > :-(.
   >  >
   >  > I'm hoping that one of our Windows-using developers will see if they
   >  > can reproduce this, and if so, try to bisect where it started.
   >  > Not sure how to make further progress without that.
   >  >
   >  >
   >
   >
   >  Can do. Assuming the assertion that it started in Release 12 is correct, I
   >  should be able to find it by bisecting between the branch point for 12
   >  and the tip of that branch. That's a little over 20 probes by my
   >  calculation.
   >
   >
   >  cheers
   >
   >
   >  andrew
   >
   >
   >  --
   >  Andrew Dunstan
   >  EDB: https://www.enterprisedb.com


I tried it on 11.13 and 12.3. Is there a place where I could download 12.1 and 12.2 and test that? Is it worth it or
youthink you have all you need?


Thanks,
Laurent.
On 8/22/21 5:59 PM, ldh@laurent-hasson.com wrote:
>
>    >  -----Original Message-----
>    >  From: Andrew Dunstan <andrew@dunslane.net>
>    >  Sent: Sunday, August 22, 2021 17:27
>    >  To: Tom Lane <tgl@sss.pgh.pa.us>; ldh@laurent-hasson.com
>    >  Cc: Justin Pryzby <pryzby@telsasoft.com>; Ranier Vilela
>    >  <ranier.vf@gmail.com>; pgsql-performance@postgresql.org
>    >  Subject: Re: Big Performance drop of Exceptions in UDFs between V11.2
>    >  and 13.4
>    >
>    >
>    >  On 8/22/21 4:11 PM, Tom Lane wrote:
>    >  > "ldh@laurent-hasson.com" <ldh@laurent-hasson.com> writes:
>    >  >> I do have a Linux install of 13.3, and things work beautifully, so this is
>    >  definitely a Windows thing here that started in V12.
>    >  > It's good to have a box around it, but that's still a pretty large box
>    >  > :-(.
>    >  >
>    >  > I'm hoping that one of our Windows-using developers will see if they
>    >  > can reproduce this, and if so, try to bisect where it started.
>    >  > Not sure how to make further progress without that.
>    >  >
>    >  >
>    >
>    >
>    >  Can do. Assuming the assertion that it started in Release 12 is correct, I
>    >  should be able to find it by bisecting between the branch point for 12
>    >  and the tip of that branch. That's a little over 20 probes by my
>    >  calculation.
>    >
>    >
>    >  cheers
>    >
>    >
>    >  andrew
>    >
>    >
>    >  --
>    >  Andrew Dunstan
>    >  EDB: https://www.enterprisedb.com
>
>
> I tried it on 11.13 and 12.3. Is there a place where I could download 12.1 and 12.2 and test that? Is it worth it or
youthink you have all you need?

>


I think I have everything I need.


Step one will be to verify that the difference exists between the branch
point and the tip of release 12. Once that's done it will be a matter of
probing until the commit at fault is identified.


cheers


andrew


--
Andrew Dunstan
EDB: https://www.enterprisedb.com
> -----Original Message-----
> From: Tom Lane <tgl@sss.pgh.pa.us>
> Sent: Sunday, August 22, 2021 16:11
> To: ldh@laurent-hasson.com
> Cc: Justin Pryzby <pryzby@telsasoft.com>; Ranier Vilela
> <ranier.vf@gmail.com>; pgsql-performance@postgresql.org
> Subject: Re: Big Performance drop of Exceptions in UDFs between V11.2
> and 13.4
>
> "ldh@laurent-hasson.com" <ldh@laurent-hasson.com> writes:
> > I do have a Linux install of 13.3, and things work beautifully, so this is
> definitely a Windows thing here that started in V12.
>
> It's good to have a box around it, but that's still a pretty large box :-(.
>
> I'm hoping that one of our Windows-using developers will see if they can
> reproduce this, and if so, try to bisect where it started.
> Not sure how to make further progress without that.
>
> regards, tom lane
Hello Tom,
If there is any way I can help further... I am definitely not able to do a dev environment and local build, but if we have a windows developer reproducing the issue between 11 and 12, then that should help. If someone makes a debug build available to me, I can provide additional help based on that.
RE: Big Performance drop of Exceptions in UDFs between V11.2 and 13.4
   >  -----Original Message-----
   >  From: Justin Pryzby <pryzby@telsasoft.com>
   >  Sent: Sunday, August 22, 2021 20:43
   >  To: Ranier Vilela <ranier.vf@gmail.com>
   >  Cc: ldh@laurent-hasson.com; Tom Lane <tgl@sss.pgh.pa.us>; pgsql-
   >  performance@postgresql.org
   >  Subject: Re: Big Performance drop of Exceptions in UDFs between V11.2
   >  and 13.4
   >
   >  On Sun, Aug 22, 2021 at 08:44:34PM -0300, Ranier Vilela wrote:
   >  > > If there is any way I can help further... I am definitely not able
   >  > > to do a dev environment and local build, but if we have a windows
   >  > > developer reproducing the issue between 11 and 12, then that
   >  should
   >  > > help. If someone makes a debug build available to me, I can provide
   >  > > additional help based on that.
   >  >
   >  > Please, download from this link (Google Drive):
   >  >
   >  > https://drive.google.com/file/d/13kPbNmk54lR6t-lwcwi-
   >  63UdM55sA27t/view
   >  > ?usp=sharing
   >
   >  Laurent gave a recipe to reproduce the problem, and you seemed to be
   >  able to reproduce it, so I think Laurent's part is done.  The burden now
   >  lies with postgres developers to isolate the issue, and Andrew said he
   >  would bisect to look for the culprit commit.
   >
   >  --
   >  Justin


Hello Ranier,
I am not sure what to do with that build. I am a Java/JavaScript guy these days. I haven't coded C/C++ in over 15 years
nowand I don't have a debugging environment 😊 If I can run the scenario I created and get a log file, that I can do if
thathelps.


Justin, I think I agree with you although I am concerned that none of you were able to truly reproduce the results I
havenow reproduced on plain base-line installs on 2 VMs (Windows Server 2012) and a laptop (Windows 10 pro), across
multipleversions of the installer (11, 12 and 13).


In any case, i'll do my best to help. If you think you have a fix and it's in one dll or exe and I can just manually
patcha 13.4 install and test again, I'll do that with pleasure.


Thank you,
Laurent.
RE: Big Performance drop of Exceptions in UDFs between V11.2 and 13.4
Hello all,

Any update on this issue?

Thank you!
Laurent.

   >  -----Original Message-----
   >  From: ldh@laurent-hasson.com <ldh@laurent-hasson.com>
   >  Sent: Sunday, August 22, 2021 23:23
   >  To: Justin Pryzby <pryzby@telsasoft.com>; Ranier Vilela
   >  <ranier.vf@gmail.com>
   >  Cc: Tom Lane <tgl@sss.pgh.pa.us>; pgsql-performance@postgresql.org
   >  Subject: RE: Big Performance drop of Exceptions in UDFs between V11.2
   >  and 13.4
   >
   >
   >
   >     >  -----Original Message-----
   >     >  From: Justin Pryzby <pryzby@telsasoft.com>
   >     >  Sent: Sunday, August 22, 2021 20:43
   >     >  To: Ranier Vilela <ranier.vf@gmail.com>
   >     >  Cc: ldh@laurent-hasson.com; Tom Lane <tgl@sss.pgh.pa.us>; pgsql-
   >     >  performance@postgresql.org
   >     >  Subject: Re: Big Performance drop of Exceptions in UDFs between
   >  V11.2
   >     >  and 13.4
   >     >
   >     >  On Sun, Aug 22, 2021 at 08:44:34PM -0300, Ranier Vilela wrote:
   >     >  > > If there is any way I can help further... I am definitely not able
   >     >  > > to do a dev environment and local build, but if we have a
   >  windows
   >     >  > > developer reproducing the issue between 11 and 12, then that
   >     >  should
   >     >  > > help. If someone makes a debug build available to me, I can
   >  provide
   >     >  > > additional help based on that.
   >     >  >
   >     >  > Please, download from this link (Google Drive):
   >     >  >
   >     >  > https://drive.google.com/file/d/13kPbNmk54lR6t-lwcwi-
   >     >  63UdM55sA27t/view
   >     >  > ?usp=sharing
   >     >
   >     >  Laurent gave a recipe to reproduce the problem, and you seemed to
   >  be
   >     >  able to reproduce it, so I think Laurent's part is done.  The burden
   >  now
   >     >  lies with postgres developers to isolate the issue, and Andrew said
   >  he
   >     >  would bisect to look for the culprit commit.
   >     >
   >     >  --
   >     >  Justin
   >
   >
   >  Hello Ranier,
   >  I am not sure what to do with that build. I am a Java/JavaScript guy
   >  these days. I haven't coded C/C++ in over 15 years now and I don't have
   >  a debugging environment 😊 If I can run the scenario I created and get a
   >  log file, that I can do if that helps.
   >
   >  Justin, I think I agree with you although I am concerned that none of you
   >  were able to truly reproduce the results I have now reproduced on plain
   >  base-line installs on 2 VMs (Windows Server 2012) and a laptop
   >  (Windows 10 pro), across multiple versions of the installer (11, 12 and
   >  13).
   >
   >  In any case, i'll do my best to help. If you think you have a fix and it's in
   >  one dll or exe and I can just manually patch a 13.4 install and test again,
   >  I'll do that with pleasure.
   >
   >  Thank you,
   >  Laurent.
   >
On 8/26/21 10:47 AM, ldh@laurent-hasson.com wrote:
> Hello all,
>
> Any update on this issue?


Please don't top-post.


We are working on the issue. Please be patient.


cheers


andrew

--
Andrew Dunstan
EDB: https://www.enterprisedb.com
RE: Big Performance drop of Exceptions in UDFs between V11.2 and 13.4
   >  -----Original Message-----
   >  From: Andrew Dunstan <andrew@dunslane.net>
   >  Sent: Thursday, August 26, 2021 12:39
   >  To: ldh@laurent-hasson.com; Justin Pryzby <pryzby@telsasoft.com>;
   >  Ranier Vilela <ranier.vf@gmail.com>
   >  Cc: Tom Lane <tgl@sss.pgh.pa.us>; pgsql-performance@postgresql.org
   >  Subject: Re: Big Performance drop of Exceptions in UDFs between V11.2
   >  and 13.4
   >
   >
   >  On 8/26/21 10:47 AM, ldh@laurent-hasson.com wrote:
   >  > Hello all,
   >  >
   >  > Any update on this issue?
   >
   >
   >
   >  Please don't top-post.
   >
   >
   >  We are working on the issue. Please be patient.
   >
   >
   >  cheers
   >
   >
   >  andrew
   >
   >  --
   >  Andrew Dunstan
   >  EDB: https://www.enterprisedb.com


OK... Outlook automatically top posts and I forgot.

I am being patient.

Thanks,
Laurent.
"ldh@laurent-hasson.com" <ldh@laurent-hasson.com> writes:
> That being said, do you have any suggestion how I could circumvent the
> issue altogether?

Based on Andrew's report, it seems like you might be able to work around
it for the time being by disabling message translations, i.e.
    SET lc_messages = 'C';
Even if that's not acceptable in your work environment, it would be useful
to verify that you see an improvement from it.

            regards, tom lane
RE: Big Performance drop of Exceptions in UDFs between V11.2 and 13.4
   >  -----Original Message-----
   >  From: Tom Lane <tgl@sss.pgh.pa.us>
   >  Sent: Friday, August 27, 2021 13:43
   >  To: ldh@laurent-hasson.com
   >  Cc: Justin Pryzby <pryzby@telsasoft.com>; Ranier Vilela
   >  <ranier.vf@gmail.com>; pgsql-performance@postgresql.org
   >  Subject: Re: Big Performance drop of Exceptions in UDFs between V11.2
   >  and 13.4
   >
   >  "ldh@laurent-hasson.com" <ldh@laurent-hasson.com> writes:
   >  > That being said, do you have any suggestion how I could circumvent
   >  the
   >  > issue altogether?
   >
   >  Based on Andrew's report, it seems like you might be able to work
   >  around it for the time being by disabling message translations, i.e.
   >      SET lc_messages = 'C';
   >  Even if that's not acceptable in your work environment, it would be
   >  useful to verify that you see an improvement from it.
   >
   >              regards, tom lane


SET lc_messages = 'C';
drop table sampletest;
create table sampletest (a varchar, b varchar);
insert into sampletest (a, b)
select substr(md5(random()::text), 0, 15), (100000000*random())::integer::varchar
  from generate_series(1,100000);

CREATE OR REPLACE FUNCTION toFloat(str varchar, val real)
RETURNS real AS $$
BEGIN
  RETURN case when str is null then val else str::real end;
EXCEPTION WHEN OTHERS THEN
  RETURN val;
END;
$$ LANGUAGE plpgsql COST 1 IMMUTABLE;

show lc_messages; -- OK 'C'
RE: Big Performance drop of Exceptions in UDFs between V11.2 and 13.4
   >  -----Original Message-----
   >  From: Tom Lane <tgl@sss.pgh.pa.us>
   >  Sent: Friday, August 27, 2021 13:43
   >  To: ldh@laurent-hasson.com
   >  Cc: Justin Pryzby <pryzby@telsasoft.com>; Ranier Vilela
   >  <ranier.vf@gmail.com>; pgsql-performance@postgresql.org
   >  Subject: Re: Big Performance drop of Exceptions in UDFs between V11.2
   >  and 13.4
   >
   >  "ldh@laurent-hasson.com" <ldh@laurent-hasson.com> writes:
   >  > That being said, do you have any suggestion how I could circumvent
   >  the
   >  > issue altogether?
   >
   >  Based on Andrew's report, it seems like you might be able to work
   >  around it for the time being by disabling message translations, i.e.
   >      SET lc_messages = 'C';
   >  Even if that's not acceptable in your work environment, it would be
   >  useful to verify that you see an improvement from it.
   >
   >              regards, tom lane

Hello Tom.... hit the send button accidentally.


SET lc_messages = 'C';
drop table sampletest;
create table sampletest (a varchar, b varchar);
insert into sampletest (a, b)
select substr(md5(random()::text), 0, 15), (100000000*random())::integer::varchar
  from generate_series(1,100000);

CREATE OR REPLACE FUNCTION toFloat(str varchar, val real)
RETURNS real AS $$
BEGIN
  RETURN case when str is null then val else str::real end;
EXCEPTION WHEN OTHERS THEN
  RETURN val;
END;
$$ LANGUAGE plpgsql COST 1 IMMUTABLE;

show lc_messages; --> OK 'C'

explain (analyze,buffers,COSTS,TIMING)
select MAX(toFloat(b, null)) as "b" from sampletest

Aggregate  (cost=2137.00..2137.01 rows=1 width=4) (actual time=175.551..175.552 rows=1 loops=1)
  Buffers: shared hit=637
  ->  Seq Scan on sampletest  (cost=0.00..1637.00 rows=100000 width=8) (actual time=0.014..9.270 rows=100000 loops=1)
        Buffers: shared hit=637
Planning Time: 0.087 ms
Execution Time: 175.600 ms


explain (analyze,buffers,COSTS,TIMING)
select MAX(toFloat(a, null)) as "a" from sampletest

Aggregate  (cost=2137.00..2137.01 rows=1 width=4) (actual time=88031.549..88031.551 rows=1 loops=1)
  Buffers: shared hit=637
  ->  Seq Scan on sampletest  (cost=0.00..1637.00 rows=100000 width=15) (actual time=0.008..34.494 rows=100000 loops=1)
        Buffers: shared hit=637
Planning:
  Buffers: shared hit=4
Planning Time: 0.171 ms
Execution Time: 88031.585 ms

Doesn't seem to make a difference unless I misunderstood what you were asking for regarding the locale?

Thank you,
Laurent.
"ldh@laurent-hasson.com" <ldh@laurent-hasson.com> writes:
> SET lc_messages = 'C';
> show lc_messages; --> OK 'C'

> explain (analyze,buffers,COSTS,TIMING)
> select MAX(toFloat(b, null)) as "b" from sampletest
> ...
> Execution Time: 175.600 ms

> explain (analyze,buffers,COSTS,TIMING)
> select MAX(toFloat(a, null)) as "a" from sampletest
> ...
> Execution Time: 88031.585 ms

> Doesn't seem to make a difference unless I misunderstood what you were asking for regarding the locale?

Hmm.  This suggests that whatever effect Andrew found with NLS
is actually not the explanation for your problem.  So I'm even
more confused than before.

            regards, tom lane
RE: Big Performance drop of Exceptions in UDFs between V11.2 and 13.4
   >  -----Original Message-----
   >  From: Tom Lane <tgl@sss.pgh.pa.us>
   >  Sent: Saturday, August 28, 2021 15:51
   >  To: ldh@laurent-hasson.com
   >  Cc: Andrew Dunstan <andrew@dunslane.net>; Justin Pryzby
   >  <pryzby@telsasoft.com>; Ranier Vilela <ranier.vf@gmail.com>; pgsql-
   >  performance@postgresql.org
   >  Subject: Re: Big Performance drop of Exceptions in UDFs between V11.2
   >  and 13.4
   >
   >  "ldh@laurent-hasson.com" <ldh@laurent-hasson.com> writes:
   >  > SET lc_messages = 'C';
   >  > show lc_messages; --> OK 'C'
   >
   >  > explain (analyze,buffers,COSTS,TIMING) select MAX(toFloat(b, null)) as
   >  > "b" from sampletest ...
   >  > Execution Time: 175.600 ms
   >
   >  > explain (analyze,buffers,COSTS,TIMING) select MAX(toFloat(a, null)) as
   >  > "a" from sampletest ...
   >  > Execution Time: 88031.585 ms
   >
   >  > Doesn't seem to make a difference unless I misunderstood what you
   >  were asking for regarding the locale?
   >
   >  Hmm.  This suggests that whatever effect Andrew found with NLS is
   >  actually not the explanation for your problem.  So I'm even more
   >  confused than before.
   >
   >              regards, tom lane

I am so sorry to hear... So, curious on my end: is this something that you are not able to reproduce on your
environments?On my end, I did reproduce it on different VMs and my local laptop, across windows Server 2012 and Windows
10,so I'd figure it would be pretty easy to reproduce?

Thank you!
Laurent.
> -----Original Message-----
> From: Tom Lane <tgl@sss.pgh.pa.us>
> Sent: Saturday, August 28, 2021 15:51
> To: ldh@laurent-hasson.com
> Cc: Andrew Dunstan <andrew@dunslane.net>; Justin Pryzby
> <pryzby@telsasoft.com>; Ranier Vilela <ranier.vf@gmail.com>; pgsql-
> performance@postgresql.org
> Subject: Re: Big Performance drop of Exceptions in UDFs between V11.2
> and 13.4
>
> "ldh@laurent-hasson.com" <ldh@laurent-hasson.com> writes:
> > SET lc_messages = 'C';
> > show lc_messages; --> OK 'C'
>
> > explain (analyze,buffers,COSTS,TIMING) select MAX(toFloat(b, null)) as
> > "b" from sampletest ...
> > Execution Time: 175.600 ms
>
> > explain (analyze,buffers,COSTS,TIMING) select MAX(toFloat(a, null)) as
> > "a" from sampletest ...
> > Execution Time: 88031.585 ms
>
> > Doesn't seem to make a difference unless I misunderstood what you
> were asking for regarding the locale?
>
> Hmm. This suggests that whatever effect Andrew found with NLS is
> actually not the explanation for your problem. So I'm even more
> confused than before.
>
> regards, tom lane
I am so sorry to hear... So, curious on my end: is this something that you are not able to reproduce on your environments? On my end, I did reproduce it on different VMs and my local laptop, across windows Server 2012 and Windows 10, so I'd figure it would be pretty easy to reproduce?
Can you tell how many commits there are between the affected versions?
CREATE TABLE
postgres=# insert into sampletest (a, b)
postgres-# select substr(md5(random()::text), 0, 15), (100000000*random())::integer::varchar
postgres-# from generate_series(1,100000);
INSERT 0 100000
postgres=#
postgres=# CREATE OR REPLACE FUNCTION toFloat(str varchar, val real)
postgres-# RETURNS real AS $$
postgres$# BEGIN
postgres$# RETURN case when str is null then val else str::real end;
postgres$# EXCEPTION WHEN OTHERS THEN
postgres$# RETURN val;
postgres$# END;
postgres$# $$ LANGUAGE plpgsql COST 1 IMMUTABLE;
CREATE FUNCTION
postgres=# explain (analyze,buffers,COSTS,TIMING)
postgres-# select MAX(toFloat(b, null)) as "b" from sampletest;
QUERY PLAN
------------------------------------------------------------------------------------------------------------------------
Aggregate (cost=1477.84..1477.85 rows=1 width=4) (actual time=386.990..386.991 rows=1 loops=1)
Buffers: shared hit=643 read=1
-> Seq Scan on sampletest (cost=0.00..1197.56 rows=56056 width=32) (actual time=0.032..17.325 rows=100000 loops=1)
Buffers: shared hit=637
Planning:
Buffers: shared hit=13 read=13
Planning Time: 0.967 ms
Execution Time: 387.989 ms
(8 rows)
postgres=# explain (analyze,buffers,COSTS,TIMING)
postgres-# select MAX(toFloat(a, null)) as "a" from sampletest;
QUERY PLAN
------------------------------------------------------------------------------------------------------------------------
Aggregate (cost=1477.84..1477.85 rows=1 width=4) (actual time=1812.556..1812.557 rows=1 loops=1)
Buffers: shared hit=639 read=1
-> Seq Scan on sampletest (cost=0.00..1197.56 rows=56056 width=32) (actual time=0.026..20.866 rows=100000 loops=1)
Buffers: shared hit=637
Planning Time: 0.152 ms
Execution Time: 1812.587 ms
(6 rows)
postgres=# SET lc_messages = 'C';
SET
postgres=# drop table sampletest;
DROP TABLE
postgres=# create table sampletest (a varchar, b varchar);
CREATE TABLE
postgres=# insert into sampletest (a, b)
postgres-# select substr(md5(random()::text), 0, 15), (100000000*random())::integer::varchar
postgres-# from generate_series(1,100000);
INSERT 0 100000
postgres=#
postgres=# CREATE OR REPLACE FUNCTION toFloat(str varchar, val real)
postgres-# RETURNS real AS $$
postgres$# BEGIN
postgres$# RETURN case when str is null then val else str::real end;
postgres$# EXCEPTION WHEN OTHERS THEN
postgres$# RETURN val;
postgres$# END;
postgres$# $$ LANGUAGE plpgsql COST 1 IMMUTABLE;
CREATE FUNCTION
postgres=# explain (analyze,buffers,COSTS,TIMING)
postgres-# select MAX(toFloat(b, null)) as "b" from sampletest;
QUERY PLAN
------------------------------------------------------------------------------------------------------------------------
Aggregate (cost=1477.84..1477.85 rows=1 width=4) (actual time=278.993..278.994 rows=1 loops=1)
Buffers: shared hit=637
-> Seq Scan on sampletest (cost=0.00..1197.56 rows=56056 width=32) (actual time=0.029..16.837 rows=100000 loops=1)
Buffers: shared hit=637
Planning:
Buffers: shared hit=4
Planning Time: 0.181 ms
Execution Time: 279.023 ms
(8 rows)
postgres=# explain (analyze,buffers,COSTS,TIMING)
postgres-# select MAX(toFloat(a, null)) as "a" from sampletest;
QUERY PLAN
-------------------------------------------------------------------------------------------------------------------------
Aggregate (cost=2137.00..2137.01 rows=1 width=4) (actual time=1783.434..1783.435 rows=1 loops=1)
Buffers: shared hit=637
-> Seq Scan on sampletest (cost=0.00..1637.00 rows=100000 width=15) (actual time=0.016..21.098 rows=100000 loops=1)
Buffers: shared hit=637
Planning:
Buffers: shared hit=6
Planning Time: 1.020 ms
Execution Time: 1783.464 ms
(8 rows)
Execution Time: 387.989 ms
Execution Time: 1812.587 ms
Execution Time: 279.023 ms
Execution Time: 1783.464 ms
Ranier Vilela <ranier.vf@gmail.com> writes:
> I retested this case with HEAD, and it seems to me that NLS does affect it.

Sure, there's no question that message translation will have *some* cost.
But on my machine it is an incremental tens-of-percent kind of cost,
and that is the result you're getting as well.  So it's not very clear
where these factor-of-several-hundred differences are coming from.

            regards, tom lane
Ranier Vilela <ranier.vf@gmail.com> writes:
> I retested this case with HEAD, and it seems to me that NLS does affect it.
Sure, there's no question that message translation will have *some* cost.
But on my machine it is an incremental tens-of-percent kind of cost,
and that is the result you're getting as well. So it's not very clear
where these factor-of-several-hundred differences are coming from.
version
------------------------------------------------------------
PostgreSQL 12.8, compiled by Visual C++ build 1929, 64-bit
(1 row)
postgres=# drop table sampletest;
DROP TABLE
postgres=# create table sampletest (a varchar, b varchar);
CREATE TABLE
postgres=# insert into sampletest (a, b)
postgres-# select substr(md5(random()::text), 0, 15), (100000000*random())::integer::varchar
postgres-# from generate_series(1,100000);
INSERT 0 100000
postgres=#
postgres=# CREATE OR REPLACE FUNCTION toFloat(str varchar, val real)
postgres-# RETURNS real AS $$
postgres$# BEGIN
postgres$# RETURN case when str is null then val else str::real end;
postgres$# EXCEPTION WHEN OTHERS THEN
postgres$# RETURN val;
postgres$# END;
postgres$# $$ LANGUAGE plpgsql COST 1 IMMUTABLE;
CREATE FUNCTION
postgres=# explain (analyze,buffers,COSTS,TIMING)
postgres-# select MAX(toFloat(b, null)) as "b" from sampletest;
QUERY PLAN
------------------------------------------------------------------------------------------------------------------------
Aggregate (cost=1477.84..1477.85 rows=1 width=4) (actual time=339.978..339.979 rows=1 loops=1)
Buffers: shared hit=644
-> Seq Scan on sampletest (cost=0.00..1197.56 rows=56056 width=32) (actual time=0.032..18.132 rows=100000 loops=1)
Buffers: shared hit=637
Planning Time: 3.631 ms
Execution Time: 340.330 ms
(6 rows)
postgres=# explain (analyze,buffers,COSTS,TIMING)
postgres-# select MAX(toFloat(a, null)) as "a" from sampletest;
QUERY PLAN
------------------------------------------------------------------------------------------------------------------------
Aggregate (cost=1477.84..1477.85 rows=1 width=4) (actual time=1724.902..1724.903 rows=1 loops=1)
Buffers: shared hit=640
-> Seq Scan on sampletest (cost=0.00..1197.56 rows=56056 width=32) (actual time=0.021..23.489 rows=100000 loops=1)
Buffers: shared hit=637
Planning Time: 0.150 ms
Execution Time: 1724.930 ms
(6 rows)
RE: Big Performance drop of Exceptions in UDFs between V11.2 and 13.4
>Sure, there's no question that message translation will have *some* cost.
>But on my machine it is an incremental tens-of-percent kind of cost,
>and that is the result you're getting as well.  So it's not very clear
>where these factor-of-several-hundred differences are coming from.
>A hypothesis that has not yet come up, may be some defect in the code generation,
>by the previous msvc compiler used, because in all my tests I always use the latest version,
>which has several corrections in the code generation part.


------------------------------------------------------------------------------------------------------------------------

Hello all,

I don't think this reproduces the issue I experience. I saw a difference of around 500x! What you see is 5x, which
accordingto Tom would be expected for an execution path involving exceptions. And NLS should have an impact as well
sincemore work happens. From the numbers you published, I see 10-15% change which again would be expected?


I cannot think of anything that would be specific to me with regards to this scenario given that I have tried it in
quitea few environments from plain stock installs. Until one of you is able to reproduce this, you may be chasing other
issues.


Is it possible that the client I am using or the way I am creating the test database might affect this scenario? I use
DBeaverand use the default settings to create the database:

- default encoding: UTF8
- collate: English_United States.1252
- ctype: English_United States.1252
- default tablespace: pg_default

Settings:
Name    Value    Unit
allow_system_table_mods    off    [NULL]
application_name    DBeaver 21.1.3 - Main <postgres>    [NULL]
archive_cleanup_command        [NULL]
archive_command    (disabled)    [NULL]
archive_mode    off    [NULL]
archive_timeout    0    s
array_nulls    on    [NULL]
authentication_timeout    60    s
autovacuum    on    [NULL]
autovacuum_analyze_scale_factor    0.1    [NULL]
autovacuum_analyze_threshold    50    [NULL]
autovacuum_freeze_max_age    200000000    [NULL]
autovacuum_max_workers    3    [NULL]
autovacuum_multixact_freeze_max_age    400000000    [NULL]
autovacuum_naptime    60    s
autovacuum_vacuum_cost_delay    2    ms
autovacuum_vacuum_cost_limit    -1    [NULL]
autovacuum_vacuum_insert_scale_factor    0.2    [NULL]
autovacuum_vacuum_insert_threshold    1000    [NULL]
autovacuum_vacuum_scale_factor    0.2    [NULL]
autovacuum_vacuum_threshold    50    [NULL]
autovacuum_work_mem    -1    kB
backend_flush_after    0    8kB
backslash_quote    safe_encoding    [NULL]
backtrace_functions        [NULL]
bgwriter_delay    200    ms
bgwriter_flush_after    0    8kB
bgwriter_lru_maxpages    100    [NULL]
bgwriter_lru_multiplier    2    [NULL]
block_size    8192    [NULL]
bonjour    off    [NULL]
bonjour_name        [NULL]
bytea_output    hex    [NULL]
check_function_bodies    on    [NULL]
checkpoint_completion_target    0.5    [NULL]
checkpoint_flush_after    0    8kB
checkpoint_timeout    300    s
checkpoint_warning    30    s
client_encoding    UTF8    [NULL]
client_min_messages    notice    [NULL]
cluster_name        [NULL]
commit_delay    0    [NULL]
commit_siblings    5    [NULL]
config_file    C:/Program Files/PostgreSQL/13/data/postgresql.conf    [NULL]
constraint_exclusion    partition    [NULL]
cpu_index_tuple_cost    0.005    [NULL]
cpu_operator_cost    0.0025    [NULL]
cpu_tuple_cost    0.01    [NULL]
cursor_tuple_fraction    0.1    [NULL]
data_checksums    off    [NULL]
data_directory    C:/Program Files/PostgreSQL/13/data    [NULL]
data_directory_mode    700    [NULL]
data_sync_retry    off    [NULL]
DateStyle    ISO, YMD    [NULL]
db_user_namespace    off    [NULL]
deadlock_timeout    1000    ms
debug_assertions    off    [NULL]
debug_pretty_print    on    [NULL]
debug_print_parse    off    [NULL]
debug_print_plan    off    [NULL]
debug_print_rewritten    off    [NULL]
default_statistics_target    100    [NULL]
default_table_access_method    heap    [NULL]
default_tablespace        [NULL]
default_text_search_config    pg_catalog.english    [NULL]
default_transaction_deferrable    off    [NULL]
default_transaction_isolation    read committed    [NULL]
default_transaction_read_only    off    [NULL]
dynamic_library_path    $libdir    [NULL]
dynamic_shared_memory_type    windows    [NULL]
effective_cache_size    524288    8kB
effective_io_concurrency    0    [NULL]
enable_bitmapscan    on    [NULL]
enable_gathermerge    on    [NULL]
enable_hashagg    on    [NULL]
enable_hashjoin    on    [NULL]
enable_incremental_sort    on    [NULL]
enable_indexonlyscan    on    [NULL]
enable_indexscan    on    [NULL]
enable_material    on    [NULL]
enable_mergejoin    on    [NULL]
enable_nestloop    on    [NULL]
enable_parallel_append    on    [NULL]
enable_parallel_hash    on    [NULL]
enable_partition_pruning    on    [NULL]
enable_partitionwise_aggregate    off    [NULL]
enable_partitionwise_join    off    [NULL]
enable_seqscan    on    [NULL]
enable_sort    on    [NULL]
enable_tidscan    on    [NULL]
escape_string_warning    on    [NULL]
event_source    PostgreSQL    [NULL]
exit_on_error    off    [NULL]
external_pid_file        [NULL]
extra_float_digits    3    [NULL]
force_parallel_mode    off    [NULL]
from_collapse_limit    8    [NULL]
fsync    on    [NULL]
full_page_writes    on    [NULL]
geqo    on    [NULL]
geqo_effort    5    [NULL]
geqo_generations    0    [NULL]
geqo_pool_size    0    [NULL]
geqo_seed    0    [NULL]
geqo_selection_bias    2    [NULL]
geqo_threshold    12    [NULL]
gin_fuzzy_search_limit    0    [NULL]
gin_pending_list_limit    4096    kB
hash_mem_multiplier    1    [NULL]
hba_file    C:/Program Files/PostgreSQL/13/data/pg_hba.conf    [NULL]
hot_standby    on    [NULL]
hot_standby_feedback    off    [NULL]
huge_pages    try    [NULL]
ident_file    C:/Program Files/PostgreSQL/13/data/pg_ident.conf    [NULL]
idle_in_transaction_session_timeout    0    ms
ignore_checksum_failure    off    [NULL]
ignore_invalid_pages    off    [NULL]
ignore_system_indexes    off    [NULL]
integer_datetimes    on    [NULL]
IntervalStyle    postgres    [NULL]
jit    off    [NULL]
jit_above_cost    100000    [NULL]
jit_debugging_support    off    [NULL]
jit_dump_bitcode    off    [NULL]
jit_expressions    on    [NULL]
jit_inline_above_cost    500000    [NULL]
jit_optimize_above_cost    500000    [NULL]
jit_profiling_support    off    [NULL]
jit_provider    llvmjit    [NULL]
jit_tuple_deforming    on    [NULL]
join_collapse_limit    8    [NULL]
krb_caseins_users    off    [NULL]
krb_server_keyfile        [NULL]
lc_collate    English_United States.1252    [NULL]
lc_ctype    English_United States.1252    [NULL]
lc_messages    English_United States.1252    [NULL]
lc_monetary    English_United States.1252    [NULL]
lc_numeric    English_United States.1252    [NULL]
lc_time    English_United States.1252    [NULL]
listen_addresses    *    [NULL]
lo_compat_privileges    off    [NULL]
local_preload_libraries        [NULL]
lock_timeout    0    ms
log_autovacuum_min_duration    -1    ms
log_checkpoints    off    [NULL]
log_connections    off    [NULL]
log_destination    stderr    [NULL]
log_directory    log    [NULL]
log_disconnections    off    [NULL]
log_duration    off    [NULL]
log_error_verbosity    default    [NULL]
log_executor_stats    off    [NULL]
log_file_mode    640    [NULL]
log_filename    postgresql-%Y-%m-%d_%H%M%S.log    [NULL]
log_hostname    off    [NULL]
log_line_prefix    %m [%p]     [NULL]
log_lock_waits    off    [NULL]
log_min_duration_sample    -1    ms
log_min_duration_statement    -1    ms
log_min_error_statement    error    [NULL]
log_min_messages    warning    [NULL]
log_parameter_max_length    -1    B
log_parameter_max_length_on_error    0    B
log_parser_stats    off    [NULL]
log_planner_stats    off    [NULL]
log_replication_commands    off    [NULL]
log_rotation_age    1440    min
log_rotation_size    10240    kB
log_statement    none    [NULL]
log_statement_sample_rate    1    [NULL]
log_statement_stats    off    [NULL]
log_temp_files    -1    kB
log_timezone    US/Eastern    [NULL]
log_transaction_sample_rate    0    [NULL]
log_truncate_on_rotation    off    [NULL]
logging_collector    on    [NULL]
logical_decoding_work_mem    65536    kB
maintenance_io_concurrency    0    [NULL]
maintenance_work_mem    65536    kB
max_connections    100    [NULL]
max_files_per_process    1000    [NULL]
max_function_args    100    [NULL]
max_identifier_length    63    [NULL]
max_index_keys    32    [NULL]
max_locks_per_transaction    64    [NULL]
max_logical_replication_workers    4    [NULL]
max_parallel_maintenance_workers    2    [NULL]
max_parallel_workers    8    [NULL]
max_parallel_workers_per_gather    2    [NULL]
max_pred_locks_per_page    2    [NULL]
max_pred_locks_per_relation    -2    [NULL]
max_pred_locks_per_transaction    64    [NULL]
max_prepared_transactions    0    [NULL]
max_replication_slots    10    [NULL]
max_slot_wal_keep_size    -1    MB
max_stack_depth    2048    kB
max_standby_archive_delay    30000    ms
max_standby_streaming_delay    30000    ms
max_sync_workers_per_subscription    2    [NULL]
max_wal_senders    10    [NULL]
max_wal_size    1024    MB
max_worker_processes    8    [NULL]
min_parallel_index_scan_size    64    8kB
min_parallel_table_scan_size    1024    8kB
min_wal_size    80    MB
old_snapshot_threshold    -1    min
operator_precedence_warning    off    [NULL]
parallel_leader_participation    on    [NULL]
parallel_setup_cost    1000    [NULL]
parallel_tuple_cost    0.1    [NULL]
password_encryption    scram-sha-256    [NULL]
plan_cache_mode    auto    [NULL]
port    5433    [NULL]
post_auth_delay    0    s
pre_auth_delay    0    s
primary_conninfo        [NULL]
primary_slot_name        [NULL]
promote_trigger_file        [NULL]
quote_all_identifiers    off    [NULL]
random_page_cost    4    [NULL]
recovery_end_command        [NULL]
recovery_min_apply_delay    0    ms
recovery_target        [NULL]
recovery_target_action    pause    [NULL]
recovery_target_inclusive    on    [NULL]
recovery_target_lsn        [NULL]
recovery_target_name        [NULL]
recovery_target_time        [NULL]
recovery_target_timeline    latest    [NULL]
recovery_target_xid        [NULL]
restart_after_crash    on    [NULL]
restore_command        [NULL]
row_security    on    [NULL]
search_path    $user, public    [NULL]
segment_size    131072    8kB
seq_page_cost    1    [NULL]
server_encoding    UTF8    [NULL]
server_version    13.4    [NULL]
server_version_num    130004    [NULL]
session_preload_libraries        [NULL]
session_replication_role    origin    [NULL]
shared_buffers    16384    8kB
shared_memory_type    windows    [NULL]
shared_preload_libraries        [NULL]
ssl    off    [NULL]
ssl_ca_file        [NULL]
ssl_cert_file    server.crt    [NULL]
ssl_ciphers    HIGH:MEDIUM:+3DES:!aNULL    [NULL]
ssl_crl_file        [NULL]
ssl_dh_params_file        [NULL]
ssl_ecdh_curve    prime256v1    [NULL]
ssl_key_file    server.key    [NULL]
ssl_library    OpenSSL    [NULL]
ssl_max_protocol_version        [NULL]
ssl_min_protocol_version    TLSv1.2    [NULL]
ssl_passphrase_command        [NULL]
ssl_passphrase_command_supports_reload    off    [NULL]
ssl_prefer_server_ciphers    on    [NULL]
standard_conforming_strings    on    [NULL]
statement_timeout    0    ms
stats_temp_directory    pg_stat_tmp    [NULL]
superuser_reserved_connections    3    [NULL]
synchronize_seqscans    on    [NULL]
synchronous_commit    on    [NULL]
synchronous_standby_names        [NULL]
syslog_facility    none    [NULL]
syslog_ident    postgres    [NULL]
syslog_sequence_numbers    on    [NULL]
syslog_split_messages    on    [NULL]
tcp_keepalives_count    0    [NULL]
tcp_keepalives_idle    -1    s
tcp_keepalives_interval    -1    s
tcp_user_timeout    0    ms
temp_buffers    1024    8kB
temp_file_limit    -1    kB
temp_tablespaces        [NULL]
TimeZone    America/New_York    [NULL]
timezone_abbreviations    Default    [NULL]
trace_notify    off    [NULL]
trace_recovery_messages    log    [NULL]
trace_sort    off    [NULL]
track_activities    on    [NULL]
track_activity_query_size    1024    B
track_commit_timestamp    off    [NULL]
track_counts    on    [NULL]
track_functions    none    [NULL]
track_io_timing    off    [NULL]
transaction_deferrable    off    [NULL]
transaction_isolation    read committed    [NULL]
transaction_read_only    off    [NULL]
transform_null_equals    off    [NULL]
unix_socket_directories        [NULL]
unix_socket_group        [NULL]
unix_socket_permissions    777    [NULL]
update_process_title    off    [NULL]
vacuum_cleanup_index_scale_factor    0.1    [NULL]
vacuum_cost_delay    0    ms
vacuum_cost_limit    200    [NULL]
vacuum_cost_page_dirty    20    [NULL]
vacuum_cost_page_hit    1    [NULL]
vacuum_cost_page_miss    10    [NULL]
vacuum_defer_cleanup_age    0    [NULL]
vacuum_freeze_min_age    50000000    [NULL]
vacuum_freeze_table_age    150000000    [NULL]
vacuum_multixact_freeze_min_age    5000000    [NULL]
vacuum_multixact_freeze_table_age    150000000    [NULL]
wal_block_size    8192    [NULL]
wal_buffers    512    8kB
wal_compression    off    [NULL]
wal_consistency_checking        [NULL]
wal_init_zero    on    [NULL]
wal_keep_size    0    MB
wal_level    replica    [NULL]
wal_log_hints    off    [NULL]
wal_receiver_create_temp_slot    off    [NULL]
wal_receiver_status_interval    10    s
wal_receiver_timeout    60000    ms
wal_recycle    on    [NULL]
wal_retrieve_retry_interval    5000    ms
wal_segment_size    16777216    B
wal_sender_timeout    60000    ms
wal_skip_threshold    2048    kB
wal_sync_method    open_datasync    [NULL]
wal_writer_delay    200    ms
wal_writer_flush_after    128    8kB
work_mem    4096    kB
xmlbinary    base64    [NULL]
xmloption    content    [NULL]
zero_damaged_pages    off    [NULL]


Thank you,
Laurent.
"ldh@laurent-hasson.com" <ldh@laurent-hasson.com> writes:
> Is it possible that the client I am using or the way I am creating the test database might affect this scenario? I
useDBeaver and use the default settings to create the database:
> - default encoding: UTF8
> - collate: English_United States.1252
> - ctype: English_United States.1252

Yeah, I was thinking of quizzing you about that.  I wonder whether
something is thinking it needs to transcode to WIN1252 encoding and then
back to UTF8, based on the .1252 property of the LC_XXX settings.  That
shouldn't account for any 500X factor either, but we're kind of grasping
at straws here.

Does Windows have any locale choices that imply UTF8 encoding exactly,
and if so, do your results change when using that?  Alternatively,
try creating a database with WIN1252 encoding and those locale settings.

            regards, tom lane
>Sure, there's no question that message translation will have *some* cost.
>But on my machine it is an incremental tens-of-percent kind of cost,
>and that is the result you're getting as well. So it's not very clear
>where these factor-of-several-hundred differences are coming from.
>A hypothesis that has not yet come up, may be some defect in the code generation,
>by the previous msvc compiler used, because in all my tests I always use the latest version,
>which has several corrections in the code generation part.
------------------------------------------------------------------------------------------------------------------------
Hello all,
I don't think this reproduces the issue I experience. I saw a difference of around 500x! What you see is 5x, which according to Tom would be expected for an execution path involving exceptions. And NLS should have an impact as well since more work happens. From the numbers you published, I see 10-15% change which again would be expected?
I cannot think of anything that would be specific to me with regards to this scenario given that I have tried it in quite a few environments from plain stock installs. Until one of you is able to reproduce this, you may be chasing other issues.
Execution Time: 88031.585 ms
RE: Big Performance drop of Exceptions in UDFs between V11.2 and 13.4
From: Ranier Vilela <ranier.vf@gmail.com>
Sent: Sunday, August 29, 2021 14:20
To: ldh@laurent-hasson.com
Cc: Tom Lane <tgl@sss.pgh.pa.us>; Andrew Dunstan <andrew@dunslane.net>; Justin Pryzby <pryzby@telsasoft.com>;
pgsql-performance@postgresql.org
Subject: Re: Big Performance drop of Exceptions in UDFs between V11.2 and 13.4

Em dom., 29 de ago. de 2021 às 13:03, mailto:ldh@laurent-hasson.com <mailto:ldh@laurent-hasson.com> escreveu:
>Sure, there's no question that message translation will have *some* cost.
>But on my machine it is an incremental tens-of-percent kind of cost,
>and that is the result you're getting as well.  So it's not very clear
>where these factor-of-several-hundred differences are coming from.
>A hypothesis that has not yet come up, may be some defect in the code generation,
>by the previous msvc compiler used, because in all my tests I always use the latest version,
>which has several corrections in the code generation part.


------------------------------------------------------------------------------------------------------------------------

Hello all,

I don't think this reproduces the issue I experience. I saw a difference of around 500x! What you see is 5x, which
accordingto Tom would be expected for an execution path involving exceptions. And NLS should have an impact as well
sincemore work happens. From the numbers you published, I see 10-15% change which again would be expected?

Yes, It seems to me that is expected for NLS usage.


I cannot think of anything that would be specific to me with regards to this scenario given that I have tried it in
quitea few environments from plain stock installs. Until one of you is able to reproduce this, you may be chasing other
issues.

I think I'm unable to reproduce the issue, because I didn't use any plain stock installs.
Postgres env tests here, is a fresh build with the latest msvc.
I have no intention of repeating the issue, with something exactly the same as your environment,
but with a very different environment.

Can you show the version of Postgres, at your Windows 10 env, who got this result?
Planning Time: 0.171 ms
Execution Time: 88031.585 ms

regards,
Ranier Vilela


-------------------------------------------------------------------------------------------------------------------------------------------------------------------------------
Hello Ranier,

All my tests were on latest 13.4 install I downloaded from the main site.

SELECT version();
PostgreSQL 13.4, compiled by Visual C++ build 1914, 64-bit


As per the following:

> I think I'm unable to reproduce the issue, because I didn't use any plain stock installs.
> Postgres env tests here, is a fresh build with the latest msvc.
> I have no intention of repeating the issue, with something exactly the same as your environment,
> but with a very different environment.

I am not sure I understand. Are you saying the standard installs may be faulty? A stock install from the stock
installeron a windows machine should take 10mn top. If it doesn't reproduce the issue out of the box, then at least I
havea confirmation that there may be something weird that I am somehow repeating across all the installs I have
performed???

Thank you,
Laurent.
RE: Big Performance drop of Exceptions in UDFs between V11.2 and 13.4
   >  -----Original Message-----
   >  From: Tom Lane <tgl@sss.pgh.pa.us>
   >  Sent: Sunday, August 29, 2021 12:19
   >  To: ldh@laurent-hasson.com
   >  Cc: Ranier Vilela <ranier.vf@gmail.com>; Andrew Dunstan
   >  <andrew@dunslane.net>; Justin Pryzby <pryzby@telsasoft.com>; pgsql-
   >  performance@postgresql.org
   >  Subject: Re: Big Performance drop of Exceptions in UDFs between V11.2
   >  and 13.4
   >
   >  "ldh@laurent-hasson.com" <ldh@laurent-hasson.com> writes:
   >  > Is it possible that the client I am using or the way I am creating the test
   >  database might affect this scenario? I use DBeaver and use the default
   >  settings to create the database:
   >  > - default encoding: UTF8
   >  > - collate: English_United States.1252
   >  > - ctype: English_United States.1252
   >
   >  Yeah, I was thinking of quizzing you about that.  I wonder whether
   >  something is thinking it needs to transcode to WIN1252 encoding and
   >  then back to UTF8, based on the .1252 property of the LC_XXX settings.
   >  That shouldn't account for any 500X factor either, but we're kind of
   >  grasping at straws here.
   >
   >  Does Windows have any locale choices that imply UTF8 encoding
   >  exactly, and if so, do your results change when using that?  Alternatively,
   >  try creating a database with WIN1252 encoding and those locale
   >  settings.
   >
   >              regards, tom lane

Yeah, grasping at straws... and no material changes 😊 This is mystifying.

show lc_messages;
-- English_United States.1252

create table sampletest (a varchar, b varchar);
insert into sampletest (a, b)
select substr(md5(random()::text), 0, 15), (100000000*random())::integer::varchar
  from generate_series(1,100000);

CREATE OR REPLACE FUNCTION toFloat(str varchar, val real)
RETURNS real AS $$
BEGIN
  RETURN case when str is null then val else str::real end;
EXCEPTION WHEN OTHERS THEN
  RETURN val;
END;
$$ LANGUAGE plpgsql COST 1 IMMUTABLE;

explain (analyze,buffers,COSTS,TIMING)
select MAX(toFloat(a, null)) as "a" from sampletest
--Aggregate  (cost=1477.84..1477.85 rows=1 width=4) (actual time=89527.032..89527.033 rows=1 loops=1)
--  Buffers: shared hit=647
--  ->  Seq Scan on sampletest  (cost=0.00..1197.56 rows=56056 width=32) (actual time=0.024..37.811 rows=100000
loops=1)
--        Buffers: shared hit=637
--Planning:
--  Buffers: shared hit=24
--Planning Time: 0.347 ms
--Execution Time: 89527.501 ms

explain (analyze,buffers,COSTS,TIMING)
select MAX(toFloat(b, null)) as "b" from sampletest
--Aggregate  (cost=2137.00..2137.01 rows=1 width=4) (actual time=186.605..186.606 rows=1 loops=1)
--  Buffers: shared hit=637
--  ->  Seq Scan on sampletest  (cost=0.00..1637.00 rows=100000 width=8) (actual time=0.008..9.679 rows=100000
loops=1)
--        Buffers: shared hit=637
--Planning:
--  Buffers: shared hit=4
--Planning Time: 0.339 ms
--Execution Time: 186.641 ms


At this point, I am not sure how to proceed except to rethink that toFloat() function and many other places where we
useexceptions. We get such dirty data that I need a "safe" way to convert a string to float without throwing an
exception.BTW, I tried other combinations in case there may have been some weird interactions with the ::REAL
conversionoperator, but nothing made any change. Could you recommend another approach off the top of your head? I could
useregexes for testing etc... Or maybe there is another option like a no-throw conversion that's built in or in some
extensionthat you may know of? Like the "SAFE." Prefix in BigQuery.


Thank you,
Laurent.
From: Ranier Vilela <ranier.vf@gmail.com>
Sent: Sunday, August 29, 2021 14:20
To: ldh@laurent-hasson.com
Cc: Tom Lane <tgl@sss.pgh.pa.us>; Andrew Dunstan <andrew@dunslane.net>; Justin Pryzby <pryzby@telsasoft.com>; pgsql-performance@postgresql.org
Subject: Re: Big Performance drop of Exceptions in UDFs between V11.2 and 13.4
Em dom., 29 de ago. de 2021 às 13:03, mailto:ldh@laurent-hasson.com <mailto:ldh@laurent-hasson.com> escreveu:
>Sure, there's no question that message translation will have *some* cost.
>But on my machine it is an incremental tens-of-percent kind of cost,
>and that is the result you're getting as well. So it's not very clear
>where these factor-of-several-hundred differences are coming from.
>A hypothesis that has not yet come up, may be some defect in the code generation,
>by the previous msvc compiler used, because in all my tests I always use the latest version,
>which has several corrections in the code generation part.
------------------------------------------------------------------------------------------------------------------------
Hello all,
I don't think this reproduces the issue I experience. I saw a difference of around 500x! What you see is 5x, which according to Tom would be expected for an execution path involving exceptions. And NLS should have an impact as well since more work happens. From the numbers you published, I see 10-15% change which again would be expected?
Yes, It seems to me that is expected for NLS usage.
I cannot think of anything that would be specific to me with regards to this scenario given that I have tried it in quite a few environments from plain stock installs. Until one of you is able to reproduce this, you may be chasing other issues.
I think I'm unable to reproduce the issue, because I didn't use any plain stock installs.
Postgres env tests here, is a fresh build with the latest msvc.
I have no intention of repeating the issue, with something exactly the same as your environment,
but with a very different environment.
Can you show the version of Postgres, at your Windows 10 env, who got this result?
Planning Time: 0.171 ms
Execution Time: 88031.585 ms
regards,
Ranier Vilela
-------------------------------------------------------------------------------------------------------------------------------------------------------------------------------
Hello Ranier,
All my tests were on latest 13.4 install I downloaded from the main site.
SELECT version();
PostgreSQL 13.4, compiled by Visual C++ build 1914, 64-bit
As per the following:
> I think I'm unable to reproduce the issue, because I didn't use any plain stock installs.
> Postgres env tests here, is a fresh build with the latest msvc.
> I have no intention of repeating the issue, with something exactly the same as your environment,
> but with a very different environment.
I am not sure I understand. Are you saying the standard installs may be faulty?
A stock install from the stock installer on a windows machine should take 10mn top. If it doesn't reproduce the issue out of the box, then at least I have a confirmation that there may be something weird that I am somehow repeating across all the installs I have performed???
version
------------------------------------------------------------
PostgreSQL 13.4, compiled by Visual C++ build 1929, 64-bit
(1 row)
CREATE TABLE
postgres=# insert into sampletest (a, b)
postgres-# select substr(md5(random()::text), 0, 15), (100000000*random())::integer::varchar
postgres-# from generate_series(1,100000);
INSERT 0 100000
postgres=#
postgres=# CREATE OR REPLACE FUNCTION toFloat(str varchar, val real)
postgres-# RETURNS real AS $$
postgres$# BEGIN
postgres$# RETURN case when str is null then val else str::real end;
postgres$# EXCEPTION WHEN OTHERS THEN
postgres$# RETURN val;
postgres$# END;
postgres$# $$ LANGUAGE plpgsql COST 1 IMMUTABLE;
CREATE FUNCTION
postgres=# explain (analyze,buffers,COSTS,TIMING)
postgres-# select MAX(toFloat(a, null)) as "a" from sampletest;
QUERY PLAN
------------------------------------------------------------------------------------------------------------------------
Aggregate (cost=1477.84..1477.85 rows=1 width=4) (actual time=830.404..830.404 rows=1 loops=1)
Buffers: shared hit=646 read=1
-> Seq Scan on sampletest (cost=0.00..1197.56 rows=56056 width=32) (actual time=0.035..12.222 rows=100000 loops=1)
Buffers: shared hit=637
Planning:
Buffers: shared hit=12 read=12
Planning Time: 0.923 ms
Execution Time: 830.743 ms
(8 rows)
postgres=# explain (analyze,buffers,COSTS,TIMING)
postgres-# select MAX(toFloat(b, null)) as "b" from sampletest;
QUERY PLAN
-----------------------------------------------------------------------------------------------------------------------
Aggregate (cost=1477.84..1477.85 rows=1 width=4) (actual time=123.660..123.660 rows=1 loops=1)
Buffers: shared hit=637
-> Seq Scan on sampletest (cost=0.00..1197.56 rows=56056 width=32) (actual time=0.028..7.762 rows=100000 loops=1)
Buffers: shared hit=637
Planning Time: 0.152 ms
Execution Time: 123.691 ms
(6 rows)
On Mon, Aug 30, 2021 at 8:44 AM ldh@laurent-hasson.com
<ldh@laurent-hasson.com> wrote:
>
> Yeah, grasping at straws... and no material changes 😊 This is mystifying.
>
> show lc_messages;
> -- English_United States.1252
>
> create table sampletest (a varchar, b varchar);
> insert into sampletest (a, b)
> select substr(md5(random()::text), 0, 15), (100000000*random())::integer::varchar
>   from generate_series(1,100000);
>
> CREATE OR REPLACE FUNCTION toFloat(str varchar, val real)
> RETURNS real AS $$
> BEGIN
>   RETURN case when str is null then val else str::real end;
> EXCEPTION WHEN OTHERS THEN
>   RETURN val;
> END;
> $$ LANGUAGE plpgsql COST 1 IMMUTABLE;
>
> explain (analyze,buffers,COSTS,TIMING)
> select MAX(toFloat(a, null)) as "a" from sampletest
> --Aggregate  (cost=1477.84..1477.85 rows=1 width=4) (actual time=89527.032..89527.033 rows=1 loops=1)
> --  Buffers: shared hit=647
> --  ->  Seq Scan on sampletest  (cost=0.00..1197.56 rows=56056 width=32) (actual time=0.024..37.811 rows=100000
loops=1)
> --        Buffers: shared hit=637
> --Planning:
> --  Buffers: shared hit=24
> --Planning Time: 0.347 ms
> --Execution Time: 89527.501 ms
>
> explain (analyze,buffers,COSTS,TIMING)
> select MAX(toFloat(b, null)) as "b" from sampletest
> --Aggregate  (cost=2137.00..2137.01 rows=1 width=4) (actual time=186.605..186.606 rows=1 loops=1)
> --  Buffers: shared hit=637
> --  ->  Seq Scan on sampletest  (cost=0.00..1637.00 rows=100000 width=8) (actual time=0.008..9.679 rows=100000
loops=1)
> --        Buffers: shared hit=637
> --Planning:
> --  Buffers: shared hit=4
> --Planning Time: 0.339 ms
> --Execution Time: 186.641 ms
>
>
> At this point, I am not sure how to proceed except to rethink that toFloat() function and many other places where we
useexceptions. We get such dirty data that I need a "safe" way to convert a string to float without throwing an
exception.BTW, I tried other combinations in case there may have been some weird interactions with the ::REAL
conversionoperator, but nothing made any change. Could you recommend another approach off the top of your head? I could
useregexes for testing etc... Or maybe there is another option like a no-throw conversion that's built in or in some
extensionthat you may know of? Like the "SAFE." Prefix in BigQuery.

I tried this scenario using edb's 13.3 x64 install:

postgres=# select version();
                          version
------------------------------------------------------------
 PostgreSQL 13.3, compiled by Visual C++ build 1914, 64-bit
(1 row)


postgres=# \l postgres
                          List of databases
   Name   |  Owner   | Encoding | Collate | Ctype | Access privileges
----------+----------+----------+---------+-------+-------------------
 postgres | postgres | UTF8     | C       | C     |
(1 row)

postgres=# explain (analyze,buffers,COSTS,TIMING)
postgres-# select MAX(toFloat(a, null)) as "a" from sampletest;
                                                       QUERY PLAN

------------------------------------------------------------------------------------------------------------------------
Aggregate  (cost=2137.00..2137.01 rows=1 width=4) (actual
time=44962.279..44962.280 rows=1 loops=1)
   Buffers: shared hit=657
   ->  Seq Scan on sampletest  (cost=0.00..1637.00 rows=100000
width=15) (actual time=0.009..8.900 rows=100000 loops=1)
         Buffers: shared hit=637
 Planning:
   Buffers: shared hit=78
 Planning Time: 0.531 ms
 Execution Time: 44963.747 ms
(8 rows)

and with locally compiled REL_13_STABLE's head on the same machine:

rjuju=# select version();
                          version
------------------------------------------------------------
 PostgreSQL 13.4, compiled by Visual C++ build 1929, 64-bit
(1 row)

rjuju=# \l rjuju
                       List of databases
 Name  | Owner | Encoding | Collate | Ctype | Access privileges
-------+-------+----------+---------+-------+-------------------
 rjuju | rjuju | UTF8     | C       | C     |
(1 row)

rjuju-# select MAX(toFloat(a, null)) as "a" from sampletest;
                                                      QUERY PLAN
-----------------------------------------------------------------------------------------------------------------------
 Aggregate  (cost=1477.84..1477.85 rows=1 width=4) (actual
time=460.334..460.334 rows=1 loops=1)
   Buffers: shared hit=646 read=1
   ->  Seq Scan on sampletest  (cost=0.00..1197.56 rows=56056
width=32) (actual time=0.010..7.612 rows=100000 loops=1)
         Buffers: shared hit=637
 Planning:
   Buffers: shared hit=20 read=1
 Planning Time: 0.125 ms
 Execution Time: 460.527 ms
(8 rows)

Note that I followed [1], so I simply used "build" and "install".  I
have no idea what is done by default and if NLS is included or not.

So if default build on windows has NLS included, it probably means
that either there's something specific on edb's build (I have no idea
how their build is produced) or their version of msvc is responsible
for that.

[1]: https://www.postgresql.org/docs/current/install-windows-full.html#id-1.6.4.8.10
At this point, I am not sure how to proceed except to rethink that toFloat() function and many other places where we use exceptions. We get such dirty data that I need a "safe" way to convert a string to float without throwing an exception. BTW, I tried other combinations in case there may have been some weird interactions with the ::REAL conversion operator, but nothing made any change. Could you recommend another approach off the top of your head? I could use regexes for testing etc... Or maybe there is another option like a no-throw conversion that's built in or in some extension that you may know of? Like the "SAFE." Prefix in BigQuery.
RETURNS double precision AS $$
BEGIN
IF $1 SIMILAR TO '[+-]?([0-9]*[.])?[0-9]+' THEN
RETURN $1::double precision;
ELSE
RETURN NULL;
END IF;
END;
$$ LANGUAGE plpgsql IMMUTABLE STRICT;
Thank you,
Laurent.
RE: Big Performance drop of Exceptions in UDFs between V11.2 and 13.4 (workarounds)
   >  -----Original Message-----
   >  From: Justin Pryzby <pryzby@telsasoft.com>
   >  Sent: Sunday, August 29, 2021 23:17
   >  To: Pavel Stehule <pavel.stehule@gmail.com>
   >  Cc: ldh@laurent-hasson.com; Tom Lane <tgl@sss.pgh.pa.us>; Ranier
   >  Vilela <ranier.vf@gmail.com>; Andrew Dunstan
   >  <andrew@dunslane.net>; pgsql-performance@postgresql.org
   >  Subject: Re: Big Performance drop of Exceptions in UDFs between V11.2
   >  and 13.4 (workarounds)
   >
   >  On Mon, Aug 30, 2021 at 04:43:23AM +0200, Pavel Stehule wrote:
   >  > po 30. 8. 2021 v 2:44 odesílatel ldh@laurent-hasson.com napsal:
   >  > > At this point, I am not sure how to proceed except to rethink that
   >  > > toFloat() function and many other places where we use exceptions.
   >  We
   >  > > get such dirty data that I need a "safe" way to convert a string to
   >  > > float without throwing an exception. BTW, I tried other
   >  combinations
   >  > > in case there may have been some weird interactions with the ::REAL
   >  > > conversion operator, but nothing made any change. Could you
   >  > > recommend another approach off the top of your head? I could use
   >  > > regexes for testing etc... Or maybe there is another option like a
   >  > > no-throw conversion that's built in or in some extension that you
   >  may know of? Like the "SAFE." Prefix in BigQuery.
   >  >
   >  > CREATE OR REPLACE FUNCTION safe_to_double_precision(t text)
   >  RETURNS
   >  > double precision AS $$ BEGIN
   >  >   IF $1 SIMILAR TO '[+-]?([0-9]*[.])?[0-9]+' THEN
   >  >     RETURN $1::double precision;
   >  >   ELSE
   >  >     RETURN NULL;
   >  >   END IF;
   >  > END;
   >  > $$ LANGUAGE plpgsql IMMUTABLE STRICT;
   >
   >  This tries to use a regex to determine if something is a "Number" or not.
   >  Which has all the issues enumerated in painful detail by long answers on
   >  stack overflow, and other wiki/blog/forums.
   >
   >  Rather than trying to define Numbers using regex, I'd try to avoid only
   >  the most frequent exceptions and get 90% of the performance back.  I
   >  don't know what your data looks like, but you might try things like this:
   >
   >  IF $1 IS NULL THEN RETURN $2
   >  ELSE IF $1 ~ '^$' THEN RETURN $2
   >  ELSE IF $1 ~ '[[:alpha:]]{2}' THEN RETURN $2 ELSE IF $1 !~ '[[:digit:]]' THEN
   >  RETURN $2
   >  BEGIN
   >     RETURN $1::float;
   >  EXCEPTION WHEN OTHERS THEN
   >     RETURN $2;
   >  END;
   >
   >  You can check the stackoverflow page for ideas as to what kind of thing
   >  to reject, but it may depend mostly on your data (what is the most
   >  common string?
   >  The most common exceptional string?).
   >
   >  I think it's possible that could even be *faster* than the original, since it
   >  avoids the exception block for values which are for sure going to cause
   >  an exception anyway.  It might be that using alternation (|) is faster (if
   >  less
   >  readable) than using a handful of IF branches.
   >
   >  --
   >  Justin

That's exactly where my head was at. I have looked different way to test for a floating point number and recognize the
challenge😊


The data is very messy with people entering data by hand. We have seen alpha and punctuation, people copy/pasting from
excelso large numbers get the "e" notation. It's a total mess. The application that authors that data is a piece of
crapand we have no chance to change it unfortunately. Short of rolling out an ETL process, which is painful for the way
ourdata comes in, I need an in-db solution.


Thank you!
Laurent.
RE: Big Performance drop of Exceptions in UDFs between V11.2 and 13.4
   >  I tried this scenario using edb's 13.3 x64 install:
   >
   >  postgres=# select version();
   >                            version
   >  ------------------------------------------------------------
   >   PostgreSQL 13.3, compiled by Visual C++ build 1914, 64-bit
   >  (1 row)
   >
   >
   >  postgres=# \l postgres
   >                            List of databases
   >     Name   |  Owner   | Encoding | Collate | Ctype | Access privileges
   >  ----------+----------+----------+---------+-------+-------------------
   >   postgres | postgres | UTF8     | C       | C     |
   >  (1 row)
   >
   >  postgres=# explain (analyze,buffers,COSTS,TIMING) postgres-# select
   >  MAX(toFloat(a, null)) as "a" from sampletest;
   >                                                         QUERY PLAN
   >  -----------------------------------------------------------------------------------------------------
   >  -------------------
   >  Aggregate  (cost=2137.00..2137.01 rows=1 width=4) (actual
   >  time=44962.279..44962.280 rows=1 loops=1)
   >     Buffers: shared hit=657
   >     ->  Seq Scan on sampletest  (cost=0.00..1637.00 rows=100000
   >  width=15) (actual time=0.009..8.900 rows=100000 loops=1)
   >           Buffers: shared hit=637
   >   Planning:
   >     Buffers: shared hit=78
   >   Planning Time: 0.531 ms
   >   Execution Time: 44963.747 ms
   >  (8 rows)
   >
   >  and with locally compiled REL_13_STABLE's head on the same machine:
   >
   >  rjuju=# select version();
   >                            version
   >  ------------------------------------------------------------
   >   PostgreSQL 13.4, compiled by Visual C++ build 1929, 64-bit
   >  (1 row)
   >
   >  rjuju=# \l rjuju
   >                         List of databases  Name  | Owner | Encoding | Collate |
   >  Ctype | Access privileges
   >  -------+-------+----------+---------+-------+-------------------
   >   rjuju | rjuju | UTF8     | C       | C     |
   >  (1 row)
   >
   >  rjuju-# select MAX(toFloat(a, null)) as "a" from sampletest;
   >                                                        QUERY PLAN
   >  -----------------------------------------------------------------------------------------------------
   >  ------------------
   >   Aggregate  (cost=1477.84..1477.85 rows=1 width=4) (actual
   >  time=460.334..460.334 rows=1 loops=1)
   >     Buffers: shared hit=646 read=1
   >     ->  Seq Scan on sampletest  (cost=0.00..1197.56 rows=56056
   >  width=32) (actual time=0.010..7.612 rows=100000 loops=1)
   >           Buffers: shared hit=637
   >   Planning:
   >     Buffers: shared hit=20 read=1
   >   Planning Time: 0.125 ms
   >   Execution Time: 460.527 ms
   >  (8 rows)
   >
   >  Note that I followed [1], so I simply used "build" and "install".  I have no
   >  idea what is done by default and if NLS is included or not.
   >
   >  So if default build on windows has NLS included, it probably means that
   >  either there's something specific on edb's build (I have no idea how their
   >  build is produced) or their version of msvc is responsible for that.
   >
   >  [1]: https://www.postgresql.org/docs/current/install-windows-
   >  full.html#id-1.6.4.8.10


---------------------------------------------------------------------------------------------------------------------------------------------------

Hello,

So you are seeing a 100x difference.

   >   Execution Time: 44963.747 ms
   >   Execution Time: 460.527 ms

I see on https://www.postgresql.org/download/ that there is a different installer from 2ndQuadrant. I am going to try
thatone and see what I come up with. Are there any other "standard" distros of Postgres that I could try out?


Additionally, is there a DLL or EXE file that you could make available to me that I could simply patch on my current
installand see if it makes any difference? Or a zip of the lib/bin folders? I found out I could download Visual Studio
communityedition so I am trying this, but may not have the time to get through a build any time soon as per my
unfamiliaritywith the process. I'll follow Ranier's steps and see if that gets me somewhere.


Thank you,
Laurent.
RE: Big Performance drop of Exceptions in UDFs between V11.2 and 13.4
   >  I see on https://www.postgresql.org/download/ that there is a different
   >  installer from 2ndQuadrant. I am going to try that one and see what I
   >  come up with. Are there any other "standard" distros of Postgres that I
   >  could try out?
   >
   >  I found out I could download Visual Studio community edition so I am
   >  trying this, but may not have the time to get through a build any time
   >  soon as per my unfamiliarity with the process. I'll follow Ranier's steps
   >  and see if that gets me somewhere.
   >
   >  Thank you,
   >  Laurent.


Hello all,

I think I had a breakthrough. I tried to create a local build and wasn't able to. But I downloaded the 2nd Quadrant
installerand the issue disappeared!!! I think this is proof that it's not my personal environment, nor something
intrinsicin the codebase, but definitely something in the standard EDB installer.


create table sampletest (a varchar, b varchar);
insert into sampletest (a, b)
select substr(md5(random()::text), 0, 15), (100000000*random())::integer::varchar
  from generate_series(1,100000);

CREATE OR REPLACE FUNCTION toFloat(str varchar, val real)
RETURNS real AS $$
BEGIN
  RETURN case when str is null then val else str::real end;
EXCEPTION WHEN OTHERS THEN
  RETURN val;
END;
$$ LANGUAGE plpgsql COST 1 IMMUTABLE;

explain (analyze,buffers,COSTS,TIMING) select MAX(toFloat(a, null)) as "a" from sampletest;
--Aggregate  (cost=2137.00..2137.01 rows=1 width=4) (actual time=2092.922..2092.923 rows=1 loops=1)
--  Buffers: shared hit=637
--  ->  Seq Scan on sampletest  (cost=0.00..1637.00 rows=100000 width=15) (actual time=0.028..23.925 rows=100000
loops=1)
--        Buffers: shared hit=637
--Planning Time: 0.168 ms
--Execution Time: 2092.957 ms

explain (analyze,buffers,COSTS,TIMING) select MAX(toFloat(b, null)) as "b" from sampletest;
--Aggregate  (cost=2137.00..2137.01 rows=1 width=4) (actual time=369.475..369.476 rows=1 loops=1)
--  Buffers: shared hit=637
--  ->  Seq Scan on sampletest  (cost=0.00..1637.00 rows=100000 width=8) (actual time=0.020..18.746 rows=100000
loops=1)
--        Buffers: shared hit=637
--Planning Time: 0.129 ms
--Execution Time: 369.507 ms


Thank you,
Laurent!
-----Message d'origine-----
De : ldh@laurent-hasson.com <ldh@laurent-hasson.com>
Envoyé : mardi 31 août 2021 04:18
À : ldh@laurent-hasson.com; Julien Rouhaud <rjuju123@gmail.com>
Cc : Tom Lane <tgl@sss.pgh.pa.us>; Ranier Vilela <ranier.vf@gmail.com>; Andrew Dunstan <andrew@dunslane.net>; Justin
Pryzby<pryzby@telsasoft.com>; pgsql-performance@postgresql.org
Objet : RE: Big Performance drop of Exceptions in UDFs between V11.2 and 13.4
Importance : Haute


   >  I see on https://www.postgresql.org/download/ that there is a different
   >  installer from 2ndQuadrant. I am going to try that one and see what I
   >  come up with. Are there any other "standard" distros of Postgres that I
   >  could try out?
   >
   >  I found out I could download Visual Studio community edition so I am
   >  trying this, but may not have the time to get through a build any time
   >  soon as per my unfamiliarity with the process. I'll follow Ranier's steps
   >  and see if that gets me somewhere.
   >
   >  Thank you,
   >  Laurent.


Hello all,

I think I had a breakthrough. I tried to create a local build and wasn't able to. But I downloaded the 2nd Quadrant
installerand the issue disappeared!!! I think this is proof that it's not my personal environment, nor something
intrinsicin the codebase, but definitely something in the standard EDB installer.


create table sampletest (a varchar, b varchar); insert into sampletest (a, b) select substr(md5(random()::text), 0,
15),(100000000*random())::integer::varchar
  from generate_series(1,100000);

CREATE OR REPLACE FUNCTION toFloat(str varchar, val real) RETURNS real AS $$ BEGIN
  RETURN case when str is null then val else str::real end; EXCEPTION WHEN OTHERS THEN
  RETURN val;
END;
$$ LANGUAGE plpgsql COST 1 IMMUTABLE;

explain (analyze,buffers,COSTS,TIMING) select MAX(toFloat(a, null)) as "a" from sampletest; --Aggregate
(cost=2137.00..2137.01rows=1 width=4) (actual time=2092.922..2092.923 rows=1 loops=1)
--  Buffers: shared hit=637
--  ->  Seq Scan on sampletest  (cost=0.00..1637.00 rows=100000 width=15) (actual time=0.028..23.925 rows=100000
loops=1)
--        Buffers: shared hit=637
--Planning Time: 0.168 ms
--Execution Time: 2092.957 ms

explain (analyze,buffers,COSTS,TIMING) select MAX(toFloat(b, null)) as "b" from sampletest; --Aggregate
(cost=2137.00..2137.01rows=1 width=4) (actual time=369.475..369.476 rows=1 loops=1)
--  Buffers: shared hit=637
--  ->  Seq Scan on sampletest  (cost=0.00..1637.00 rows=100000 width=8) (actual time=0.020..18.746 rows=100000
loops=1)
--        Buffers: shared hit=637
--Planning Time: 0.129 ms
--Execution Time: 369.507 ms


Thank you,
Laurent!

_________________________________________________________
Hi,

Something which has nothing with the thread but I think it must be said :-)
Why substring(x, 0, ...)?
msym=> select substr('abcde', 0, 3),  substr('abcde', 1, 3);
 substr | substr
--------+--------
 ab     | abc

Michel SALAIS
On 8/30/21 10:18 PM, ldh@laurent-hasson.com wrote:
>    >  I see on https://www.postgresql.org/download/ that there is a different
>    >  installer from 2ndQuadrant. I am going to try that one and see what I
>    >  come up with. Are there any other "standard" distros of Postgres that I
>    >  could try out?
>    >
>    >  I found out I could download Visual Studio community edition so I am
>    >  trying this, but may not have the time to get through a build any time
>    >  soon as per my unfamiliarity with the process. I'll follow Ranier's steps
>    >  and see if that gets me somewhere.
>    >
>    >  Thank you,
>    >  Laurent.
>
>
> Hello all,
>
> I think I had a breakthrough. I tried to create a local build and wasn't able to. But I downloaded the 2nd Quadrant
installerand the issue disappeared!!! I think this is proof that it's not my personal environment, nor something
intrinsicin the codebase, but definitely something in the standard EDB installer.

>
>

No, you're on the wrong track. As I reported earlier, I have reproduced
this issue with a vanilla build which has no installer involvement
whatsoever.

I'm pretty sure the reason you are not seeing this with the 2ndQuadrant
installer is quite simple: it wasn't build with NLS support.

Let me repeat what I said earlier. I will get to the bottom of this.
Please be patient and stop running after red herrings.


cheers


andrew


--
Andrew Dunstan
EDB: https://www.enterprisedb.com
RE: Big Performance drop of Exceptions in UDFs between V11.2 and 13.4
   >  -----Original Message-----
   >  From: Andrew Dunstan <andrew@dunslane.net>
   >  Sent: Tuesday, August 31, 2021 09:40
   >  To: ldh@laurent-hasson.com; Julien Rouhaud <rjuju123@gmail.com>
   >  Cc: Tom Lane <tgl@sss.pgh.pa.us>; Ranier Vilela <ranier.vf@gmail.com>;
   >  Justin Pryzby <pryzby@telsasoft.com>; pgsql-
   >  performance@postgresql.org
   >  Subject: Re: Big Performance drop of Exceptions in UDFs between V11.2
   >  and 13.4
   >
   >
   >  On 8/30/21 10:18 PM, ldh@laurent-hasson.com wrote:
   >  >    >  I see on https://www.postgresql.org/download/ that there is a
   >  different
   >  >    >  installer from 2ndQuadrant. I am going to try that one and see
   >  what I
   >  >    >  come up with. Are there any other "standard" distros of Postgres
   >  that I
   >  >    >  could try out?
   >  >    >
   >  >    >  I found out I could download Visual Studio community edition so I
   >  am
   >  >    >  trying this, but may not have the time to get through a build any
   >  time
   >  >    >  soon as per my unfamiliarity with the process. I'll follow Ranier's
   >  steps
   >  >    >  and see if that gets me somewhere.
   >  >    >
   >  >    >  Thank you,
   >  >    >  Laurent.
   >  >
   >  >
   >  > Hello all,
   >  >
   >  > I think I had a breakthrough. I tried to create a local build and wasn't
   >  able to. But I downloaded the 2nd Quadrant installer and the issue
   >  disappeared!!! I think this is proof that it's not my personal
   >  environment, nor something intrinsic in the codebase, but definitely
   >  something in the standard EDB installer.
   >  >
   >  >
   >
   >  No, you're on the wrong track. As I reported earlier, I have reproduced
   >  this issue with a vanilla build which has no installer involvement
   >  whatsoever.
   >
   >  I'm pretty sure the reason you are not seeing this with the 2ndQuadrant
   >  installer is quite simple: it wasn't build with NLS support.
   >
   >  Let me repeat what I said earlier. I will get to the bottom of this.
   >  Please be patient and stop running after red herrings.
   >
   >
   >  cheers
   >
   >
   >  andrew
   >
   >
   >  --
   >  Andrew Dunstan
   >  EDB: https://www.enterprisedb.com

OK... I thought that track had been abandoned as per Julien's last message. Anyways, I'll be patient!

Thank you for all the work.
Laurent.
On Tue, Aug 31, 2021 at 10:51 PM ldh@laurent-hasson.com
<ldh@laurent-hasson.com> wrote:
>
> OK... I thought that track had been abandoned as per Julien's last message. Anyways, I'll be patient!
>

I just happened to have both standard installer and locally compiled
versions available, so I could confirm that I reproduced the problem
at least with the standard installer.  Note that my message also said
" if default build on windows has NLS included".  After looking a bit
more into the Windows build system, I confirm that NLS isn't included
by default so this is not the problem, as Andrew said.

After installing gettext and a few other dependencies, adapting
config.pl I wish I could also confirm being able to reproduce the
problem on my build, but apparently I'm missing something as I can't
get any modification in config.pl have any effect.  I'm not gonna
waste more time on that since Andrew is already in the middle of the
investigation.
On 8/31/21 11:37 AM, Julien Rouhaud wrote:
> On Tue, Aug 31, 2021 at 10:51 PM ldh@laurent-hasson.com
> <ldh@laurent-hasson.com> wrote:
>> OK... I thought that track had been abandoned as per Julien's last message. Anyways, I'll be patient!
>>
> I just happened to have both standard installer and locally compiled
> versions available, so I could confirm that I reproduced the problem
> at least with the standard installer.  Note that my message also said
> " if default build on windows has NLS included".  After looking a bit
> more into the Windows build system, I confirm that NLS isn't included
> by default so this is not the problem, as Andrew said.
>
> After installing gettext and a few other dependencies, adapting
> config.pl I wish I could also confirm being able to reproduce the
> problem on my build, but apparently I'm missing something as I can't
> get any modification in config.pl have any effect.  I'm not gonna
> waste more time on that since Andrew is already in the middle of the
> investigation.


The culprit turns out to be the precise version of libiconv/libintl
used. There is a slight difference between the versions used in the
11.13 installer and the 13.4 installer. We need to dig into performance
more (e.g. why does the test take much longer on an NLS enabled build
even when we are using 'initdb --no-locale'?) But I'm pretty confident
now that this is the issue. I've started talks with our installer guys
about fixing it.


cheers


andrew


--
Andrew Dunstan
EDB: https://www.enterprisedb.com
On Wed, Sep 1, 2021 at 1:56 AM Andrew Dunstan <andrew@dunslane.net> wrote:
>
> The culprit turns out to be the precise version of libiconv/libintl
> used. There is a slight difference between the versions used in the
> 11.13 installer and the 13.4 installer. We need to dig into performance
> more (e.g. why does the test take much longer on an NLS enabled build
> even when we are using 'initdb --no-locale'?) But I'm pretty confident
> now that this is the issue. I've started talks with our installer guys
> about fixing it.

FTR it's consistent with my own setup.  I could finally compile
postgres with NLS support and libintl 0.18.1 and I only got a limited
overhead: the runtime increases from ~460ms to ~1.5s (and ~2s with
lc_messages to something else than C), but that's way better than the
~44s with the current edb version.
On 8/31/21 1:55 PM, Andrew Dunstan wrote:
> On 8/31/21 11:37 AM, Julien Rouhaud wrote:
>> On Tue, Aug 31, 2021 at 10:51 PM ldh@laurent-hasson.com
>> <ldh@laurent-hasson.com> wrote:
>>> OK... I thought that track had been abandoned as per Julien's last message. Anyways, I'll be patient!
>>>
>> I just happened to have both standard installer and locally compiled
>> versions available, so I could confirm that I reproduced the problem
>> at least with the standard installer.  Note that my message also said
>> " if default build on windows has NLS included".  After looking a bit
>> more into the Windows build system, I confirm that NLS isn't included
>> by default so this is not the problem, as Andrew said.
>>
>> After installing gettext and a few other dependencies, adapting
>> config.pl I wish I could also confirm being able to reproduce the
>> problem on my build, but apparently I'm missing something as I can't
>> get any modification in config.pl have any effect.  I'm not gonna
>> waste more time on that since Andrew is already in the middle of the
>> investigation.
>
>
> The culprit turns out to be the precise version of libiconv/libintl
> used. There is a slight difference between the versions used in the
> 11.13 installer and the 13.4 installer. We need to dig into performance
> more (e.g. why does the test take much longer on an NLS enabled build
> even when we are using 'initdb --no-locale'?) But I'm pretty confident
> now that this is the issue. I've started talks with our installer guys
> about fixing it.
>
>


Here are a couple of pictures of profiles made with a tool called
sleepy. The bad profile is from release 13.4 built with the latest
gettext, built with vcpkg. The good profile is the same build but using
the intl-8.dll copied from the release 11.13 installer. The good run
takes about a minute. The bad run takes about 30 minutes.


I'm not exactly sure what the profiles tell us.


cheers


andrew


--
Andrew Dunstan
EDB: https://www.enterprisedb.com
Attachment
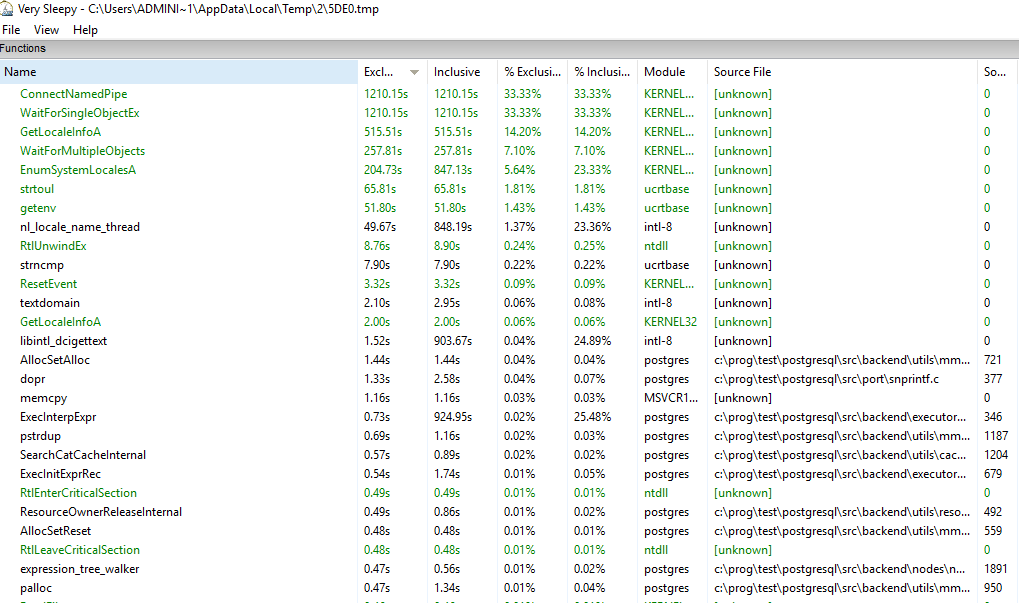
On Thu, Sep 2, 2021 at 11:22 PM Andrew Dunstan <andrew@dunslane.net> wrote:
>
> Here are a couple of pictures of profiles made with a tool called
> sleepy. The bad profile is from release 13.4 built with the latest
> gettext, built with vcpkg. The good profile is the same build but using
> the intl-8.dll copied from the release 11.13 installer. The good run
> takes about a minute. The bad run takes about 30 minutes.
>
>
> I'm not exactly sure what the profiles tell us.

Isn't GetLocaleInfoA suspicious?  Especially since the doc [1] says
that it shouldn't be called anymore unless you want to have
compatibility with OS from more than a decade ago?

[1] https://docs.microsoft.com/en-us/windows/win32/api/winnls/nf-winnls-getlocaleinfoa
On 8/31/21 1:55 PM, Andrew Dunstan wrote:
> On 8/31/21 11:37 AM, Julien Rouhaud wrote:
>> On Tue, Aug 31, 2021 at 10:51 PM ldh@laurent-hasson.com
>> <ldh@laurent-hasson.com> wrote:
>>> OK... I thought that track had been abandoned as per Julien's last message. Anyways, I'll be patient!
>>>
>> I just happened to have both standard installer and locally compiled
>> versions available, so I could confirm that I reproduced the problem
>> at least with the standard installer. Note that my message also said
>> " if default build on windows has NLS included". After looking a bit
>> more into the Windows build system, I confirm that NLS isn't included
>> by default so this is not the problem, as Andrew said.
>>
>> After installing gettext and a few other dependencies, adapting
>> config.pl I wish I could also confirm being able to reproduce the
>> problem on my build, but apparently I'm missing something as I can't
>> get any modification in config.pl have any effect. I'm not gonna
>> waste more time on that since Andrew is already in the middle of the
>> investigation.
>
>
> The culprit turns out to be the precise version of libiconv/libintl
> used. There is a slight difference between the versions used in the
> 11.13 installer and the 13.4 installer. We need to dig into performance
> more (e.g. why does the test take much longer on an NLS enabled build
> even when we are using 'initdb --no-locale'?) But I'm pretty confident
> now that this is the issue. I've started talks with our installer guys
> about fixing it.
>
>
Here are a couple of pictures of profiles made with a tool called
sleepy. The bad profile is from release 13.4 built with the latest
gettext, built with vcpkg. The good profile is the same build but using
the intl-8.dll copied from the release 11.13 installer. The good run
takes about a minute. The bad run takes about 30 minutes.
I'm not exactly sure what the profiles tell us.
libintl doesn't cache untranslated strings
On 9/2/21 11:34 AM, Julien Rouhaud wrote:
> On Thu, Sep 2, 2021 at 11:22 PM Andrew Dunstan <andrew@dunslane.net> wrote:
>> Here are a couple of pictures of profiles made with a tool called
>> sleepy. The bad profile is from release 13.4 built with the latest
>> gettext, built with vcpkg. The good profile is the same build but using
>> the intl-8.dll copied from the release 11.13 installer. The good run
>> takes about a minute. The bad run takes about 30 minutes.
>>
>>
>> I'm not exactly sure what the profiles tell us.
> Isn't GetLocaleInfoA suspicious?  Especially since the doc [1] says
> that it shouldn't be called anymore unless you want to have
> compatibility with OS from more than a decade ago?
>
> [1] https://docs.microsoft.com/en-us/windows/win32/api/winnls/nf-winnls-getlocaleinfoa

Possibly, but the profile doesn't show it as having a great impact.

Maybe surrounding code is affected.

cheers

andrew


--
Andrew Dunstan
EDB: https://www.enterprisedb.com
RE: Big Performance drop of Exceptions in UDFs between V11.2 and 13.4
   >  -----Original Message-----
   >  From: Andrew Dunstan <andrew@dunslane.net>
   >  Sent: Thursday, September 2, 2021 13:00
   >  To: Julien Rouhaud <rjuju123@gmail.com>
   >  Cc: ldh@laurent-hasson.com; Tom Lane <tgl@sss.pgh.pa.us>; Ranier
   >  Vilela <ranier.vf@gmail.com>; Justin Pryzby <pryzby@telsasoft.com>;
   >  pgsql-performance@postgresql.org
   >  Subject: Re: Big Performance drop of Exceptions in UDFs between V11.2
   >  and 13.4
   >
   >
   >  On 9/2/21 11:34 AM, Julien Rouhaud wrote:
   >  > On Thu, Sep 2, 2021 at 11:22 PM Andrew Dunstan
   >  <andrew@dunslane.net> wrote:
   >  >> Here are a couple of pictures of profiles made with a tool called
   >  >> sleepy. The bad profile is from release 13.4 built with the latest
   >  >> gettext, built with vcpkg. The good profile is the same build but
   >  >> using the intl-8.dll copied from the release 11.13 installer. The
   >  >> good run takes about a minute. The bad run takes about 30 minutes.
   >  >>
   >  >>
   >  >> I'm not exactly sure what the profiles tell us.
   >  > Isn't GetLocaleInfoA suspicious?  Especially since the doc [1] says
   >  > that it shouldn't be called anymore unless you want to have
   >  > compatibility with OS from more than a decade ago?
   >  >
   >  > [1]
   >  > https://docs.microsoft.com/en-us/windows/win32/api/winnls/nf-
   >  winnls-ge
   >  > tlocaleinfoa
   >
   >  Possibly, but the profile doesn't show it as having a great impact.
   >
   >  Maybe surrounding code is affected.
   >
   >  cheers
   >
   >  andrew
   >
   >
   >  --
   >  Andrew Dunstan
   >  EDB: https://www.enterprisedb.com


Hello all,

Any further update or guidance on this issue at this time?

Thank you,
Laurent.
On 9/13/21 10:32 AM, ldh@laurent-hasson.com wrote:
>
> Hello all,
>
> Any further update or guidance on this issue at this time?
>

Wait for a new installer. Our team is working on it. As I have
previously advised you, please be patient.


cheers


andrew

--
Andrew Dunstan
EDB: https://www.enterprisedb.com
RE: Big Performance drop of Exceptions in UDFs between V11.2 and 13.4
   >  -----Original Message-----
   >  From: Andrew Dunstan <andrew@dunslane.net>
   >  Sent: Monday, September 13, 2021 11:36
   >  To: ldh@laurent-hasson.com; Julien Rouhaud <rjuju123@gmail.com>
   >  Cc: Tom Lane <tgl@sss.pgh.pa.us>; Ranier Vilela <ranier.vf@gmail.com>;
   >  Justin Pryzby <pryzby@telsasoft.com>; pgsql-
   >  performance@postgresql.org
   >  Subject: Re: Big Performance drop of Exceptions in UDFs between V11.2
   >  and 13.4
   >
   >
   >  On 9/13/21 10:32 AM, ldh@laurent-hasson.com wrote:
   >  >
   >  > Hello all,
   >  >
   >  > Any further update or guidance on this issue at this time?
   >  >
   >
   >  Wait for a new installer. Our team is working on it. As I have previously
   >  advised you, please be patient.
   >
   >
   >  cheers
   >
   >
   >  andrew
   >
   >  --
   >  Andrew Dunstan
   >  EDB: https://www.enterprisedb.com


Hello Andrew,

I'll be as patient as is needed and appreciate absolutely all the work you are all doing. I also know V14 is just
aroundthe corner too so the team is super busy 😊


Just looking for some super-rough ETA for some rough planning on our end. Is this something potentially for 13.5 later
thisyear? Or something that may happen before the end of Sept? Or still unknown? And I understand all is always
tentative.

Thank you!
Laurent.
On 9/13/21 11:53 AM, ldh@laurent-hasson.com wrote:
>
>    >  -----Original Message-----
>    >  From: Andrew Dunstan <andrew@dunslane.net>
>    >  Sent: Monday, September 13, 2021 11:36
>    >  To: ldh@laurent-hasson.com; Julien Rouhaud <rjuju123@gmail.com>
>    >  Cc: Tom Lane <tgl@sss.pgh.pa.us>; Ranier Vilela <ranier.vf@gmail.com>;
>    >  Justin Pryzby <pryzby@telsasoft.com>; pgsql-
>    >  performance@postgresql.org
>    >  Subject: Re: Big Performance drop of Exceptions in UDFs between V11.2
>    >  and 13.4
>    >
>    >
>    >  On 9/13/21 10:32 AM, ldh@laurent-hasson.com wrote:
>    >  >
>    >  > Hello all,
>    >  >
>    >  > Any further update or guidance on this issue at this time?
>    >  >
>    >
>    >  Wait for a new installer. Our team is working on it. As I have previously
>    >  advised you, please be patient.
>    >
>    >
>    >  cheers
>    >
>    >
>    >  andrew
>    >
>    >  --
>    >  Andrew Dunstan
>    >  EDB: https://www.enterprisedb.com
>
>
> Hello Andrew,
>
> I'll be as patient as is needed and appreciate absolutely all the work you are all doing. I also know V14 is just
aroundthe corner too so the team is super busy 😊

>
> Just looking for some super-rough ETA for some rough planning on our end. Is this something potentially for 13.5
laterthis year? Or something that may happen before the end of Sept? Or still unknown? And I understand all is always
tentative.
>

This is not governed at all by the Postgres release cycle. The issue is
not with Postgres but with the version of libintl used in the build. I
can't speak for the team, they will publish an updated installer when
they get it done. But rest assured it's being worked on. I got email
about it just this morning.


cheers


andrew


--
Andrew Dunstan
EDB: https://www.enterprisedb.com
On 9/13/21 4:36 PM, Andrew Dunstan wrote:
> On 9/13/21 11:53 AM, ldh@laurent-hasson.com wrote:
>>    >  -----Original Message-----
>>    >  From: Andrew Dunstan <andrew@dunslane.net>
>>    >  Sent: Monday, September 13, 2021 11:36
>>    >  To: ldh@laurent-hasson.com; Julien Rouhaud <rjuju123@gmail.com>
>>    >  Cc: Tom Lane <tgl@sss.pgh.pa.us>; Ranier Vilela <ranier.vf@gmail.com>;
>>    >  Justin Pryzby <pryzby@telsasoft.com>; pgsql-
>>    >  performance@postgresql.org
>>    >  Subject: Re: Big Performance drop of Exceptions in UDFs between V11.2
>>    >  and 13.4
>>    >
>>    >
>>    >  On 9/13/21 10:32 AM, ldh@laurent-hasson.com wrote:
>>    >  >
>>    >  > Hello all,
>>    >  >
>>    >  > Any further update or guidance on this issue at this time?
>>    >  >
>>    >
>>    >  Wait for a new installer. Our team is working on it. As I have previously
>>    >  advised you, please be patient.
>>    >
>>    >
>>    >  cheers
>>    >
>>    >
>>    >  andrew
>>    >
>>    >  --
>>    >  Andrew Dunstan
>>    >  EDB: https://www.enterprisedb.com
>>
>>
>> Hello Andrew,
>>
>> I'll be as patient as is needed and appreciate absolutely all the work you are all doing. I also know V14 is just
aroundthe corner too so the team is super busy 😊

>>
>> Just looking for some super-rough ETA for some rough planning on our end. Is this something potentially for 13.5
laterthis year? Or something that may happen before the end of Sept? Or still unknown? And I understand all is always
tentative.
>>
> This is not governed at all by the Postgres release cycle. The issue is
> not with Postgres but with the version of libintl used in the build. I
> can't speak for the team, they will publish an updated installer when
> they get it done. But rest assured it's being worked on. I got email
> about it just this morning.
>
>

EDB has now published new installers for versions later than release 11,
containing Postgres built with an earlier version of gettext that does
not exhibit the problem. Please verify that these fix the issue. If you
already have Postgres installed from our installer you should be able to
upgrade using Stackbuilder. Otherwise, you can download from our usual
download sites.


cheers


andrew


--
Andrew Dunstan
EDB: https://www.enterprisedb.com
RE: Big Performance drop of Exceptions in UDFs between V11.2 and 13.4
> -----Original Message-----
> From: Andrew Dunstan <andrew@dunslane.net>
> Sent: Friday, September 24, 2021 16:57
> To: ldh@laurent-hasson.com; Julien Rouhaud <rjuju123@gmail.com>
> Cc: Tom Lane <tgl@sss.pgh.pa.us>; Ranier Vilela <ranier.vf@gmail.com>;
> Justin Pryzby <pryzby@telsasoft.com>; pgsql-performance@postgresql.org
> Subject: Re: Big Performance drop of Exceptions in UDFs between V11.2 and
> 13.4
>
>
> On 9/13/21 4:36 PM, Andrew Dunstan wrote:
> > On 9/13/21 11:53 AM, ldh@laurent-hasson.com wrote:
> >>    >  -----Original Message-----
> >>    >  From: Andrew Dunstan <andrew@dunslane.net>
> >>    >  Sent: Monday, September 13, 2021 11:36
> >>    >  To: ldh@laurent-hasson.com; Julien Rouhaud <rjuju123@gmail.com>
> >>    >  Cc: Tom Lane <tgl@sss.pgh.pa.us>; Ranier Vilela
> <ranier.vf@gmail.com>;
> >>    >  Justin Pryzby <pryzby@telsasoft.com>; pgsql-
> >>    >  performance@postgresql.org
> >>    >  Subject: Re: Big Performance drop of Exceptions in UDFs between
> V11.2
> >>    >  and 13.4
> >>    >
> >>    >
> >>    >  On 9/13/21 10:32 AM, ldh@laurent-hasson.com wrote:
> >>    >  >
> >>    >  > Hello all,
> >>    >  >
> >>    >  > Any further update or guidance on this issue at this time?
> >>    >  >
> >>    >
> >>    >  Wait for a new installer. Our team is working on it. As I have previously
> >>    >  advised you, please be patient.
> >>    >
> >>    >
> >>    >  cheers
> >>    >
> >>    >
> >>    >  andrew
> >>    >
> >>    >  --
> >>    >  Andrew Dunstan
> >>    >  EDB: https://www.enterprisedb.com
> >>
> >>
> >> Hello Andrew,
> >>
> >> I'll be as patient as is needed and appreciate absolutely all the
> >> work you are all doing. I also know V14 is just around the corner too
> >> so the team is super busy 😊
> >>
> >> Just looking for some super-rough ETA for some rough planning on our
> end. Is this something potentially for 13.5 later this year? Or something that
> may happen before the end of Sept? Or still unknown? And I understand all
> is always tentative.
> >>
> > This is not governed at all by the Postgres release cycle. The issue
> > is not with Postgres but with the version of libintl used in the
> > build. I can't speak for the team, they will publish an updated
> > installer when they get it done. But rest assured it's being worked
> > on. I got email about it just this morning.
> >
> >
>
> EDB has now published new installers for versions later than release 11,
> containing Postgres built with an earlier version of gettext that does not
> exhibit the problem. Please verify that these fix the issue. If you already
> have Postgres installed from our installer you should be able to upgrade
> using Stackbuilder. Otherwise, you can download from our usual download
> sites.
>
>
> cheers
>
>
> andrew
>
>
> --
> Andrew Dunstan
> EDB: https://www.enterprisedb.com

[Laurent Hasson]

Thank you Andrew!!! I may be able to check this over the weekend.

Thank you,
Laurent.
RE: Big Performance drop of Exceptions in UDFs between V11.2 and 13.4
   >  > EDB has now published new installers for versions later than release
   >  > 11, containing Postgres built with an earlier version of gettext that
   >  > does not exhibit the problem. Please verify that these fix the issue.
   >  > If you already have Postgres installed from our installer you should
   >  > be able to upgrade using Stackbuilder. Otherwise, you can download
   >  > from our usual download sites.
   >  >
   >  > cheers
   >  >
   >  > andrew
   >  >
   >  > --
   >  > Andrew Dunstan
   >  > EDB: https://www.enterprisedb.com


Hello Andrew,

I just download the 13.4 Windows x86-64 installer from
https://www.enterprisedb.com/downloads/postgres-postgresql-downloadsbut it's the exact same file bit for bit from the
previousversion I had. Am I looking at the wrong place?


Thank you
Laurent.
On 9/25/21 9:33 PM, ldh@laurent-hasson.com wrote:
>    >  > EDB has now published new installers for versions later than release
>    >  > 11, containing Postgres built with an earlier version of gettext that
>    >  > does not exhibit the problem. Please verify that these fix the issue.
>    >  > If you already have Postgres installed from our installer you should
>    >  > be able to upgrade using Stackbuilder. Otherwise, you can download
>    >  > from our usual download sites.
>    >  >
>    >  > cheers
>    >  >
>    >  > andrew
>    >  >
>    >  > --
>    >  > Andrew Dunstan
>    >  > EDB: https://www.enterprisedb.com
>
>
> Hello Andrew,
>
> I just download the 13.4 Windows x86-64 installer from
https://www.enterprisedb.com/downloads/postgres-postgresql-downloadsbut it's the exact same file bit for bit from the
previousversion I had. Am I looking at the wrong place?

>

Thanks. We're dealing with that. However, you can update that version
via stackbuilder. It will show you that 13.4.2 is available. This has
the correct libintl DLL. I just did this to verify it.


cheers


andrew


--
Andrew Dunstan
EDB: https://www.enterprisedb.com
Hello Andrew,

I just download the 13.4 Windows x86-64 installer from https://www.enterprisedb.com/downloads/postgres-postgresql-downloads but it's the exact same file bit for bit from the previous version I had. Am I looking at the wrong place?
Thanks. We're dealing with that. However, you can update that version via stackbuilder. It will show you that 13.4.2 is available. This has the correct libintl DLL. I just did this to verify it.
Thanks, look like the issue is fixed now, you can try to download the 'postgresql-13.4-2-windows-x64.exe' installer from the above mentioned link.
--
regards,tushar
EnterpriseDB  https://www.enterprisedb.com/
The Enterprise PostgreSQL Company
RE: Big Performance drop of Exceptions in UDFs between V11.2 and 13.4
From: tushar <tushar.ahuja@enterprisedb.com>
Sent: Monday, September 27, 2021 11:50
To: Andrew Dunstan <andrew@dunslane.net>; ldh@laurent-hasson.com; Julien Rouhaud <rjuju123@gmail.com>
Cc: Tom Lane <tgl@sss.pgh.pa.us>; Ranier Vilela <ranier.vf@gmail.com>; Justin Pryzby <pryzby@telsasoft.com>;
pgsql-performance@postgresql.org
Subject: Re: Big Performance drop of Exceptions in UDFs between V11.2 and 13.4

On 9/27/21 6:55 PM, Andrew Dunstan wrote:
Hello Andrew,

I just download the 13.4 Windows x86-64 installer from
https://www.enterprisedb.com/downloads/postgres-postgresql-downloadsbut it's the exact same file bit for bit from the
previousversion I had. Am I looking at the wrong place?


Thanks. We're dealing with that. However, you can update that version
via stackbuilder. It will show you that 13.4.2 is available. This has
the correct libintl DLL. I just did this to verify it.
Thanks, look like the issue is fixed now, you can try to download the 'postgresql-13.4-2-windows-x64.exe' installer
fromthe above mentioned link.

--
regards,tushar
EnterpriseDB  https://www.enterprisedb.com/
The Enterprise PostgreSQL Company


Fantastic, I may be able to try again tonight and will report back. The environment I work in is isolated from the
internet,so I can't use StackBuilder.


Thank you,
Laurent.
RE: Big Performance drop of Exceptions in UDFs between V11.2 and 13.4
From: tushar <tushar.ahuja@enterprisedb.com>
Sent: Monday, September 27, 2021 11:50
To: Andrew Dunstan <andrew@dunslane.net>; ldh@laurent-hasson.com; Julien Rouhaud <rjuju123@gmail.com>
Cc: Tom Lane <tgl@sss.pgh.pa.us>; Ranier Vilela <ranier.vf@gmail.com>; Justin Pryzby <pryzby@telsasoft.com>;
pgsql-performance@postgresql.org
Subject: Re: Big Performance drop of Exceptions in UDFs between V11.2 and 13.4

On 9/27/21 6:55 PM, Andrew Dunstan wrote:
Hello Andrew,

I just download the 13.4 Windows x86-64 installer from
https://www.enterprisedb.com/downloads/postgres-postgresql-downloadsbut it's the exact same file bit for bit from the
previousversion I had. Am I looking at the wrong place?


Thanks. We're dealing with that. However, you can update that version
via stackbuilder. It will show you that 13.4.2 is available. This has
the correct libintl DLL. I just did this to verify it.

Thanks, look like the issue is fixed now, you can try to download the 'postgresql-13.4-2-windows-x64.exe' installer
fromthe above mentioned link.

--
regards,tushar
EnterpriseDB  https://www.enterprisedb.com/
The Enterprise PostgreSQL Company


-------------------------------------------------------------------------------------------------------------------

Hello all!

WOW!!!! Time for a cigar as there is double good news 😊
- The scenario no longer exacerbates the system and performance went from around 90s to around 2.7 seconds! That's in
linewith older 11.2 builds I was measuring against.

- The simpler scenario (no throw) looks like it improved by roughly 20%, from 186ms to 146ms

I had run the scenarios multiple times before and the times were on the average, so I think those gains are real. Thank
youfor all your efforts. The Postgres community is amazing!


Here is the scenario again:

drop table sampletest;
create table sampletest (a varchar, b varchar);
insert into sampletest (a, b)
select substr(md5(random()::text), 0, 15), (100000000*random())::integer::varchar
  from generate_series(1,100000);
CREATE OR REPLACE FUNCTION toFloat(str varchar, val real)
RETURNS real AS $$
BEGIN
  RETURN case when str is null then val else str::real end;
EXCEPTION WHEN OTHERS THEN
  RETURN val;
END;
$$ LANGUAGE plpgsql COST 1 IMMUTABLE;

This is what I had on the original 13.4 Windows x64 eDB build:

explain (analyze,buffers,COSTS,TIMING)
select MAX(toFloat(a, null)) as "a" from sampletest
--Aggregate  (cost=1477.84..1477.85 rows=1 width=4) (actual time=89527.032..89527.033 rows=1 loops=1)
--  Buffers: shared hit=647
--  ->  Seq Scan on sampletest  (cost=0.00..1197.56 rows=56056 width=32) (actual time=0.024..37.811 rows=100000
loops=1)
--        Buffers: shared hit=637
--Planning:
--  Buffers: shared hit=24
--Planning Time: 0.347 ms
--Execution Time: 89527.501 ms


explain (analyze,buffers,COSTS,TIMING)
select MAX(toFloat(b, null)) as "b" from sampletest
--Aggregate  (cost=2137.00..2137.01 rows=1 width=4) (actual time=186.605..186.606 rows=1 loops=1)
--  Buffers: shared hit=637
--  ->  Seq Scan on sampletest  (cost=0.00..1637.00 rows=100000 width=8) (actual time=0.008..9.679 rows=100000
loops=1)
--        Buffers: shared hit=637
--Planning:
--  Buffers: shared hit=4
--Planning Time: 0.339 ms
--Execution Time: 186.641 ms


This is what I get on the new build

explain (analyze,buffers,COSTS,TIMING)
select MAX(toFloat(a, null)) as "a" from sampletest
--QUERY PLAN
|


-------------------------------------------------------------------------------------------------------------------------|
--Aggregate  (cost=2137.00..2137.01 rows=1 width=4) (actual time=2711.314..2711.315 rows=1 loops=1)
|

--  Buffers: shared hit=637
|

--  ->  Seq Scan on sampletest  (cost=0.00..1637.00 rows=100000 width=15) (actual time=0.009..12.557 rows=100000
loops=1)|
--        Buffers: shared hit=637
|

--Planning Time: 0.062 ms
|

--Execution Time: 2711.336 ms
|


explain (analyze,buffers,COSTS,TIMING)
select MAX(toFloat(b, null)) as "b" from sampletest
--QUERY PLAN
|

-----------------------------------------------------------------------------------------------------------------------|
--Aggregate  (cost=2137.00..2137.01 rows=1 width=4) (actual time=146.689..146.689 rows=1 loops=1)
|
--  Buffers: shared hit=637
|
--  ->  Seq Scan on sampletest  (cost=0.00..1637.00 rows=100000 width=8) (actual time=0.009..8.060 rows=100000
loops=1)|
--        Buffers: shared hit=637
|
--Planning Time: 0.060 ms
|
--Execution Time: 146.709 ms
|


Thank you,
Laurent.