Thread: Measuring replay lag
Hi hackers,

Here is a new version of my patch to add a replay_lag column to the
pg_stat_replication view (originally proposed as part of a larger
patch set for 9.6[1]), like this:

postgres=# select application_name, replay_lag from pg_stat_replication;
┌──────────────────┬─────────────────┐
│ application_name │   replay_lag    │
├──────────────────┼─────────────────┤
│ replica1         │ 00:00:00.595382 │
│ replica2         │ 00:00:00.598448 │
│ replica3         │ 00:00:00.541597 │
│ replica4         │ 00:00:00.551227 │
└──────────────────┴─────────────────┘
(4 rows)

It works by taking advantage of the { time, end-of-WAL } samples that
sending servers already include in message headers to standbys.  That
seems to provide a pretty good proxy for when the WAL was written, if
you ignore messages where the LSN hasn't advanced.  The patch
introduces a new GUC replay_lag_sample_interval, defaulting to 1s, to
control how often the standby should record these timestamped LSNs
into a small circular buffer.  When its recovery process eventually
replays a timestamped LSN, the timestamp is sent back to the upstream
server in a new reply message field.  The value visible in
pg_stat_replication.replay_lag can then be updated by comparing with
the current time.

Compared to the usual techniques people use to estimate replay lag,
this approach has the following advantages:

1.  The lag is measured in time, not LSN difference.
2.  The lag time is computed using two observations of a single
server's clock, so there is no clock skew.
3.  The lag is updated even between commits (during large data loads etc).

In the previous version I was effectively showing the ping time
between the servers during idle times when the standby was fully
caught up because there was nothing happening.  I decided that was not
useful information and that it's more newsworthy and interesting to
see the estimated replay lag for the most recent real replayed
activity, so I changed that.

In the last thread[1], Robert Haas wrote:
> Well, one problem with this is that you can't put a loop inside of a
> spinlock-protected critical section.

Fixed.

> In general, I think this is a pretty reasonable way of attacking this
> problem, but I'd say it's significantly under-commented.  Where should
> someone go to get a general overview of this mechanism?  The answer is
> not "at place XXX within the patch".  (I think it might merit some
> more extensive documentation, too, although I'm not exactly sure what
> that should look like.)

I have added lots of comments.

> When you overflow the buffer, you could thin in out in a smarter way,
> like by throwing away every other entry instead of the oldest one.  I
> guess you'd need to be careful how you coded that, though, because
> replaying an entry with a timestamp invalidates some of the saved
> entries without formally throwing them out.

Done, by overwriting the newest sample rather than the oldest if the
buffer is full.  That seems to give pretty reasonable degradation,
effectively lowering the sampling rate, without any complicated buffer
or rate management code.

> Conceivably, 0002 could be split into two patches, one of which
> computes "stupid replay lag" considering only records that naturally
> carry timestamps, and a second adding the circular buffer to handle
> the case where much time passes without finding such a record.

I contemplated this but decided that it'd be best to use ONLY samples
from walsender headers, and never use the time stamps from commit
records for this.  If we use times from commit records, then a
cascading sending server will not be able to compute the difference in
time without introducing clock skew (not to mention the difficulty of
combining timestamps from two sources if we try to do both).  I
figured that it's better to have value that shows a cascading
sender->standby->cascading sender round trip time that is free of
clock skew, than a master->cascading sender->standby->cascading sender
incomplete round trip that includes clock skew.

By the same reasoning I decided against introducing a new periodic WAL
record or field from the master to hold extra time stamps in between
commits to do this, in favour of the buffered transient timestamp
approach I took in this patch.  That said, I can see there are
arguments for doing it with extra periodic WAL timestamps, if people
don't think it'd be too invasive to mess with the WAL for this, and
don't care about cascading standbys giving skewed readings.  One
advantage would be that persistent WAL timestamps would still be able
to provide lag estimates if a standby has been down for a while and
was catching up, and this approach can't until it's caught up due to
lack of buffered transient timestamps.  Thoughts?

I plan to post a new "causal reads" patch at some point which will
depend on this, but in any case I think this is a useful feature on
its own.  I'd be grateful for any feedback, flames, better ideas etc.
Thanks for reading.

[1] https://www.postgresql.org/message-id/CAEepm%3D31yndQ7S5RdGofoGz1yQ-cteMrePR2JLf9gWGzxKcV7w%40mail.gmail.com

--
Thomas Munro
http://www.enterprisedb.com
Attachment
On Wed, Oct 26, 2016 at 7:34 PM, Thomas Munro
<thomas.munro@enterprisedb.com> wrote:
> Hi hackers,
>
> Here is a new version of my patch to add a replay_lag column to the
> pg_stat_replication view (originally proposed as part of a larger
> patch set for 9.6[1]), like this:

Thank you for working on this!

> postgres=# select application_name, replay_lag from pg_stat_replication;
> ┌──────────────────┬─────────────────┐
> │ application_name │   replay_lag    │
> ├──────────────────┼─────────────────┤
> │ replica1         │ 00:00:00.595382 │
> │ replica2         │ 00:00:00.598448 │
> │ replica3         │ 00:00:00.541597 │
> │ replica4         │ 00:00:00.551227 │
> └──────────────────┴─────────────────┘
> (4 rows)
>
> It works by taking advantage of the { time, end-of-WAL } samples that
> sending servers already include in message headers to standbys.  That
> seems to provide a pretty good proxy for when the WAL was written, if
> you ignore messages where the LSN hasn't advanced.  The patch
> introduces a new GUC replay_lag_sample_interval, defaulting to 1s, to
> control how often the standby should record these timestamped LSNs
> into a small circular buffer.  When its recovery process eventually
> replays a timestamped LSN, the timestamp is sent back to the upstream
> server in a new reply message field.  The value visible in
> pg_stat_replication.replay_lag can then be updated by comparing with
> the current time.

replay_lag_sample_interval is 1s by default but I got 1000s by SHOW command.
postgres(1:36789)=# show replay_lag_sample_interval ;replay_lag_sample_interval
----------------------------1000s
(1 row)

Also, I set replay_lag_sample_interval = 500ms, I got 0 by SHOW command.
postgres(1:99850)=# select name, setting, applied from
pg_file_settings where name = 'replay_lag_sample_interval';           name            | setting | applied
----------------------------+---------+---------replay_lag_sample_interval | 500ms   | t
(1 row)

postgres(1:99850)=# show replay_lag_sample_interval ;replay_lag_sample_interval
----------------------------0
(1 row)


> Compared to the usual techniques people use to estimate replay lag,
> this approach has the following advantages:
>
> 1.  The lag is measured in time, not LSN difference.
> 2.  The lag time is computed using two observations of a single
> server's clock, so there is no clock skew.
> 3.  The lag is updated even between commits (during large data loads etc).

I agree with this approach.

> In the previous version I was effectively showing the ping time
> between the servers during idle times when the standby was fully
> caught up because there was nothing happening.  I decided that was not
> useful information and that it's more newsworthy and interesting to
> see the estimated replay lag for the most recent real replayed
> activity, so I changed that.
>
> In the last thread[1], Robert Haas wrote:
>> Well, one problem with this is that you can't put a loop inside of a
>> spinlock-protected critical section.
>
> Fixed.
>
>> In general, I think this is a pretty reasonable way of attacking this
>> problem, but I'd say it's significantly under-commented.  Where should
>> someone go to get a general overview of this mechanism?  The answer is
>> not "at place XXX within the patch".  (I think it might merit some
>> more extensive documentation, too, although I'm not exactly sure what
>> that should look like.)
>
> I have added lots of comments.
>
>> When you overflow the buffer, you could thin in out in a smarter way,
>> like by throwing away every other entry instead of the oldest one.  I
>> guess you'd need to be careful how you coded that, though, because
>> replaying an entry with a timestamp invalidates some of the saved
>> entries without formally throwing them out.
>
> Done, by overwriting the newest sample rather than the oldest if the
> buffer is full.  That seems to give pretty reasonable degradation,
> effectively lowering the sampling rate, without any complicated buffer
> or rate management code.
>
>> Conceivably, 0002 could be split into two patches, one of which
>> computes "stupid replay lag" considering only records that naturally
>> carry timestamps, and a second adding the circular buffer to handle
>> the case where much time passes without finding such a record.
>
> I contemplated this but decided that it'd be best to use ONLY samples
> from walsender headers, and never use the time stamps from commit
> records for this.  If we use times from commit records, then a
> cascading sending server will not be able to compute the difference in
> time without introducing clock skew (not to mention the difficulty of
> combining timestamps from two sources if we try to do both).  I
> figured that it's better to have value that shows a cascading
> sender->standby->cascading sender round trip time that is free of
> clock skew, than a master->cascading sender->standby->cascading sender
> incomplete round trip that includes clock skew.
>
> By the same reasoning I decided against introducing a new periodic WAL
> record or field from the master to hold extra time stamps in between
> commits to do this, in favour of the buffered transient timestamp
> approach I took in this patch.

I think that you need to change sendFeedback() in pg_recvlogical.c and
receivexlog.c as well.

> That said, I can see there are
> arguments for doing it with extra periodic WAL timestamps, if people
> don't think it'd be too invasive to mess with the WAL for this, and
> don't care about cascading standbys giving skewed readings.  One
> advantage would be that persistent WAL timestamps would still be able
> to provide lag estimates if a standby has been down for a while and
> was catching up, and this approach can't until it's caught up due to
> lack of buffered transient timestamps.  Thoughts?
>
> I plan to post a new "causal reads" patch at some point which will
> depend on this, but in any case I think this is a useful feature on
> its own.  I'd be grateful for any feedback, flames, better ideas etc.
> Thanks for reading.
>
> [1] https://www.postgresql.org/message-id/CAEepm%3D31yndQ7S5RdGofoGz1yQ-cteMrePR2JLf9gWGzxKcV7w%40mail.gmail.com
>

Regards,

--
Masahiko Sawada
NIPPON TELEGRAPH AND TELEPHONE CORPORATION
NTT Open Source Software Center
On Tue, Nov 8, 2016 at 2:35 PM, Masahiko Sawada <sawada.mshk@gmail.com> wrote:
> replay_lag_sample_interval is 1s by default but I got 1000s by SHOW command.
> postgres(1:36789)=# show replay_lag_sample_interval ;
>  replay_lag_sample_interval
> ----------------------------
>  1000s
> (1 row)

Oops, fixed.

>> 1.  The lag is measured in time, not LSN difference.
>> 2.  The lag time is computed using two observations of a single
>> server's clock, so there is no clock skew.
>> 3.  The lag is updated even between commits (during large data loads etc).
>
> I agree with this approach.

Thanks for the feedback.

> I think that you need to change sendFeedback() in pg_recvlogical.c and
> receivexlog.c as well.

Right, fixed.

Thanks very much for testing!  New version attached.  I will add this
to the next CF.

--
Thomas Munro
http://www.enterprisedb.com
Attachment
On 11/22/16 4:27 AM, Thomas Munro wrote:
> Thanks very much for testing!  New version attached.  I will add this
> to the next CF.

I don't see it there yet.

--
Peter Eisentraut              http://www.2ndQuadrant.com/
PostgreSQL Development, 24x7 Support, Remote DBA, Training & Services
On 26 October 2016 at 11:34, Thomas Munro <thomas.munro@enterprisedb.com> wrote:

> It works by taking advantage of the { time, end-of-WAL } samples that
> sending servers already include in message headers to standbys.  That
> seems to provide a pretty good proxy for when the WAL was written, if
> you ignore messages where the LSN hasn't advanced.  The patch
> introduces a new GUC replay_lag_sample_interval, defaulting to 1s, to
> control how often the standby should record these timestamped LSNs
> into a small circular buffer.  When its recovery process eventually
> replays a timestamped LSN, the timestamp is sent back to the upstream
> server in a new reply message field.  The value visible in
> pg_stat_replication.replay_lag can then be updated by comparing with
> the current time.

Why not just send back the lag as calculated by max_standby_streaming_delay?
I.e. at the end of replay of each chunk record the current delay in
shmem, then send it back periodically.

If we have two methods of calculation it would be confusing.

Admittedly the approach here is the same one I advocated a some years
back when Robert and I were discussing time delayed standbys.

> Compared to the usual techniques people use to estimate replay lag,
> this approach has the following advantages:
>
> 1.  The lag is measured in time, not LSN difference.
> 2.  The lag time is computed using two observations of a single
> server's clock, so there is no clock skew.
> 3.  The lag is updated even between commits (during large data loads etc).

Yes, good reasons.

> In the previous version I was effectively showing the ping time
> between the servers during idle times when the standby was fully
> caught up because there was nothing happening.  I decided that was not
> useful information and that it's more newsworthy and interesting to
> see the estimated replay lag for the most recent real replayed
> activity, so I changed that.
>
> In the last thread[1], Robert Haas wrote:
>> Well, one problem with this is that you can't put a loop inside of a
>> spinlock-protected critical section.
>
> Fixed.
>
>> In general, I think this is a pretty reasonable way of attacking this
>> problem, but I'd say it's significantly under-commented.  Where should
>> someone go to get a general overview of this mechanism?  The answer is
>> not "at place XXX within the patch".  (I think it might merit some
>> more extensive documentation, too, although I'm not exactly sure what
>> that should look like.)
>
> I have added lots of comments.
>
>> When you overflow the buffer, you could thin in out in a smarter way,
>> like by throwing away every other entry instead of the oldest one.  I
>> guess you'd need to be careful how you coded that, though, because
>> replaying an entry with a timestamp invalidates some of the saved
>> entries without formally throwing them out.
>
> Done, by overwriting the newest sample rather than the oldest if the
> buffer is full.  That seems to give pretty reasonable degradation,
> effectively lowering the sampling rate, without any complicated buffer
> or rate management code.
>
>> Conceivably, 0002 could be split into two patches, one of which
>> computes "stupid replay lag" considering only records that naturally
>> carry timestamps, and a second adding the circular buffer to handle
>> the case where much time passes without finding such a record.
>
> I contemplated this but decided that it'd be best to use ONLY samples
> from walsender headers, and never use the time stamps from commit
> records for this.  If we use times from commit records, then a
> cascading sending server will not be able to compute the difference in
> time without introducing clock skew (not to mention the difficulty of
> combining timestamps from two sources if we try to do both).  I
> figured that it's better to have value that shows a cascading
> sender->standby->cascading sender round trip time that is free of
> clock skew, than a master->cascading sender->standby->cascading sender
> incomplete round trip that includes clock skew.
>
> By the same reasoning I decided against introducing a new periodic WAL
> record or field from the master to hold extra time stamps in between
> commits to do this, in favour of the buffered transient timestamp
> approach I took in this patch.  That said, I can see there are
> arguments for doing it with extra periodic WAL timestamps, if people
> don't think it'd be too invasive to mess with the WAL for this, and
> don't care about cascading standbys giving skewed readings.  One
> advantage would be that persistent WAL timestamps would still be able
> to provide lag estimates if a standby has been down for a while and
> was catching up, and this approach can't until it's caught up due to
> lack of buffered transient timestamps.  Thoughts?

-1 for adding anything to the WAL for this.

--
Simon Riggs                http://www.2ndQuadrant.com/
PostgreSQL Development, 24x7 Support, Remote DBA, Training & Services
On Mon, Dec 19, 2016 at 4:03 PM, Peter Eisentraut
<peter.eisentraut@2ndquadrant.com> wrote:
> On 11/22/16 4:27 AM, Thomas Munro wrote:
>> Thanks very much for testing!  New version attached.  I will add this
>> to the next CF.
>
> I don't see it there yet.

Thanks for the reminder.  Added here:  https://commitfest.postgresql.org/12/920/

Here's a rebased patch.

--
Thomas Munro
http://www.enterprisedb.com

--
Sent via pgsql-hackers mailing list (pgsql-hackers@postgresql.org)
To make changes to your subscription:
http://www.postgresql.org/mailpref/pgsql-hackers
Attachment
On Mon, Dec 19, 2016 at 10:46 PM, Simon Riggs <simon@2ndquadrant.com> wrote:
> On 26 October 2016 at 11:34, Thomas Munro <thomas.munro@enterprisedb.com> wrote:
>
>> It works by taking advantage of the { time, end-of-WAL } samples that
>> sending servers already include in message headers to standbys.  That
>> seems to provide a pretty good proxy for when the WAL was written, if
>> you ignore messages where the LSN hasn't advanced.  The patch
>> introduces a new GUC replay_lag_sample_interval, defaulting to 1s, to
>> control how often the standby should record these timestamped LSNs
>> into a small circular buffer.  When its recovery process eventually
>> replays a timestamped LSN, the timestamp is sent back to the upstream
>> server in a new reply message field.  The value visible in
>> pg_stat_replication.replay_lag can then be updated by comparing with
>> the current time.
>
> Why not just send back the lag as calculated by max_standby_streaming_delay?
> I.e. at the end of replay of each chunk record the current delay in
> shmem, then send it back periodically.
>
> If we have two methods of calculation it would be confusing.

Hmm.  If I understand correctly, GetStandbyLimitTime is measuring
something a bit different: it computes how long it has been since the
recovery process received the chunk that it's currently trying to
apply, most interestingly in the case where we are waiting due to
conflicts.  It doesn't include time in walsender, on the network, in
walreceiver, or writing and flushing and reading before it arrives in
the recovery process.  If I'm reading it correctly, it only updates
XLogReceiptTime when it's completely caught up applying all earlier
chunks, so when it falls behind, its measure of lag has a growing-only
phase and a reset that can only be triggered by catching up to the
latest chunk.  That seems OK for its intended purpose of putting a cap
on the delay introduced by conflicts.  But that's not what I'm trying
to provide here.

The purpose of this proposal is to show the replay_lag as judged by
the sending server: in the case of a primary server, that is an
indication of how commits done here will take to show up to users over
there, and how long COMMIT will take with remote_apply will take to
come back.  It measures the WAL's whole journey, and does so in a
smooth way that shows accurate information even if the standby never
quite catches up during long periods.

Example 1:  Suppose I have two servers right next each other, and the
primary server has periods of high activity which exceed the standby's
replay rate, perhaps because of slower/busier hardware, or because of
conflicts with other queries, or because our single-core 'REDO' can't
always keep up with multi-core 'DO'.  By the logic of
max_standby_streaming_delay, if it never catches up to the latest
chunk but remains a fluctuating number of chunks behind, then AIUI the
standby will compute a constantly increasing lag.  By my logic, the
primary will tell you quite accurately how far behind the standby's
recovery is at regular intervals, showing replay_lag fluctuating up
and down as appropriate, even if it never quite catches up.  It can do
that because it has a buffer full of regularly spaced out samples to
work through, and even if you exceed the buffer size (8192 seconds'
worth by default) it'll just increase the interval between samples.

Example 2:  Suppose I have servers on opposite sides of the world with
a ping time of 300ms.  By the logic used for
max_standby_streaming_delay, the lag computed by the standby would be
close to zero when there is no concurrent activity to conflict with.
I don't think that's what users other than the recovery-conflict
resolution code want to know.  By my logic, replay_lag computed by the
primary would show 300ms + a tiny bit more, which is how long it takes
for committed transactions to be visible to user queries on the
standby and for us to know that that is the case.  That's interesting
because it tells you how long synchronous_commit = remote_apply would
make you wait (if that server is waited for according to syncrep
config).

In summary, the max_standby_streaming_delay approach only measures
activity inside the recovery process on the standby, and only uses a
single variable for timestamp tracking, so although it's semi-related
it's not what I wanted to show.

(I suppose there might be an argument that max_standby_streaming_delay
should also track received-on-standby-time for each sampled LSN in a
circular buffer, and then use that information to implement
max_standby_streaming_delay more fairly.  We only need to cancel
queries that conflict with WAL records that have truly been waiting
max_standby_streaming_delay since receive time, instead of cancelling
everything that conflicts with recovery until we're caught up to the
last chunk as we do today as soon as max_standby_streaming_delay is
exceeded while trying to apply *any* WAL record.  This may not make
any sense or be worth doing, just an idea...)

> Admittedly the approach here is the same one I advocated a some years
> back when Robert and I were discussing time delayed standbys.

That is reassuring!

--
Thomas Munro
http://www.enterprisedb.com
On Mon, Dec 19, 2016 at 8:13 PM, Thomas Munro
<thomas.munro@enterprisedb.com> wrote:
> On Mon, Dec 19, 2016 at 4:03 PM, Peter Eisentraut
> <peter.eisentraut@2ndquadrant.com> wrote:
>> On 11/22/16 4:27 AM, Thomas Munro wrote:
>>> Thanks very much for testing!  New version attached.  I will add this
>>> to the next CF.
>>
>> I don't see it there yet.
>
> Thanks for the reminder.  Added here:  https://commitfest.postgresql.org/12/920/
>
> Here's a rebased patch.

I agree that the capability to measure the remote_apply lag is very useful.
Also I want to measure the remote_write and remote_flush lags, for example,
in order to diagnose the cause of replication lag.

For that, what about maintaining the pairs of send-timestamp and LSN in
*sender side* instead of receiver side? That is, walsender adds the pairs
of send-timestamp and LSN into the buffer every sampling period.
Whenever walsender receives the write, flush and apply locations from
walreceiver, it calculates the write, flush and apply lags by comparing
the received and stored LSN and comparing the current timestamp and
stored send-timestamp.

As a bonus of this approach, we don't need to add the field into the replay
message that walreceiver can very frequently send back. Which might be
helpful in terms of networking overhead.

Regards,

--
Fujii Masao
On Thu, Dec 22, 2016 at 2:14 AM, Fujii Masao <masao.fujii@gmail.com> wrote:
> I agree that the capability to measure the remote_apply lag is very useful.
> Also I want to measure the remote_write and remote_flush lags, for example,
> in order to diagnose the cause of replication lag.

Good idea.  I will think about how to make that work.  There was a
proposal to make writing and flushing independent[1].  I'd like that
to go in.  Then the write_lag and flush_lag could diverge
significantly, and it would be nice to be able to see that effect as
time (though you could already see it with LSN positions).

> For that, what about maintaining the pairs of send-timestamp and LSN in
> *sender side* instead of receiver side? That is, walsender adds the pairs
> of send-timestamp and LSN into the buffer every sampling period.
> Whenever walsender receives the write, flush and apply locations from
> walreceiver, it calculates the write, flush and apply lags by comparing
> the received and stored LSN and comparing the current timestamp and
> stored send-timestamp.

I thought about that too, but I couldn't figure out how to make the
sampling work.  If the primary is choosing (LSN, time) pairs to store
in a buffer, and the standby is sending replies at times of its
choosing (when wal_receiver_status_interval has been exceeded), then
you can't accurately measure anything.

You could fix that by making the standby send a reply *every time* it
applies some WAL (like it does for transactions committing with
synchronous_commit = remote_apply, though that is only for commit
records), but then we'd be generating a lot of recovery->walreceiver
communication and standby->primary network traffic, even for people
who don't otherwise need it.  It seems unacceptable.

Or you could fix that by setting the XACT_COMPLETION_APPLY_FEEDBACK
bit in the xl_xinfo.xinfo for selected transactions, as a way to ask
the standby to send a reply when that commit record is applied, but
that only works for commit records.  One of my goals was to be able to
report lag accurately even between commits (very large data load
transactions etc).

Or you could fix that by sending a list of 'interesting LSNs' to the
standby, as a way to ask it to send a reply when those LSNs are
applied.  Then you'd need a circular buffer of (LSN, time) pairs in
the primary AND a circular buffer of LSNs in the standby to remember
which locations should generate a reply.  This doesn't seem to be an
improvement.

That's why I thought that the standby should have the (LSN, time)
buffer: it decides which samples to record in its buffer, using LSN
and time provided by the sending server, and then it can send replies
at exactly the right times.  The LSNs don't have to be commit records,
they're just arbitrary points in the WAL stream which we attach
timestamps to.  IPC and network overhead is minimised, and accuracy is
maximised.

> As a bonus of this approach, we don't need to add the field into the replay
> message that walreceiver can very frequently send back. Which might be
> helpful in terms of networking overhead.

For the record, these replies are only sent approximately every
replay_lag_sample_interval (with variation depending on replay speed)
and are only 42 bytes with the new field added.

[1] https://www.postgresql.org/message-id/CA%2BU5nMJifauXvVbx%3Dv3UbYbHO3Jw2rdT4haL6CCooEDM5%3D4ASQ%40mail.gmail.com

--
Thomas Munro
http://www.enterprisedb.com
On Thu, Dec 22, 2016 at 10:14 AM, Thomas Munro
<thomas.munro@enterprisedb.com> wrote:
> On Thu, Dec 22, 2016 at 2:14 AM, Fujii Masao <masao.fujii@gmail.com> wrote:
>> I agree that the capability to measure the remote_apply lag is very useful.
>> Also I want to measure the remote_write and remote_flush lags, for example,
>> in order to diagnose the cause of replication lag.
>
> Good idea.  I will think about how to make that work.

Here is an experimental version that reports the write, flush and
apply lag separately as requested.  This is done with three separate
(lsn, timestamp) buffers on the standby side.  The GUC is now called
replication_lag_sample_interval.  Not tested much yet.

postgres=# select application_name, write_lag, flush_lag, replay_lag
from pg_stat_replication ;
 application_name |    write_lag    |    flush_lag    |   replay_lag
------------------+-----------------+-----------------+-----------------
 replica1         | 00:00:00.032408 | 00:00:00.032409 | 00:00:00.697858
 replica2         | 00:00:00.032579 | 00:00:00.03258  | 00:00:00.551125
 replica3         | 00:00:00.033686 | 00:00:00.033687 | 00:00:00.670571
 replica4         | 00:00:00.032861 | 00:00:00.032862 | 00:00:00.521902
(4 rows)

--
Thomas Munro
http://www.enterprisedb.com

--
Sent via pgsql-hackers mailing list (pgsql-hackers@postgresql.org)
To make changes to your subscription:
http://www.postgresql.org/mailpref/pgsql-hackers
Attachment
On Thu, Dec 29, 2016 at 1:28 AM, Thomas Munro
<thomas.munro@enterprisedb.com> wrote:
> On Thu, Dec 22, 2016 at 10:14 AM, Thomas Munro
> <thomas.munro@enterprisedb.com> wrote:
>> On Thu, Dec 22, 2016 at 2:14 AM, Fujii Masao <masao.fujii@gmail.com> wrote:
>>> I agree that the capability to measure the remote_apply lag is very useful.
>>> Also I want to measure the remote_write and remote_flush lags, for example,
>>> in order to diagnose the cause of replication lag.
>>
>> Good idea.  I will think about how to make that work.
>
> Here is an experimental version that reports the write, flush and
> apply lag separately as requested.  This is done with three separate
> (lsn, timestamp) buffers on the standby side.  The GUC is now called
> replication_lag_sample_interval.  Not tested much yet.

Here is a new version that is slightly refactored and fixes a problem
with stale samples after periods of idleness.

--
Thomas Munro
http://www.enterprisedb.com

--
Sent via pgsql-hackers mailing list (pgsql-hackers@postgresql.org)
To make changes to your subscription:
http://www.postgresql.org/mailpref/pgsql-hackers
Attachment
On 21 December 2016 at 21:14, Thomas Munro
<thomas.munro@enterprisedb.com> wrote:
> On Thu, Dec 22, 2016 at 2:14 AM, Fujii Masao <masao.fujii@gmail.com> wrote:
>> I agree that the capability to measure the remote_apply lag is very useful.
>> Also I want to measure the remote_write and remote_flush lags, for example,
>> in order to diagnose the cause of replication lag.
>
> Good idea.  I will think about how to make that work.  There was a
> proposal to make writing and flushing independent[1].  I'd like that
> to go in.  Then the write_lag and flush_lag could diverge
> significantly, and it would be nice to be able to see that effect as
> time (though you could already see it with LSN positions).

I think it has a much better chance now that the replies from apply
are OK. Will check in this release, but not now.

>> For that, what about maintaining the pairs of send-timestamp and LSN in
>> *sender side* instead of receiver side? That is, walsender adds the pairs
>> of send-timestamp and LSN into the buffer every sampling period.
>> Whenever walsender receives the write, flush and apply locations from
>> walreceiver, it calculates the write, flush and apply lags by comparing
>> the received and stored LSN and comparing the current timestamp and
>> stored send-timestamp.
>
> I thought about that too, but I couldn't figure out how to make the
> sampling work.  If the primary is choosing (LSN, time) pairs to store
> in a buffer, and the standby is sending replies at times of its
> choosing (when wal_receiver_status_interval has been exceeded), then
> you can't accurately measure anything.

Skipping adding the line delay to this was very specifically excluded
by Tom, so that clock disparity between servers is not included.

If the balance of opinion is in favour of including a measure of
complete roundtrip time then I'm OK with that.

> You could fix that by making the standby send a reply *every time* it
> applies some WAL (like it does for transactions committing with
> synchronous_commit = remote_apply, though that is only for commit
> records), but then we'd be generating a lot of recovery->walreceiver
> communication and standby->primary network traffic, even for people
> who don't otherwise need it.  It seems unacceptable.

I don't see why that would be unacceptable. If we do it for
remote_apply, why not also do it for other modes? Whatever the
reasoning was for remote_apply should work for other modes. I should
add it was originally designed to be that way by me, so must have been
changed later.

This seems like a bug to me now that I look harder. The docs for
wal_receiver_status_interval say  "Updates are sent each time the
write or flush positions change, or at least as often as specified by
this parameter." But it doesn't do that, as I think it should.

> Or you could fix that by setting the XACT_COMPLETION_APPLY_FEEDBACK
> bit in the xl_xinfo.xinfo for selected transactions, as a way to ask
> the standby to send a reply when that commit record is applied, but
> that only works for commit records.  One of my goals was to be able to
> report lag accurately even between commits (very large data load
> transactions etc).

As we said, we do have keepalive records we could use for that.

> Or you could fix that by sending a list of 'interesting LSNs' to the
> standby, as a way to ask it to send a reply when those LSNs are
> applied.  Then you'd need a circular buffer of (LSN, time) pairs in
> the primary AND a circular buffer of LSNs in the standby to remember
> which locations should generate a reply.  This doesn't seem to be an
> improvement.
>
> That's why I thought that the standby should have the (LSN, time)
> buffer: it decides which samples to record in its buffer, using LSN
> and time provided by the sending server, and then it can send replies
> at exactly the right times.  The LSNs don't have to be commit records,
> they're just arbitrary points in the WAL stream which we attach
> timestamps to.  IPC and network overhead is minimised, and accuracy is
> maximised.

I'm dubious of keeping standby-side state, but I will review the patch.

>> As a bonus of this approach, we don't need to add the field into the replay
>> message that walreceiver can very frequently send back. Which might be
>> helpful in terms of networking overhead.
>
> For the record, these replies are only sent approximately every
> replay_lag_sample_interval (with variation depending on replay speed)
> and are only 42 bytes with the new field added.
>
> [1] https://www.postgresql.org/message-id/CA%2BU5nMJifauXvVbx%3Dv3UbYbHO3Jw2rdT4haL6CCooEDM5%3D4ASQ%40mail.gmail.com

We have time to make any changes to allow this to be applied in this release.

--
Simon Riggs                http://www.2ndQuadrant.com/
PostgreSQL Development, 24x7 Support, Remote DBA, Training & Services
On Wed, Jan 4, 2017 at 1:06 AM, Simon Riggs <simon@2ndquadrant.com> wrote:
> On 21 December 2016 at 21:14, Thomas Munro
> <thomas.munro@enterprisedb.com> wrote:
>> I thought about that too, but I couldn't figure out how to make the
>> sampling work.  If the primary is choosing (LSN, time) pairs to store
>> in a buffer, and the standby is sending replies at times of its
>> choosing (when wal_receiver_status_interval has been exceeded), then
>> you can't accurately measure anything.
>
> Skipping adding the line delay to this was very specifically excluded
> by Tom, so that clock disparity between servers is not included.
>
> If the balance of opinion is in favour of including a measure of
> complete roundtrip time then I'm OK with that.

I deliberately included the network round trip for two reasons:

1.  The three lag numbers tell you how long syncrep would take to
return control at the three levels remote_write, on, remote_apply.
2.  The time arithmetic is all done on the primary side using two
observations of its single system clock, avoiding any discussion of
clock differences between servers.

You can always subtract half the ping time from these numbers later if
you really want to (replay_lag - (write_lag / 2) may be a cheap proxy
for a lag time that doesn't include the return network leg, and still
doesn't introduce clock difference error).  I am strongly of the
opinion that time measurements made by a single observer are better
data to start from.

>> You could fix that by making the standby send a reply *every time* it
>> applies some WAL (like it does for transactions committing with
>> synchronous_commit = remote_apply, though that is only for commit
>> records), but then we'd be generating a lot of recovery->walreceiver
>> communication and standby->primary network traffic, even for people
>> who don't otherwise need it.  It seems unacceptable.
>
> I don't see why that would be unacceptable. If we do it for
> remote_apply, why not also do it for other modes? Whatever the
> reasoning was for remote_apply should work for other modes. I should
> add it was originally designed to be that way by me, so must have been
> changed later.

You can achieve that with this patch by setting
replication_lag_sample_interval to 0.

The patch streams (time-right-now, end-of-wal) to the standby in every
outgoing message, and then sees how long it takes for those timestamps
to be fed back to it.  The standby feeds them back immediately as soon
as it writes, flushes and applies those WAL positions.  I figured it
would be silly if  every message from the primary caused the standby
to generate 3 replies from the standby just for a monitoring feature,
so I introduced the GUC replication_lag_sample_interval to rate-limit
that.  I don't think there's much point in setting it lower than 1s:
how often will you look at pg_stat_replication?

>> That's why I thought that the standby should have the (LSN, time)
>> buffer: it decides which samples to record in its buffer, using LSN
>> and time provided by the sending server, and then it can send replies
>> at exactly the right times.  The LSNs don't have to be commit records,
>> they're just arbitrary points in the WAL stream which we attach
>> timestamps to.  IPC and network overhead is minimised, and accuracy is
>> maximised.
>
> I'm dubious of keeping standby-side state, but I will review the patch.

Thanks!

The only standby-side state is the three buffers of (LSN, time) that
haven't been written/flushed/applied yet.  I don't see how that can be
avoided, except by inserting extra periodic timestamps into the WAL
itself, which has already been rejected.

--
Thomas Munro
http://www.enterprisedb.com
On Wed, Jan 4, 2017 at 12:22 PM, Thomas Munro
<thomas.munro@enterprisedb.com> wrote:
> The patch streams (time-right-now, end-of-wal) to the standby in every
> outgoing message, and then sees how long it takes for those timestamps
> to be fed back to it.

Correction: we already stream (time-right-now, end-of-wal) to the
standby in every outgoing message.  The patch introduces a new use of
that information by feeding them back upstream.

--
Thomas Munro
http://www.enterprisedb.com
On Wed, Jan 4, 2017 at 12:22 PM, Thomas Munro
<thomas.munro@enterprisedb.com> wrote:
> (replay_lag - (write_lag / 2) may be a cheap proxy
> for a lag time that doesn't include the return network leg, and still
> doesn't introduce clock difference error)

(Upon reflection it's a terrible proxy for that because of the mix of
write/flush work done by WAL receiver today, but would improve
dramatically if the WAL writer were doing the flushing.  A better yet
proxy might involve also tracking receive_lag which doesn't include
the write() syscall.  My real point is that there are ways to work
backwards from the two-way round trip time to get other estimates, but
no good ways to undo the damage that would be done to the data if we
started using two systems' clocks.)

--
Thomas Munro
http://www.enterprisedb.com
On 3 January 2017 at 23:22, Thomas Munro <thomas.munro@enterprisedb.com> wrote:

>> I don't see why that would be unacceptable. If we do it for
>> remote_apply, why not also do it for other modes? Whatever the
>> reasoning was for remote_apply should work for other modes. I should
>> add it was originally designed to be that way by me, so must have been
>> changed later.
>
> You can achieve that with this patch by setting
> replication_lag_sample_interval to 0.

I wonder why you ignore my mention of the bug in the correct mechanism?

--
Simon Riggs                http://www.2ndQuadrant.com/
PostgreSQL Development, 24x7 Support, Remote DBA, Training & Services
On Wed, Jan 4, 2017 at 8:58 PM, Simon Riggs <simon@2ndquadrant.com> wrote:
> On 3 January 2017 at 23:22, Thomas Munro <thomas.munro@enterprisedb.com> wrote:
>
>>> I don't see why that would be unacceptable. If we do it for
>>> remote_apply, why not also do it for other modes? Whatever the
>>> reasoning was for remote_apply should work for other modes. I should
>>> add it was originally designed to be that way by me, so must have been
>>> changed later.
>>
>> You can achieve that with this patch by setting
>> replication_lag_sample_interval to 0.
>
> I wonder why you ignore my mention of the bug in the correct mechanism?

I didn't have an opinion on that yet, but looking now I think there is
no bug:  I was wrong about the current reply frequency.  This comment
above XLogWalRcvSendReply confused me:
* If 'force' is not set, the message is only sent if enough time has* passed since last status update to reach
wal_receiver_status_interval.

Actually it's sent if 'force' is set, enough time has passed, or
either of the write or flush positions has moved.  So we're already
sending replies after every write and flush, as you said we should.

So perhaps I should get rid of that replication_lag_sample_interval
GUC and send back apply timestamps frequently, as you were saying.  It
would add up to a third more replies.

The effective sample rate would still be lowered when the fixed sized
buffers fill up and samples have to be dropped, and that'd be more
likely without that GUC. With the GUC, it doesn't start happening
until lag reaches XLOG_TIMESTAMP_BUFFER_SIZE *
replication_lag_sample_interval = ~2 hours with defaults, whereas
without rate limiting you might only need to get
XLOG_TIMESTAMP_BUFFER_SIZE 'w' messages behind before we start
dropping samples.  Maybe that's perfectly OK, I'm not sure.

--
Thomas Munro
http://www.enterprisedb.com
On Thu, Jan 5, 2017 at 12:03 AM, Thomas Munro
<thomas.munro@enterprisedb.com> wrote:
> So perhaps I should get rid of that replication_lag_sample_interval
> GUC and send back apply timestamps frequently, as you were saying.  It
> would add up to a third more replies.

Oops, of course I meant to say up to 50% more replies...

--
Thomas Munro
http://www.enterprisedb.com
On Thu, Dec 22, 2016 at 6:14 AM, Thomas Munro
<thomas.munro@enterprisedb.com> wrote:
> On Thu, Dec 22, 2016 at 2:14 AM, Fujii Masao <masao.fujii@gmail.com> wrote:
>> I agree that the capability to measure the remote_apply lag is very useful.
>> Also I want to measure the remote_write and remote_flush lags, for example,
>> in order to diagnose the cause of replication lag.
>
> Good idea.  I will think about how to make that work.  There was a
> proposal to make writing and flushing independent[1].  I'd like that
> to go in.  Then the write_lag and flush_lag could diverge
> significantly, and it would be nice to be able to see that effect as
> time (though you could already see it with LSN positions).
>
>> For that, what about maintaining the pairs of send-timestamp and LSN in
>> *sender side* instead of receiver side? That is, walsender adds the pairs
>> of send-timestamp and LSN into the buffer every sampling period.
>> Whenever walsender receives the write, flush and apply locations from
>> walreceiver, it calculates the write, flush and apply lags by comparing
>> the received and stored LSN and comparing the current timestamp and
>> stored send-timestamp.
>
> I thought about that too, but I couldn't figure out how to make the
> sampling work.  If the primary is choosing (LSN, time) pairs to store
> in a buffer, and the standby is sending replies at times of its
> choosing (when wal_receiver_status_interval has been exceeded), then
> you can't accurately measure anything.

Yeah, even though the primary stores (100, 2017-01-17 00:00:00) as the pair of
(LSN, timestamp), for example, the standby may not send back the reply for
LSN 100 itself. The primary may receive the reply for larger LSN like 200,
instead. So the measurement of the lag in the primary side would not be so
accurate.

But we can calculate the "sync rep" lag by comparing the stored timestamp of
LSN 100 and the timestamp when the reply for LSN 200 is received. In sync rep,
since the transaction waiting for LSN 100 to be replicated is actually released
after the reply for LSN 200 is received, the above calculated lag is basically
accurate as sync rep lag.

Therefore I'm still thinking that it's better to maintain the pairs of LSN
and timestamp in the *primary* side. Thought?

Regards,

--
Fujii Masao
On Tue, Jan 17, 2017 at 7:45 PM, Fujii Masao <masao.fujii@gmail.com> wrote:
> On Thu, Dec 22, 2016 at 6:14 AM, Thomas Munro
> <thomas.munro@enterprisedb.com> wrote:
>> On Thu, Dec 22, 2016 at 2:14 AM, Fujii Masao <masao.fujii@gmail.com> wrote:
>>> I agree that the capability to measure the remote_apply lag is very useful.
>>> Also I want to measure the remote_write and remote_flush lags, for example,
>>> in order to diagnose the cause of replication lag.
>>
>> Good idea.  I will think about how to make that work.  There was a
>> proposal to make writing and flushing independent[1].  I'd like that
>> to go in.  Then the write_lag and flush_lag could diverge
>> significantly, and it would be nice to be able to see that effect as
>> time (though you could already see it with LSN positions).
>>
>>> For that, what about maintaining the pairs of send-timestamp and LSN in
>>> *sender side* instead of receiver side? That is, walsender adds the pairs
>>> of send-timestamp and LSN into the buffer every sampling period.
>>> Whenever walsender receives the write, flush and apply locations from
>>> walreceiver, it calculates the write, flush and apply lags by comparing
>>> the received and stored LSN and comparing the current timestamp and
>>> stored send-timestamp.
>>
>> I thought about that too, but I couldn't figure out how to make the
>> sampling work.  If the primary is choosing (LSN, time) pairs to store
>> in a buffer, and the standby is sending replies at times of its
>> choosing (when wal_receiver_status_interval has been exceeded), then
>> you can't accurately measure anything.
>
> Yeah, even though the primary stores (100, 2017-01-17 00:00:00) as the pair of
> (LSN, timestamp), for example, the standby may not send back the reply for
> LSN 100 itself. The primary may receive the reply for larger LSN like 200,
> instead. So the measurement of the lag in the primary side would not be so
> accurate.
>
> But we can calculate the "sync rep" lag by comparing the stored timestamp of
> LSN 100 and the timestamp when the reply for LSN 200 is received. In sync rep,
> since the transaction waiting for LSN 100 to be replicated is actually released
> after the reply for LSN 200 is received, the above calculated lag is basically
> accurate as sync rep lag.
>
> Therefore I'm still thinking that it's better to maintain the pairs of LSN
> and timestamp in the *primary* side. Thought?

Ok.  I see that there is a new compelling reason to move the ring
buffer to the sender side: then I think lag tracking will work
automatically for the new logical replication that just landed on
master.  I will try it that way.  Thanks for the feedback!

--
Thomas Munro
http://www.enterprisedb.com
On Sat, Jan 21, 2017 at 10:49 AM, Thomas Munro
<thomas.munro@enterprisedb.com> wrote:
> Ok.  I see that there is a new compelling reason to move the ring
> buffer to the sender side: then I think lag tracking will work
> automatically for the new logical replication that just landed on
> master.  I will try it that way.  Thanks for the feedback!

Seeing no new patches, marked as returned with feedback. Feel free of
course to refresh the CF entry once you have a new patch!
--
Michael
On Wed, Feb 1, 2017 at 5:21 PM, Michael Paquier
<michael.paquier@gmail.com> wrote:
> On Sat, Jan 21, 2017 at 10:49 AM, Thomas Munro
> <thomas.munro@enterprisedb.com> wrote:
>> Ok.  I see that there is a new compelling reason to move the ring
>> buffer to the sender side: then I think lag tracking will work
>> automatically for the new logical replication that just landed on
>> master.  I will try it that way.  Thanks for the feedback!
>
> Seeing no new patches, marked as returned with feedback. Feel free of
> course to refresh the CF entry once you have a new patch!

Here is a new version with the buffer on the sender side as requested.
Since it now shows write, flush and replay lag, not just replay, I
decide to rename it and start counting versions at 1 again.
replication-lag-v1.patch is less than half the size of
replay-lag-v16.patch and considerably simpler.  There is no more GUC
and no more protocol change.

While the write and flush locations are sent back at the right times
already, I had to figure out how to get replies to be sent at the
right time when WAL was replayed too.  Without doing anything special
for that, you get the following cases:

1.  A busy system: replies flow regularly due to write and flush
feedback, and those replies include replay position, so there is no
problem.

2.  A system that has just streamed a lot of WAL causing the standby
to fall behind in replaying, but the primary is now idle:  there will
only be replies every 10 seconds (wal_receiver_status_interval), so
pg_stat_replication.replay_lag only updates with that frequency.
(That was already the case for replay_location).

3.  An idle system that has just replayed some WAL and is now fully
caught up.  There is no reply until the next
wal_receiver_status_interval; so now replay_lag shows a bogus number
over 10 seconds.  Oops.

Case 1 is good, and I suppose that 2 is OK, but I needed to do
something about 3.  The solution I came up with was to force one reply
to be sent whenever recovery runs out of WAL to replay and enters
WaitForWALToBecomeAvailable().  This seems to work pretty well in
initial testing.

Thoughts?

--
Thomas Munro
http://www.enterprisedb.com

--
Sent via pgsql-hackers mailing list (pgsql-hackers@postgresql.org)
To make changes to your subscription:
http://www.postgresql.org/mailpref/pgsql-hackers
Attachment
On 14 February 2017 at 11:48, Thomas Munro
<thomas.munro@enterprisedb.com> wrote:

> Here is a new version with the buffer on the sender side as requested.

Thanks, I will definitely review in good time to get this in PG10

--
Simon Riggs                http://www.2ndQuadrant.com/
PostgreSQL Development, 24x7 Support, Remote DBA, Training & Services
Hi Thomas.

At 2017-02-15 00:48:41 +1300, thomas.munro@enterprisedb.com wrote:
>
> Here is a new version with the buffer on the sender side as requested.

This looks good.

> +     <entry><structfield>write_lag</></entry>
> +     <entry><type>interval</></entry>
> +     <entry>Estimated time taken for recent WAL records to be written on this
> +      standby server</entry>

I think I would find a slightly more detailed explanation helpful here.

A few tiny nits:

> +     * If the lsn hasn't advanced since last time, then do nothing.  This way
> +     * we only record a new sample when new WAL has been written, which is
> +     * simple proxy for the time at which the log was written.

"which is simple" → "which is a simple"

> +     * If the buffer if full, for now we just rewind by one slot and overwrite
> +     * the last sample, as a simple if somewhat uneven way to lower the
> +     * sampling rate.  There may be better adaptive compaction algorithms.

"buffer if" → "buffer is"

> + * Find out how much time has elapsed since WAL position 'lsn' or earlier was
> + * written to the lag tracking buffer and 'now'.  Return -1 if no time is
> + * available, and otherwise the elapsed time in microseconds.

Find out how much time has elapsed "between X and 'now'", or "since X".
(I prefer the former, i.e., s/since/between/.)

-- Abhijit
On 14 February 2017 at 11:48, Thomas Munro
<thomas.munro@enterprisedb.com> wrote:
> On Wed, Feb 1, 2017 at 5:21 PM, Michael Paquier
> <michael.paquier@gmail.com> wrote:
>> On Sat, Jan 21, 2017 at 10:49 AM, Thomas Munro
>> <thomas.munro@enterprisedb.com> wrote:
>>> Ok.  I see that there is a new compelling reason to move the ring
>>> buffer to the sender side: then I think lag tracking will work
>>> automatically for the new logical replication that just landed on
>>> master.  I will try it that way.  Thanks for the feedback!
>>
>> Seeing no new patches, marked as returned with feedback. Feel free of
>> course to refresh the CF entry once you have a new patch!
>
> Here is a new version with the buffer on the sender side as requested.
> Since it now shows write, flush and replay lag, not just replay, I
> decide to rename it and start counting versions at 1 again.
> replication-lag-v1.patch is less than half the size of
> replay-lag-v16.patch and considerably simpler.  There is no more GUC
> and no more protocol change.
>
> While the write and flush locations are sent back at the right times
> already, I had to figure out how to get replies to be sent at the
> right time when WAL was replayed too.  Without doing anything special
> for that, you get the following cases:
>
> 1.  A busy system: replies flow regularly due to write and flush
> feedback, and those replies include replay position, so there is no
> problem.
>
> 2.  A system that has just streamed a lot of WAL causing the standby
> to fall behind in replaying, but the primary is now idle:  there will
> only be replies every 10 seconds (wal_receiver_status_interval), so
> pg_stat_replication.replay_lag only updates with that frequency.
> (That was already the case for replay_location).
>
> 3.  An idle system that has just replayed some WAL and is now fully
> caught up.  There is no reply until the next
> wal_receiver_status_interval; so now replay_lag shows a bogus number
> over 10 seconds.  Oops.
>
> Case 1 is good, and I suppose that 2 is OK, but I needed to do
> something about 3.  The solution I came up with was to force one reply
> to be sent whenever recovery runs out of WAL to replay and enters
> WaitForWALToBecomeAvailable().  This seems to work pretty well in
> initial testing.
>
> Thoughts?

Feeling happier about this for now at least.

I think we need to document how this works more in README or header
comments. That way I can review it against what it aims to do rather
than what I think it might do.

e.g. We need to document what replay_lag represents. Does it include
write_lag and flush_lag, or is it the time since the flush_lag. i.e.
do I add all 3 together to get the full lag, or would that cause me to
double count?

How sensitive is this? Does the lag spike quickly and then disappear
again quickly? If we're sampling this every N seconds, will we get a
realistic viewpoint or just a random sample? Should we smooth the
value, or present preak info?

--
Simon Riggs                http://www.2ndQuadrant.com/
PostgreSQL Development, 24x7 Support, Remote DBA, Training & Services
On Thu, Feb 16, 2017 at 11:18 PM, Abhijit Menon-Sen <ams@2ndquadrant.com> wrote:
> Hi Thomas.
>
> At 2017-02-15 00:48:41 +1300, thomas.munro@enterprisedb.com wrote:
>>
>> Here is a new version with the buffer on the sender side as requested.
>
> This looks good.

Thanks for the review!

>> +     <entry><structfield>write_lag</></entry>
>> +     <entry><type>interval</></entry>
>> +     <entry>Estimated time taken for recent WAL records to be written on this
>> +      standby server</entry>
>
> I think I would find a slightly more detailed explanation helpful here.

Fixed.

> A few tiny nits:
>
>> +      * If the lsn hasn't advanced since last time, then do nothing.  This way
>> +      * we only record a new sample when new WAL has been written, which is
>> +      * simple proxy for the time at which the log was written.
>
> "which is simple" → "which is a simple"

Fixed.

>> +      * If the buffer if full, for now we just rewind by one slot and overwrite
>> +      * the last sample, as a simple if somewhat uneven way to lower the
>> +      * sampling rate.  There may be better adaptive compaction algorithms.
>
> "buffer if" → "buffer is"

Fixed.

>> + * Find out how much time has elapsed since WAL position 'lsn' or earlier was
>> + * written to the lag tracking buffer and 'now'.  Return -1 if no time is
>> + * available, and otherwise the elapsed time in microseconds.
>
> Find out how much time has elapsed "between X and 'now'", or "since X".
> (I prefer the former, i.e., s/since/between/.)

Fixed.

I also added some more comments in response to Simon's request for
more explanation of how it works (but will reply to his email
separately).  Please find version 2 attached.

--
Thomas Munro
http://www.enterprisedb.com

--
Sent via pgsql-hackers mailing list (pgsql-hackers@postgresql.org)
To make changes to your subscription:
http://www.postgresql.org/mailpref/pgsql-hackers
Attachment
On Fri, Feb 17, 2017 at 12:45 AM, Simon Riggs <simon@2ndquadrant.com> wrote:
> Feeling happier about this for now at least.

Thanks!

> I think we need to document how this works more in README or header
> comments. That way I can review it against what it aims to do rather
> than what I think it might do.

I have added a bunch of new comments to explain in the -v2 patch (see
reply to Abhijit).  Please let me know if you think I need to add
still more.  I'm especially interested in your feedback on the block
of comments above the line:

+   LagTrackerWrite(SendRqstPtr, GetCurrentTimestamp());

Specifically, your feedback on the sufficiency of this (LSN, time)
pair + filtering out repeat LSNs as an approximation of the time this
LSN was flushed.

> e.g. We need to document what replay_lag represents. Does it include
> write_lag and flush_lag, or is it the time since the flush_lag. i.e.
> do I add all 3 together to get the full lag, or would that cause me to
> double count?

I have included full descriptions of exactly what the 3 times
represent in the user documentation in the -v2 patch.

> How sensitive is this? Does the lag spike quickly and then disappear
> again quickly? If we're sampling this every N seconds, will we get a
> realistic viewpoint or just a random sample?

In my testing it seems to move fairly smoothly so I think sampling
every N seconds would be quite effective and would not be 'noisy'.
The main time it jumps quickly is at the end of a large data load,
when a slow standby finally reaches the end of its backlog; you see it
climb slowly up and up while the faster primary is busy generating WAL
too fast for it to apply, but then if the primary goes idle the
standby eventually catches up.  The high lag number sometimes lingers
for a bit and then pops down to a low number when new WAL arrives that
can be applied quickly.  It seems like a very accurate depiction of
what is really happening so I like that.  I would love to hear other
opinions and feedback/testing experiences!

> Should we smooth the
> value, or present preak info?

Hmm.  Well, it might be interesting to do online exponential moving
averages, similar to the three numbers Unix systems present for load.
On the other hand, I'm amazed no one has complained that I'm making
pg_stat_replication ridiculously wide already, and users/monitoring
system could easy do that kind of thing themselves, and the number
doesn't seem to jumping/noisy/in-need-of-smoothing.  Same would go for
logging over time; seems like an external monitoring tool's bailiwick.

--
Thomas Munro
http://www.enterprisedb.com
On 17 February 2017 at 07:45, Thomas Munro
<thomas.munro@enterprisedb.com> wrote:
> On Fri, Feb 17, 2017 at 12:45 AM, Simon Riggs <simon@2ndquadrant.com> wrote:
>> Feeling happier about this for now at least.
>
> Thanks!

And happier again, leading me to move to the next stage of review,
focusing on the behaviour emerging from the design.

So my current understanding is that this doesn't rely upon LSN
arithmetic to measure lag, which is good. That means logical
replication should "just work" and future mechanisms to filter
physical WAL will also just work. This is important, so please comment
if you see that isn't the case.

I notice that LagTrackerRead() doesn't do anything to interpolate the
time given, so at present any attempt to prune the lag sample buffer
would result in falsely increasing the lag times reported. Which is
probably the reason why you say "There may be better adaptive
compaction algorithms."  We need to look at this some more, an initial
guess might be that we need to insert fewer samples as the buffer
fills since the LagTrackerRead() algorithm is O(N) on number of
samples and thus increasing the buffer itself isn't a great plan.

It would be very nice to be able to say something like that the +/-
confidence limits of the lag are no more than 50% of the lag time, so
we have some idea of how accurate the value is at any point. We need
to document the accuracy of the result, otherwise we'll be answering
questions on that for some time. So lets think about that now.

Given LagTrackerRead() is reading the 3 positions in order, it seems
sensible to start reading the LAG_TRACKER_FLUSH_HEAD from the place
you finished reading LAG_TRACKER_WRITE_HEAD etc.. Otherwise we end up
doing way too much work with larger buffers.

Which makes me think about the read more. The present design
calculates everything on receipt of standby messages. I think we
should simply record the last few messages and do the lag calculation
when the values are later read, if indeed they are ever read. That
would allow us a much better diagnostic view, at least. And it would
allow you to show a) latest value, b) smoothed in various ways, or c)
detail of last few messages for diagnostics. The latest value would be
the default value in pg_stat_replication - I agree we shouldn't make
that overly wide, so we'd need another function to access the details.

What is critical is that we report stable values as lag increases.
i.e. we need to iron out any usage cases so we don't have to fix them
in PG11 and spend a year telling people "yeh, it does that" (like
we've been doing for some time). So the diagnostics will help us
investigate this patch over various use cases...

I think what we need to show some test results with the graph of lag
over time for these cases:
1. steady state - pgbench on master, so we can see how that responds
2. blocked apply on standby - so we can see how the lag increases but
also how the accuracy goes down as the lag increases and whether the
reported value changes (depending upon algo)
3. burst mode - where we go from not moving to moving at high speed
and then stop again quickly
+other use cases you or others add

Does the proposed algo work for these cases? What goes wrong with it?
It's the examination of these downsides, if any, are the things we
need to investigate now to allow this to get committed.


Some minor points on code...
Why are things defined in walsender.c and not in .h?
Why is LAG_TRACKER_NUM_READ_HEADS not the same as NUM_SYNC_REP_WAIT_MODE?
...and other related constants shouldn't be redefined either.

--
Simon Riggs                http://www.2ndQuadrant.com/
PostgreSQL Development, 24x7 Support, Remote DBA, Training & Services
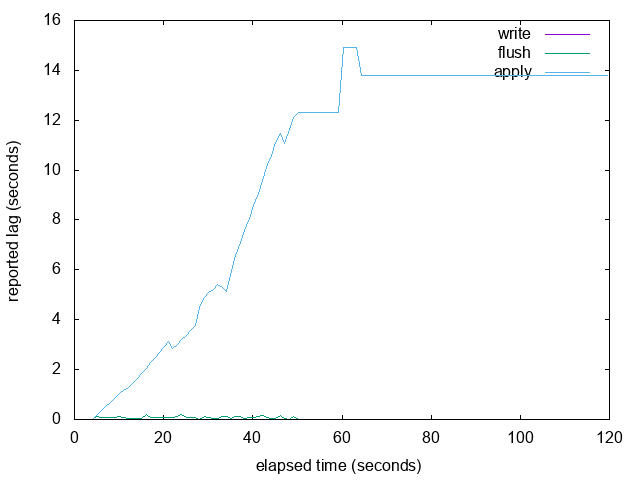
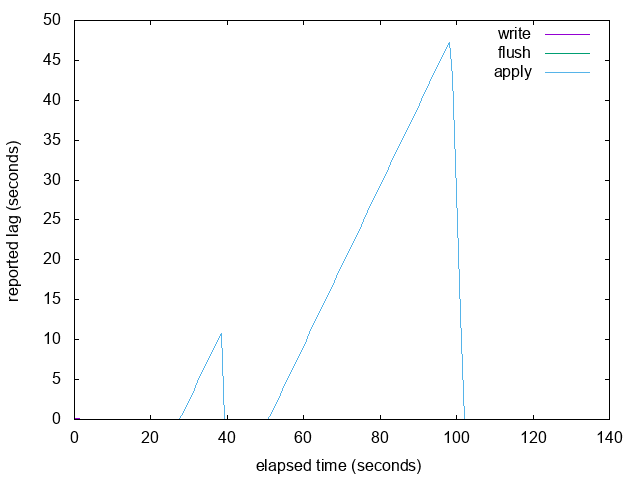
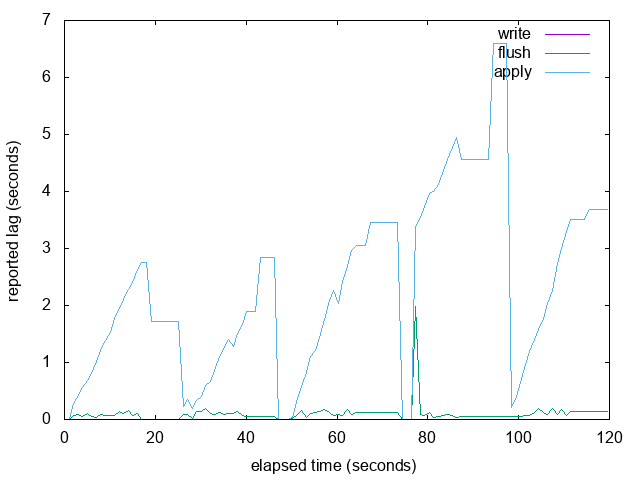
On Tue, Feb 21, 2017 at 6:21 PM, Simon Riggs <simon@2ndquadrant.com> wrote:
> And happier again, leading me to move to the next stage of review,
> focusing on the behaviour emerging from the design.
>
> So my current understanding is that this doesn't rely upon LSN
> arithmetic to measure lag, which is good. That means logical
> replication should "just work" and future mechanisms to filter
> physical WAL will also just work. This is important, so please comment
> if you see that isn't the case.

Yes, my understanding (based on
https://www.postgresql.org/message-id/f453caad-0396-1bdd-c5c1-5094371f4776@2ndquadrant.com
) is that this should in principal work for logical replication, it
just might show the same number in 2 or 3 of the lag columns because
of the way it reports LSNs.

However, I think a call like LagTrackerWrite(SendRqstPtr,
GetCurrentTimestamp()) needs to go into XLogSendLogical, to mirror
what happens in XLogSendPhysical.  I'm not sure about that.

> I notice that LagTrackerRead() doesn't do anything to interpolate the
> time given, so at present any attempt to prune the lag sample buffer
> would result in falsely increasing the lag times reported. Which is
> probably the reason why you say "There may be better adaptive
> compaction algorithms."  We need to look at this some more, an initial
> guess might be that we need to insert fewer samples as the buffer
> fills since the LagTrackerRead() algorithm is O(N) on number of
> samples and thus increasing the buffer itself isn't a great plan.

Interesting idea about interpolation.  The lack of it didn't "result
in falsely increasing the lag times reported", it resulted in reported
lag staying static for a period of time even though we were falling
further behind.  I finished up looking into fixing this with
interpolation.  See below.

About adaptive sampling:  This patch does in fact "insert fewer
samples once the buffer fills".  Normally, the sender records a sample
every time it sends a message.  Now imagine that the standby's
recovery is very slow and the buffer fills up.  The sender starts
repeatedly overwriting the same buffer element because the write head
has crashed into the slow moving read head.  Every time the standby
makes some progress and reports it, the read head finally advances
releasing some space, so the sender is able to advance to the next
element and record a new sample (and probably overwrite that one many
times).  So effectively we reduce our sampling rate for all new
samples.  We finish up with a sampling rate that is determined by the
rate of standby progress.  I expect you can make something a bit
smoother and more sophisticated that starts lowering the sampling rate
sooner and perhaps thins out the pre-existing samples when the buffer
fills up, and I'm open to ideas, but my intuition is that it would be
complicated and no one would even notice the difference.

LagTrackerRead() is O(N) not in the total number of samples, but in
the number of samples whose LSN is <= the LSN in the reply message
we're processing.  Given that the sender record samples as it sends
messages, and the standby sends replies on write/flush of those
messages, I think the N in question here will typically be a very
small number except in the case below called 'overwhelm.png' when the
WAL sender would be otherwise completely idle.

> It would be very nice to be able to say something like that the +/-
> confidence limits of the lag are no more than 50% of the lag time, so
> we have some idea of how accurate the value is at any point. We need
> to document the accuracy of the result, otherwise we'll be answering
> questions on that for some time. So lets think about that now.

The only source of inaccuracy I can think of right now is that if
XLogSendPhysical doesn't run very often, then we won't notice the
local flushed LSN moving until a bit later, and to the extent that
we're late noticing that, we could underestimate the lag numbers.  But
actually it runs very frequently and is woken whenever WAL is flushed.
This gap could be closed by recording the system time in shared memory
whenever local WAL is flushed; as described in a large comment in the
patch, I figured this wasn't worth that.

> Given LagTrackerRead() is reading the 3 positions in order, it seems
> sensible to start reading the LAG_TRACKER_FLUSH_HEAD from the place
> you finished reading LAG_TRACKER_WRITE_HEAD etc.. Otherwise we end up
> doing way too much work with larger buffers.

Hmm.  I was under the impression that we'd nearly always be eating a
very small number of samples with each reply message, since standbys
usually report progress frequently.  But yeah, if the buffer is full
AND the standby is sending very infrequent replies because the primary
is idle, then perhaps we could try to figure out how to skip ahead
faster than one at a time.

> Which makes me think about the read more. The present design
> calculates everything on receipt of standby messages. I think we
> should simply record the last few messages and do the lag calculation
> when the values are later read, if indeed they are ever read. That
> would allow us a much better diagnostic view, at least. And it would
> allow you to show a) latest value, b) smoothed in various ways, or c)
> detail of last few messages for diagnostics. The latest value would be
> the default value in pg_stat_replication - I agree we shouldn't make
> that overly wide, so we'd need another function to access the details.

I think you need to record at least the system clock time and advance
the read heads up to the reported LSNs when you receive a reply.  So
the amount of work you could defer to some later time would be almost
none; subtracting one time from another.

> What is critical is that we report stable values as lag increases.
> i.e. we need to iron out any usage cases so we don't have to fix them
> in PG11 and spend a year telling people "yeh, it does that" (like
> we've been doing for some time). So the diagnostics will help us
> investigate this patch over various use cases...

+1

> I think what we need to show some test results with the graph of lag
> over time for these cases:
> 1. steady state - pgbench on master, so we can see how that responds
> 2. blocked apply on standby - so we can see how the lag increases but
> also how the accuracy goes down as the lag increases and whether the
> reported value changes (depending upon algo)
> 3. burst mode - where we go from not moving to moving at high speed
> and then stop again quickly
> +other use cases you or others add

Good idea.  Here are some graphs.  This is from a primary/standby pair
running on my local development machine, so the times are low in the
good cases.  For 1 and 2 I used pgbench TPCB-sort-of.  For 3 I used a
loop that repeatedly dropped and created a huge table, sleeping in
between.

> Does the proposed algo work for these cases? What goes wrong with it?
> It's the examination of these downsides, if any, are the things we
> need to investigate now to allow this to get committed.

The main problem I discovered was with 2.  If replay is paused, then
the reported LSN completely stops advancing, so replay_lag plateaus.
When you resume replay, it starts reporting LSNs advancing again and
suddenly discovers and reports a huge lag because it advances past the
next sample in the buffer.

I realised that you had suggested the solution to this problem
already: interpolation.  I have added simple linear interpolation that
checks if there is a future LSN in the buffer, and if so it
interpolates linearly to synthesise the local flush time of the
reported LSN, which is somewhere between the last and next sample's
recorded local flush time.  This seems to work well for the
apply-totally-stopped case.

I added a fourth case 'overwhelm.png' which you might find
interesting.  It's essentially like one 'burst' followed by a 100% ide
primary.  The primary stops sending new WAL around 50 seconds in and
then there is no autovacuum, nothing happening at all.  The standby
start is still replaying its backlog of WAL, but is sending back
replies only every 10 seconds (because no WAL arriving so no other
reason to send replies except status message timeout, which could be
lowered).  So we see some big steps, and then we finally see it
flat-line around 60 seconds because there is still now new WAL so we
keep showing the last measured lag.  If new WAL is flushed it will pop
back to 0ish, but until then its last known measurement is ~14
seconds, which I don't think is technically wrong.

> Some minor points on code...
> Why are things defined in walsender.c and not in .h?

Because they are module-private.

> Why is LAG_TRACKER_NUM_READ_HEADS not the same as NUM_SYNC_REP_WAIT_MODE?
> ...and other related constants shouldn't be redefined either.

Hmm.  Ok, changed.

Please see new patch attached.

--
Thomas Munro
http://www.enterprisedb.com

--
Sent via pgsql-hackers mailing list (pgsql-hackers@postgresql.org)
To make changes to your subscription:
http://www.postgresql.org/mailpref/pgsql-hackers
Attachment
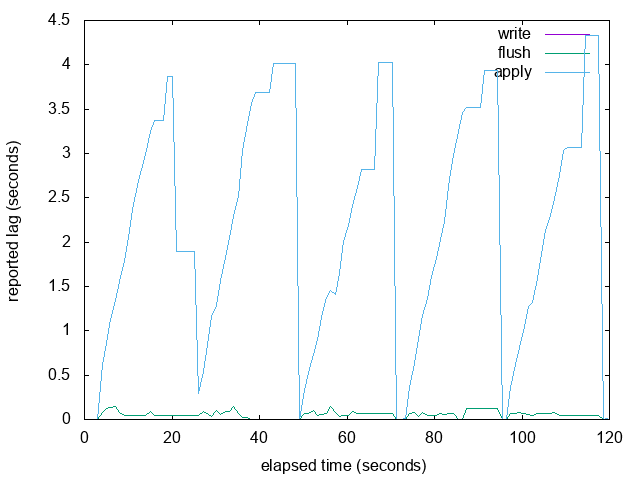
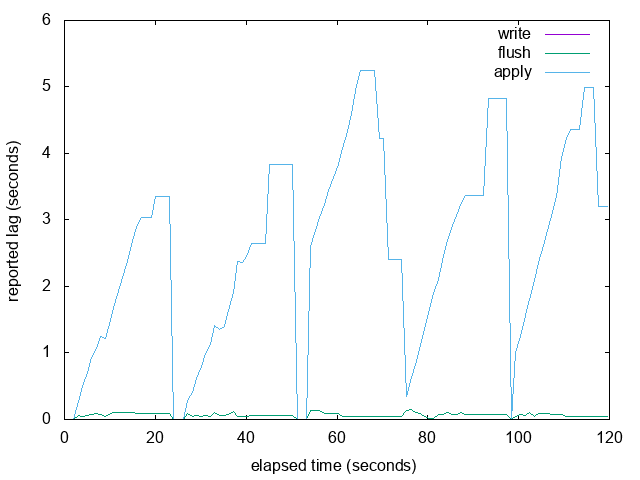
On Tue, Feb 21, 2017 at 6:21 PM, Simon Riggs <simon@2ndquadrant.com> wrote:
> I think what we need to show some test results with the graph of lag
> over time for these cases:
> 1. steady state - pgbench on master, so we can see how that responds
> 2. blocked apply on standby - so we can see how the lag increases but
> also how the accuracy goes down as the lag increases and whether the
> reported value changes (depending upon algo)
> 3. burst mode - where we go from not moving to moving at high speed
> and then stop again quickly
> +other use cases you or others add

Here are graphs of the 'burst' example from my previous email, with
LAG_TRACKER_BUFFER_SIZE set to 4 (really small so that it fills up)
and 8192 (the size I'm proposing in this patch).  It looks like the
resampling and interpolation work pretty well to me when the buffer is
full.

The overall graph looks pretty similar, but it is more likely to short
hiccups caused by occasional slow WAL fsyncs in walreceiver.   See the
attached graphs with 'spike' in the name: in the large buffer version
we see a short spike in write/flush lag and that results in apply
falling behind, but in the small buffer version we can only guess that
that might have happened because apply fell behind during the 3rd and
4th write bursts.  We don't know exactly why because we didn't have
sufficient samples to detect a short lived write/flush delay.

The workload just does this in a loop:

  DROP TABLE IF EXISTS foo;
  CREATE TABLE foo AS SELECT generate_series(1, 10000000);
  SELECT pg_sleep(10);

While testing with a small buffer I found a thinko when write_head is
moved back, fixed in the attached.

--
Thomas Munro
http://www.enterprisedb.com

--
Sent via pgsql-hackers mailing list (pgsql-hackers@postgresql.org)
To make changes to your subscription:
http://www.postgresql.org/mailpref/pgsql-hackers
Attachment
On Thu, Feb 23, 2017 at 11:52 AM, Thomas Munro
<thomas.munro@enterprisedb.com> wrote:
> The overall graph looks pretty similar, but it is more likely to short
> hiccups caused by occasional slow WAL fsyncs in walreceiver.   See the

I meant to write "more likely to *miss* short hiccups".

--
Thomas Munro
http://www.enterprisedb.com
On 21 February 2017 at 21:38, Thomas Munro
<thomas.munro@enterprisedb.com> wrote:
> On Tue, Feb 21, 2017 at 6:21 PM, Simon Riggs <simon@2ndquadrant.com> wrote:
>> And happier again, leading me to move to the next stage of review,
>> focusing on the behaviour emerging from the design.
>>
>> So my current understanding is that this doesn't rely upon LSN
>> arithmetic to measure lag, which is good. That means logical
>> replication should "just work" and future mechanisms to filter
>> physical WAL will also just work. This is important, so please comment
>> if you see that isn't the case.
>
> Yes, my understanding (based on
> https://www.postgresql.org/message-id/f453caad-0396-1bdd-c5c1-5094371f4776@2ndquadrant.com
> ) is that this should in principal work for logical replication, it
> just might show the same number in 2 or 3 of the lag columns because
> of the way it reports LSNs.
>
> However, I think a call like LagTrackerWrite(SendRqstPtr,
> GetCurrentTimestamp()) needs to go into XLogSendLogical, to mirror
> what happens in XLogSendPhysical.  I'm not sure about that.

Me neither, but I think we need this for both physical and logical.

Same use cases graphs for both, I think. There might be issues with
the way LSNs work for logical.

>> I think what we need to show some test results with the graph of lag
>> over time for these cases:
>> 1. steady state - pgbench on master, so we can see how that responds
>> 2. blocked apply on standby - so we can see how the lag increases but
>> also how the accuracy goes down as the lag increases and whether the
>> reported value changes (depending upon algo)
>> 3. burst mode - where we go from not moving to moving at high speed
>> and then stop again quickly
>> +other use cases you or others add
>
> Good idea.  Here are some graphs.  This is from a primary/standby pair
> running on my local development machine, so the times are low in the
> good cases.  For 1 and 2 I used pgbench TPCB-sort-of.  For 3 I used a
> loop that repeatedly dropped and created a huge table, sleeping in
> between.

Thanks, very nice

>> Does the proposed algo work for these cases? What goes wrong with it?
>> It's the examination of these downsides, if any, are the things we
>> need to investigate now to allow this to get committed.
>
> The main problem I discovered was with 2.  If replay is paused, then
> the reported LSN completely stops advancing, so replay_lag plateaus.
> When you resume replay, it starts reporting LSNs advancing again and
> suddenly discovers and reports a huge lag because it advances past the
> next sample in the buffer.
>
> I realised that you had suggested the solution to this problem
> already: interpolation.  I have added simple linear interpolation that
> checks if there is a future LSN in the buffer, and if so it
> interpolates linearly to synthesise the local flush time of the
> reported LSN, which is somewhere between the last and next sample's
> recorded local flush time.  This seems to work well for the
> apply-totally-stopped case.

Good

> I added a fourth case 'overwhelm.png' which you might find
> interesting.  It's essentially like one 'burst' followed by a 100% ide
> primary.  The primary stops sending new WAL around 50 seconds in and
> then there is no autovacuum, nothing happening at all.  The standby
> start is still replaying its backlog of WAL, but is sending back
> replies only every 10 seconds (because no WAL arriving so no other
> reason to send replies except status message timeout, which could be
> lowered).  So we see some big steps, and then we finally see it
> flat-line around 60 seconds because there is still now new WAL so we
> keep showing the last measured lag.  If new WAL is flushed it will pop
> back to 0ish, but until then its last known measurement is ~14
> seconds, which I don't think is technically wrong.

If I understand what you're saying, "14 secs" would not be seen as the
correct answer by our users when the delay is now zero.

Solving that is where the keepalives need to come into play. If no new
WAL, send a keepalive and track the lag on that.

>> Some minor points on code...
>> Why are things defined in walsender.c and not in .h?
>
> Because they are module-private.

;-) It wasn't a C question.


So looks like we're almost there.

--
Simon Riggs                http://www.2ndQuadrant.com/
PostgreSQL Development, 24x7 Support, Remote DBA, Training & Services
On Fri, Feb 24, 2017 at 9:05 AM, Simon Riggs <simon@2ndquadrant.com> wrote:
> On 21 February 2017 at 21:38, Thomas Munro
> <thomas.munro@enterprisedb.com> wrote:
>> However, I think a call like LagTrackerWrite(SendRqstPtr,
>> GetCurrentTimestamp()) needs to go into XLogSendLogical, to mirror
>> what happens in XLogSendPhysical.  I'm not sure about that.
>
> Me neither, but I think we need this for both physical and logical.
>
> Same use cases graphs for both, I think. There might be issues with
> the way LSNs work for logical.

This seems to be problematic.  Logical peers report LSN changes for
all three operations (write, flush, commit) only on commit.  I suppose
that might work OK for synchronous replication, but it makes it a bit
difficult to get lag measurements that don't look really strange and
sawtoothy when you have long transactions, and overlapping
transactions might interfere with the measurements in odd ways.  I
wonder if the way LSNs are reported by logical rep would need to be
changed first.  I need to study this some more and would be grateful
for ideas from any of the logical rep people.

>> I added a fourth case 'overwhelm.png' which you might find
>> interesting.  It's essentially like one 'burst' followed by a 100% ide
>> primary.  The primary stops sending new WAL around 50 seconds in and
>> then there is no autovacuum, nothing happening at all.  The standby
>> start is still replaying its backlog of WAL, but is sending back
>> replies only every 10 seconds (because no WAL arriving so no other
>> reason to send replies except status message timeout, which could be
>> lowered).  So we see some big steps, and then we finally see it
>> flat-line around 60 seconds because there is still now new WAL so we
>> keep showing the last measured lag.  If new WAL is flushed it will pop
>> back to 0ish, but until then its last known measurement is ~14
>> seconds, which I don't think is technically wrong.
>
> If I understand what you're saying, "14 secs" would not be seen as the
> correct answer by our users when the delay is now zero.
>
> Solving that is where the keepalives need to come into play. If no new
> WAL, send a keepalive and track the lag on that.

Hmm.  Currently it works strictly with measurements of real WAL write,
flush and apply times.  I rather like the simplicity of that
definition of the lag numbers, and the fact that they move only as a
result of genuine measured activity WAL.  A keepalive message is never
written, flushed or applied, so if we had special cases here to show
constant 0 or measure keepalive round-trip time when we hit the end of
known WAL or something like that, the reported lag times for those
three operations wouldn't be true.  In any real database cluster there
is real WAL being generated all the time, so after a big backload is
finally processed by a standby the "14 secs" won't linger for very
long, and during the time when you see that, it really is the last
true measured lag time.

I do see why a new user trying this feature for the first time might
expect it to show a lag of 0 just as soon as sent LSN =
write/flush/apply LSN or something like that, but after some
reflection I suspect that it isn't useful information, and it would be
smoke and mirrors rather than real data.

Perhaps you are thinking about the implications for alarm/monitoring
systems.  If you were worried about this phenomenon you could set your
alarm condition to sent_location != replay_location AND replay_lag >
INTERVAL 'x seconds', but I'm not actually convinced that's necessary:
the worst it could do is prolong an alarm that had been correctly
triggered until some new WAL is observed being processed fast enough.
There is an argument that until you've actually made such an
observation, you don't actually know that the alarm deserves to be
shut off yet: perhaps this way avoids some flip-flopping.

> So looks like we're almost there.

Thanks for the review and ideas!

Here is a new version that is rebased on top of the recent changes
ripping out floating point timestamps.  Reading those commits made it
clear to me that I should be using TimeOffset for elapsed times, not
int64, so I changed that.

--
Thomas Munro
http://www.enterprisedb.com

--
Sent via pgsql-hackers mailing list (pgsql-hackers@postgresql.org)
To make changes to your subscription:
http://www.postgresql.org/mailpref/pgsql-hackers
Attachment
On 1 March 2017 at 10:47, Thomas Munro <thomas.munro@enterprisedb.com> wrote:
> On Fri, Feb 24, 2017 at 9:05 AM, Simon Riggs <simon@2ndquadrant.com> wrote:
>> On 21 February 2017 at 21:38, Thomas Munro
>> <thomas.munro@enterprisedb.com> wrote:
>>> However, I think a call like LagTrackerWrite(SendRqstPtr,
>>> GetCurrentTimestamp()) needs to go into XLogSendLogical, to mirror
>>> what happens in XLogSendPhysical.  I'm not sure about that.
>>
>> Me neither, but I think we need this for both physical and logical.
>>
>> Same use cases graphs for both, I think. There might be issues with
>> the way LSNs work for logical.
>
> This seems to be problematic.  Logical peers report LSN changes for
> all three operations (write, flush, commit) only on commit.  I suppose
> that might work OK for synchronous replication, but it makes it a bit
> difficult to get lag measurements that don't look really strange and
> sawtoothy when you have long transactions, and overlapping
> transactions might interfere with the measurements in odd ways.  I
> wonder if the way LSNs are reported by logical rep would need to be
> changed first.  I need to study this some more and would be grateful
> for ideas from any of the logical rep people.

I have no doubt there are problems with the nature of logical
replication that affect this. Those things are not the problem of this
patch but that doesn't push everything away.

What we want from this patch is something that works for both, as much
as that is possible.

With that in mind, this patch should be able to provide sensible lag
measurements from a simple case like logical replication of a standard
pgbench run. If that highlights problems with this patch then we can
fix them here.

Thanks

--
Simon Riggs                http://www.2ndQuadrant.com/
PostgreSQL Development, 24x7 Support, Remote DBA, Training & Services
On 1 March 2017 at 10:47, Thomas Munro <thomas.munro@enterprisedb.com> wrote:

>>> I added a fourth case 'overwhelm.png' which you might find
>>> interesting.  It's essentially like one 'burst' followed by a 100% ide
>>> primary.  The primary stops sending new WAL around 50 seconds in and
>>> then there is no autovacuum, nothing happening at all.  The standby
>>> start is still replaying its backlog of WAL, but is sending back
>>> replies only every 10 seconds (because no WAL arriving so no other
>>> reason to send replies except status message timeout, which could be
>>> lowered).  So we see some big steps, and then we finally see it
>>> flat-line around 60 seconds because there is still now new WAL so we
>>> keep showing the last measured lag.  If new WAL is flushed it will pop
>>> back to 0ish, but until then its last known measurement is ~14
>>> seconds, which I don't think is technically wrong.
>>
>> If I understand what you're saying, "14 secs" would not be seen as the
>> correct answer by our users when the delay is now zero.
>>
>> Solving that is where the keepalives need to come into play. If no new
>> WAL, send a keepalive and track the lag on that.
>
> Hmm.  Currently it works strictly with measurements of real WAL write,
> flush and apply times.  I rather like the simplicity of that
> definition of the lag numbers, and the fact that they move only as a
> result of genuine measured activity WAL.  A keepalive message is never
> written, flushed or applied, so if we had special cases here to show
> constant 0 or measure keepalive round-trip time when we hit the end of
> known WAL or something like that, the reported lag times for those
> three operations wouldn't be true.  In any real database cluster there
> is real WAL being generated all the time, so after a big backload is
> finally processed by a standby the "14 secs" won't linger for very
> long, and during the time when you see that, it really is the last
> true measured lag time.
>
> I do see why a new user trying this feature for the first time might
> expect it to show a lag of 0 just as soon as sent LSN =
> write/flush/apply LSN or something like that, but after some
> reflection I suspect that it isn't useful information, and it would be
> smoke and mirrors rather than real data.

Perhaps I am misunderstanding the way it works.

If the last time WAL was generated the lag was 14 secs, then nothing
occurs for 2 hours aftwards AND all changes have been successfully
applied then it should not continue to show 14 secs for the next 2
hours.

IMHO the lag time should drop to zero in a reasonable time and stay at
zero for those 2 hours because there is no current lag.

If we want to show historical lag data, I'm supportive of the idea,
but we must report an accurate current value when the system is busy
and when the system is quiet.

--
Simon Riggs                http://www.2ndQuadrant.com/
PostgreSQL Development, 24x7 Support, Remote DBA, Training & Services
On 5 March 2017 at 15:31, Simon Riggs <simon@2ndquadrant.com> wrote:
> On 1 March 2017 at 10:47, Thomas Munro <thomas.munro@enterprisedb.com> wrote:

>> This seems to be problematic.  Logical peers report LSN changes for
>> all three operations (write, flush, commit) only on commit.  I suppose
>> that might work OK for synchronous replication, but it makes it a bit
>> difficult to get lag measurements that don't look really strange and
>> sawtoothy when you have long transactions, and overlapping
>> transactions might interfere with the measurements in odd ways.

They do, but those sawtoothy measurements are a true reflection of the
aspect of lag that's most important - what the downstream replica has
flushed to disk and made visible.

If we have xacts X1, X2 and X3, which commit in that order, then after
X1 commits the lag is the difference between X1's commit time and
"now". A peer only sends feedback updating flush position for commits.
Once X1 is confirmed replayed by the peer, the lag flush_location is
the difference between X2's later commit time and "now". And so on.

So I'd very much expect a sawtooth lag graph for flush_location,
because that's how logical replication really replays changes. We only
start replaying any xact once it commits on the upstream, and we
replay changes strictly in upstream commit order. It'll rise linearly
then fall vertically in abrupt drops.


sent_location is updated based on the last-decoded WAL position, per
src/backend/replication/walsender.c:2396 or so:
       record = XLogReadRecord(logical_decoding_ctx->reader,
logical_startptr, &errm);       logical_startptr = InvalidXLogRecPtr;
       /* xlog record was invalid */       if (errm != NULL)               elog(ERROR, "%s", errm);
       if (record != NULL)       {               LogicalDecodingProcessRecord(logical_decoding_ctx,
logical_decoding_ctx->reader);
               sentPtr = logical_decoding_ctx->reader->EndRecPtr;       }

so I would expect to see a smoother graph for sent_location based on
the last record processed by the XLogReader.

Though it's also a misleading graph, we haven't really sent that at
all, just decoded it and buffered it in a reorder buffer to send once
we decode a commit. Really, pg_stat_replication isn't quite expressive
enough to cover logical replication due to its reordering behaviour.
We can't really report the actual last LSN sent to the client very
easily, since we call into ReorderBufferCommit() and don't return
until we finish streaming the whole buffered xact, we'd need some kind
of callback to update the walsender with the lsn of the last row we
sent. And if we did this, sent_location would actually go backwards
sometimes, since usually with concurrent xacts the newest row in xact
committed at time T is newer, with higher LSN, than the oldest row in
xact with comit time T+n.

Later I'd like to add support for xact interleaving, where we can
speculatively stream rows from big in-progress xacts to the downstream
before the xact commits, and the downstream has to roll the xact back
if it aborts on the upstream. There are some snapshot management
issues to deal with there (not to mention downstream deadlock
hazards), but maybe we can limit the optimisation to xacts that made
no catalog changes to start with. I'm not at all sure how to report
sent_location then, though, or what a reasonable measure of lag will
look like.

> What we want from this patch is something that works for both, as much
> as that is possible.

If it shows a sawtooth pattern for flush lag, that's good, because
it's truthful. We can only flush after we replay commit, therefore lag
is always going to be sawtooth, with tooth size approximating xact
size and the baseline lag trend representing any sustained increase or
decrease in lag over time.

This would be extremely valuable to have.


-- Craig Ringer                   http://www.2ndQuadrant.com/PostgreSQL Development, 24x7 Support, Training & Services
Hi,

Please see separate replies to Simon and Craig below.

On Sun, Mar 5, 2017 at 8:38 PM, Simon Riggs <simon@2ndquadrant.com> wrote:
> On 1 March 2017 at 10:47, Thomas Munro <thomas.munro@enterprisedb.com> wrote:
>> I do see why a new user trying this feature for the first time might
>> expect it to show a lag of 0 just as soon as sent LSN =
>> write/flush/apply LSN or something like that, but after some
>> reflection I suspect that it isn't useful information, and it would be
>> smoke and mirrors rather than real data.
>
> Perhaps I am misunderstanding the way it works.
>
> If the last time WAL was generated the lag was 14 secs, then nothing
> occurs for 2 hours aftwards AND all changes have been successfully
> applied then it should not continue to show 14 secs for the next 2
> hours.
>
> IMHO the lag time should drop to zero in a reasonable time and stay at
> zero for those 2 hours because there is no current lag.
>
> If we want to show historical lag data, I'm supportive of the idea,
> but we must report an accurate current value when the system is busy
> and when the system is quiet.

Ok, I thought about this for a bit and have a new idea that I hope
will be more acceptable.  Here are the approaches considered:

1.  Show the last measured lag times on a completely idle system until
such time as the standby eventually processes more lag, as I had it in
the v5 patch.  You don't like that and I admit that it is not really
satisfying (even though I know that real Postgres systems alway
generate more WAL fairly soon even without user sessions, it's not
great that it depends on an unknown future event to clear the old
data).

2.  Recognise when the last reported write/flush/apply LSN from the
standby == end of WAL on the sending server, and show lag times of
00:00:00 in all three columns.  I consider this entirely bogus: it's
not an actual measurement that was ever made, and on an active system
it would flip-flop between real measurements and the artificial
00:00:00.  I do not like this.

3.  Recognise the end of WAL as above, but show SQL NULL in the
columns.  Now we don't show an entirely bogus number like 00:00:00 but
we still have the flickering/flip-flopping between nothing and a
measured number during typical use (ie during short periods of
idleness between writes).  I do not like this.

4.  Somehow attempt to measure the round trip time for a keep-alive
message or similar during idle periods.  This means that we would be
taking something that reflects one component of the usual lag
measurements, namely network transfer, but I think we would making
false claims when we show that in columns that report measured write
time, flush time and apply time.  I do not like this.

5.  The new proposal:  Show only true measured write/flush/apply data,
as in 1, but with a time limit.  To avoid the scenario where we show
the same times during prolonged periods of idleness, clear the numbers
like in option 3 after a period of idleness.  This way we avoid the
dreaded flickering/flip-flopping.  A natural time to do that is when
wal_receiver_status_interval expires on idle systems and defaults to
10 seconds.

Done using approach 5 in the attached version.  Do you think this is a
good compromise?  No bogus numbers, only true measured
write/flush/apply times, but a time limit on 'stale' lag information.

On Mon, Mar 6, 2017 at 3:22 AM, Craig Ringer <craig@2ndquadrant.com> wrote:
> On 5 March 2017 at 15:31, Simon Riggs <simon@2ndquadrant.com> wrote:
>> What we want from this patch is something that works for both, as much
>> as that is possible.
>
> If it shows a sawtooth pattern for flush lag, that's good, because
> it's truthful. We can only flush after we replay commit, therefore lag
> is always going to be sawtooth, with tooth size approximating xact
> size and the baseline lag trend representing any sustained increase or
> decrease in lag over time.
>
> This would be extremely valuable to have.

Thanks for your detailed explanation Craig.  (I also had a chat with
Craig about this off-list.)  Based on your feedback, I've added
support for reporting lag from logical replication, warts and all.

Just a thought:  perhaps logical replication could consider
occasionally reporting a 'write' position based on decoded WAL written
to reorder buffers (rather than just reporting the apply LSN as write
LSN at commit time)?  I think that would be interesting information in
its own right, but would also provide more opportunities to
interpolate the flush/apply sawtooth for large transactions.

Please find a new version attached.

--
Thomas Munro
http://www.enterprisedb.com

--
Sent via pgsql-hackers mailing list (pgsql-hackers@postgresql.org)
To make changes to your subscription:
http://www.postgresql.org/mailpref/pgsql-hackers
Attachment
Hi

Just adding a couple of thoughts on this.

On 03/14/2017 08:39 AM, Thomas Munro wrote:> Hi,>> Please see separate replies to Simon and Craig below.>> On Sun, Mar
5,2017 at 8:38 PM, Simon Riggs <simon@2ndquadrant.com> wrote:>> On 1 March 2017 at 10:47, Thomas Munro
<thomas.munro@enterprisedb.com>wrote:>>> I do see why a new user trying this feature for the first time might>>> expect
itto show a lag of 0 just as soon as sent LSN =>>> write/flush/apply LSN or something like that, but after some>>>
reflectionI suspect that it isn't useful information, and it would be>>> smoke and mirrors rather than real data.>>>>
PerhapsI am misunderstanding the way it works.>>>> If the last time WAL was generated the lag was 14 secs, then
nothing>>occurs for 2 hours aftwards AND all changes have been successfully>> applied then it should not continue to
show14 secs for the next 2>> hours.>>>> IMHO the lag time should drop to zero in a reasonable time and stay at>> zero
forthose 2 hours because there is no current lag.>>>> If we want to show historical lag data, I'm supportive of the
idea,>>but we must report an accurate current value when the system is busy>> and when the system is quiet.>> Ok, I
thoughtabout this for a bit and have a new idea that I hope> will be more acceptable.  Here are the approaches
considered:

(...)> 2.  Recognise when the last reported write/flush/apply LSN from the> standby == end of WAL on the sending
server,and show lag times of> 00:00:00 in all three columns.  I consider this entirely bogus: it's> not an actual
measurementthat was ever made, and on an active system> it would flip-flop between real measurements and the
artificial>00:00:00.  I do not like this.


I agree with this; while initially I was expecting to see 00:00:00,
SQL NULL is definitely correct here. Anyone writing tools etc. which need to
report an actual interval can convert this to 00:00:00 easily enough .

(...)
> 5.  The new proposal:  Show only true measured write/flush/apply data,> as in 1, but with a time limit.  To avoid the
scenariowhere we show> the same times during prolonged periods of idleness, clear the numbers> like in option 3 after a
periodof idleness.  This way we avoid the> dreaded flickering/flip-flopping.  A natural time to do that is when>
wal_receiver_status_intervalexpires on idle systems and defaults to> 10 seconds.>> Done using approach 5 in the
attachedversion.  Do you think this is a> good compromise?  No bogus numbers, only true measured> write/flush/apply
times,but a time limit on 'stale' lag information.


This makes sense to me. I'd also add that while on production servers
it's likely there'll be enough activity to keep the columns updated,
on a quiescent test/development systems seeing a stale value looks plain
wrong (and will cause no end of questions from people asking why lag
is still showing when their system isn't doing anything).

I suggest the documentation of these columns needs to be extended to mention
that they will be NULL if no lag was measured recently, and to explain
the circumstances in which the numbers are cleared.


Regards

Ian Barwick

-- Ian Barwick                   http://www.2ndQuadrant.com/ PostgreSQL Development, 24x7 Support, Training & Services


--  Ian Barwick                   http://www.2ndQuadrant.com/ PostgreSQL Development, 24x7 Support, Training &
Services
On 14 March 2017 at 07:39, Thomas Munro <thomas.munro@enterprisedb.com> wrote:
>
> On Mon, Mar 6, 2017 at 3:22 AM, Craig Ringer <craig@2ndquadrant.com> wrote:
>> On 5 March 2017 at 15:31, Simon Riggs <simon@2ndquadrant.com> wrote:
>>> What we want from this patch is something that works for both, as much
>>> as that is possible.
>>
>> If it shows a sawtooth pattern for flush lag, that's good, because
>> it's truthful. We can only flush after we replay commit, therefore lag
>> is always going to be sawtooth, with tooth size approximating xact
>> size and the baseline lag trend representing any sustained increase or
>> decrease in lag over time.
>>
>> This would be extremely valuable to have.
>
> Thanks for your detailed explanation Craig.  (I also had a chat with
> Craig about this off-list.)  Based on your feedback, I've added
> support for reporting lag from logical replication, warts and all.
>
> Just a thought:  perhaps logical replication could consider
> occasionally reporting a 'write' position based on decoded WAL written
> to reorder buffers (rather than just reporting the apply LSN as write
> LSN at commit time)?  I think that would be interesting information in
> its own right, but would also provide more opportunities to
> interpolate the flush/apply sawtooth for large transactions.
>
> Please find a new version attached.

My summary is that with logical the values only change at commit time.
With a stream of small transactions there shouldn't be any noticeable
sawtooth.

Please put in a substantive comment, rather than just "See explanation
in XLogSendPhysical" cos that's clearly not enough. Please write docs
so I can commit this.

--
Simon Riggs                http://www.2ndQuadrant.com/
PostgreSQL Development, 24x7 Support, Remote DBA, Training & Services
On 14 March 2017 at 07:39, Thomas Munro <thomas.munro@enterprisedb.com> wrote:
> Hi,
>
> Please see separate replies to Simon and Craig below.
>
> On Sun, Mar 5, 2017 at 8:38 PM, Simon Riggs <simon@2ndquadrant.com> wrote:
>> On 1 March 2017 at 10:47, Thomas Munro <thomas.munro@enterprisedb.com> wrote:
>>> I do see why a new user trying this feature for the first time might
>>> expect it to show a lag of 0 just as soon as sent LSN =
>>> write/flush/apply LSN or something like that, but after some
>>> reflection I suspect that it isn't useful information, and it would be
>>> smoke and mirrors rather than real data.
>>
>> Perhaps I am misunderstanding the way it works.
>>
>> If the last time WAL was generated the lag was 14 secs, then nothing
>> occurs for 2 hours aftwards AND all changes have been successfully
>> applied then it should not continue to show 14 secs for the next 2
>> hours.
>>
>> IMHO the lag time should drop to zero in a reasonable time and stay at
>> zero for those 2 hours because there is no current lag.
>>
>> If we want to show historical lag data, I'm supportive of the idea,
>> but we must report an accurate current value when the system is busy
>> and when the system is quiet.
>
> Ok, I thought about this for a bit and have a new idea that I hope
> will be more acceptable.  Here are the approaches considered:
>
> 1.  Show the last measured lag times on a completely idle system until
> such time as the standby eventually processes more lag, as I had it in
> the v5 patch.  You don't like that and I admit that it is not really
> satisfying (even though I know that real Postgres systems alway
> generate more WAL fairly soon even without user sessions, it's not
> great that it depends on an unknown future event to clear the old
> data).
>
> 2.  Recognise when the last reported write/flush/apply LSN from the
> standby == end of WAL on the sending server, and show lag times of
> 00:00:00 in all three columns.  I consider this entirely bogus: it's
> not an actual measurement that was ever made, and on an active system
> it would flip-flop between real measurements and the artificial
> 00:00:00.  I do not like this.

There are two ways of knowing the lag: 1) by measurement/sampling,
which is the main way this patch approaches this, 2) by direct
observation the LSNs match. Both are equally valid ways of
establishing knowledge. Strangely (2) is the only one of those that is
actually precise and yet you say it is bogus. It is actually the
measurements which are approximations of the actual state.

The reality is that the lag can change dis-continuously between zero
and non-zero. I don't think we should hide that from people.

I suspect that your "entirely bogus" feeling comes from the point that
we actually have 3 states, one of which has unknown lag.

A) "Currently caught-up"
WALSender LSN == WALReceiver LSN (info type (1))
At this point the current lag is known precisely to be zero.

B) "Work outstanding, no reply yet"
Immediately after where WALSenderLSN > WALReceiverLSN, yet we haven't
yet received new reply
We expect to stay in this state for however long it takes to receive a
reply, which could be wal_receiver_status_interval or longer if the
lag is greater. At this point we have no measurement of what the lag
is. We could reply NULL since we don't know. We could reply with the
last measured lag when we were last in state C, but if the new reply
was delayed for more than that we'd need to reply that the lag is at
least as high as the delay since last time we left state A.

C) "Continuous flow"
WALSenderLSN > WALReceiverLSN and we have received a reply
(measurement, info type (2))
This is the main case. Easy-ish!

So I think we need to first agree that A and B states exist and how to
report lag in each state.

--
Simon Riggs                http://www.2ndQuadrant.com/
PostgreSQL Development, 24x7 Support, Remote DBA, Training & Services
On Thu, Mar 16, 2017 at 12:07 PM, Simon Riggs <simon@2ndquadrant.com> wrote:
> There are two ways of knowing the lag: 1) by measurement/sampling,
> which is the main way this patch approaches this, 2) by direct
> observation the LSNs match. Both are equally valid ways of
> establishing knowledge. Strangely (2) is the only one of those that is
> actually precise and yet you say it is bogus. It is actually the
> measurements which are approximations of the actual state.
>
> The reality is that the lag can change dis-continuously between zero
> and non-zero. I don't think we should hide that from people.
>
> I suspect that your "entirely bogus" feeling comes from the point that
> we actually have 3 states, one of which has unknown lag.
>
> A) "Currently caught-up"
> WALSender LSN == WALReceiver LSN (info type (1))
> At this point the current lag is known precisely to be zero.
>
> B) "Work outstanding, no reply yet"
> Immediately after where WALSenderLSN > WALReceiverLSN, yet we haven't
> yet received new reply
> We expect to stay in this state for however long it takes to receive a
> reply, which could be wal_receiver_status_interval or longer if the
> lag is greater. At this point we have no measurement of what the lag
> is. We could reply NULL since we don't know. We could reply with the
> last measured lag when we were last in state C, but if the new reply
> was delayed for more than that we'd need to reply that the lag is at
> least as high as the delay since last time we left state A.
>
> C) "Continuous flow"
> WALSenderLSN > WALReceiverLSN and we have received a reply
> (measurement, info type (2))
> This is the main case. Easy-ish!
>
> So I think we need to first agree that A and B states exist and how to
> report lag in each state.

I agree that these states exist, but we disagree on what 'lag' really
means, or, rather, which of several plausible definitions would be the
most useful here.

My proposal is that the *_lag columns should always report how long it
took for recently written, flushed and applied WAL to be written,
flushed and applied (and for the primary to know about it).  By this
definition, sent LSN = applied LSN is not a special case: we simply
report how long that LSN took to be written, flushed and applied.

Your proposal is that the *_lag columns should report how far in the
past the standby is at each of the three stages with respect to the
current end of WAL.  By this definition when sent LSN = applied LSN we
are currently in the 'A' state meaning 'caught up' and should show
00:00:00.

Here are two reasons I prefer my definition:

* you can trivially convert from my definition to yours on the basis
of existing information: CASE WHEN sent_location = replay_location
THEN '00:00:00'::interval ELSE replay_lag END, but there is no way to
get from your definition to mine

* lag numbers reported using my definition tell you how long each of
the synchronous replication levels take, but with your definition they
only do that if you catch them during times when they aren't showing
the special case 00:00:00; a fast standby running any workload other
than a benchmark is often going to show all-caught-up 00:00:00 so the
new columns will be useless for that purpose

--
Thomas Munro
http://www.enterprisedb.com
On 16 March 2017 at 08:02, Thomas Munro <thomas.munro@enterprisedb.com> wrote:

> I agree that these states exist, but we disagree on what 'lag' really
> means, or, rather, which of several plausible definitions would be the
> most useful here.
>
> My proposal is that the *_lag columns should always report how long it
> took for recently written, flushed and applied WAL to be written,
> flushed and applied (and for the primary to know about it).  By this
> definition, sent LSN = applied LSN is not a special case: we simply
> report how long that LSN took to be written, flushed and applied.
>
> Your proposal is that the *_lag columns should report how far in the
> past the standby is at each of the three stages with respect to the
> current end of WAL.  By this definition when sent LSN = applied LSN we
> are currently in the 'A' state meaning 'caught up' and should show
> 00:00:00.

I accept your proposal for how we handle these, on condition that you
write up some docs that explain the subtle difference between the two,
so we can just show people the URL. That needs to explain clearly the
difference in an impartial way between "what is the most recent lag
measurement" and "how long until we are caught up" as possible
intrepretations of these values. Thanks.

--
Simon Riggs                http://www.2ndQuadrant.com/
PostgreSQL Development, 24x7 Support, Remote DBA, Training & Services
Hi Thomas,

On 3/15/17 8:38 PM, Simon Riggs wrote:
> On 16 March 2017 at 08:02, Thomas Munro <thomas.munro@enterprisedb.com> wrote:
>
>> I agree that these states exist, but we disagree on what 'lag' really
>> means, or, rather, which of several plausible definitions would be the
>> most useful here.
>>
>> My proposal is that the *_lag columns should always report how long it
>> took for recently written, flushed and applied WAL to be written,
>> flushed and applied (and for the primary to know about it).  By this
>> definition, sent LSN = applied LSN is not a special case: we simply
>> report how long that LSN took to be written, flushed and applied.
>>
>> Your proposal is that the *_lag columns should report how far in the
>> past the standby is at each of the three stages with respect to the
>> current end of WAL.  By this definition when sent LSN = applied LSN we
>> are currently in the 'A' state meaning 'caught up' and should show
>> 00:00:00.
>
> I accept your proposal for how we handle these, on condition that you
> write up some docs that explain the subtle difference between the two,
> so we can just show people the URL. That needs to explain clearly the
> difference in an impartial way between "what is the most recent lag
> measurement" and "how long until we are caught up" as possible
> intrepretations of these values. Thanks.

This thread has been idle for six days.  Please respond and/or post a
new patch by 2017-03-24 00:00 AoE (UTC-12) or this submission will be
marked "Returned with Feedback".

Thanks,
--
-David
david@pgmasters.net
On 21 March 2017 at 17:32, David Steele <david@pgmasters.net> wrote:
> Hi Thomas,
>
> On 3/15/17 8:38 PM, Simon Riggs wrote:
>>
>> On 16 March 2017 at 08:02, Thomas Munro <thomas.munro@enterprisedb.com>
>> wrote:
>>
>>> I agree that these states exist, but we disagree on what 'lag' really
>>> means, or, rather, which of several plausible definitions would be the
>>> most useful here.
>>>
>>> My proposal is that the *_lag columns should always report how long it
>>> took for recently written, flushed and applied WAL to be written,
>>> flushed and applied (and for the primary to know about it).  By this
>>> definition, sent LSN = applied LSN is not a special case: we simply
>>> report how long that LSN took to be written, flushed and applied.
>>>
>>> Your proposal is that the *_lag columns should report how far in the
>>> past the standby is at each of the three stages with respect to the
>>> current end of WAL.  By this definition when sent LSN = applied LSN we
>>> are currently in the 'A' state meaning 'caught up' and should show
>>> 00:00:00.
>>
>>
>> I accept your proposal for how we handle these, on condition that you
>> write up some docs that explain the subtle difference between the two,
>> so we can just show people the URL. That needs to explain clearly the
>> difference in an impartial way between "what is the most recent lag
>> measurement" and "how long until we are caught up" as possible
>> intrepretations of these values. Thanks.
>
>
> This thread has been idle for six days.  Please respond and/or post a new
> patch by 2017-03-24 00:00 AoE (UTC-12) or this submission will be marked
> "Returned with Feedback".

Thomas, Are you working on another version even? You've not replied to
me or David, so its difficult to know what next.

Not sure whether this a 6 day lag, or we should show NULL because we
are up to date.

--
Simon Riggs                http://www.2ndQuadrant.com/
PostgreSQL Development, 24x7 Support, Remote DBA, Training & Services
On Wed, Mar 22, 2017 at 11:57 PM, Simon Riggs <simon@2ndquadrant.com> wrote:
>>> I accept your proposal for how we handle these, on condition that you
>>> write up some docs that explain the subtle difference between the two,
>>> so we can just show people the URL. That needs to explain clearly the
>>> difference in an impartial way between "what is the most recent lag
>>> measurement" and "how long until we are caught up" as possible
>>> intrepretations of these values. Thanks.
>>
>>
>> This thread has been idle for six days.  Please respond and/or post a new
>> patch by 2017-03-24 00:00 AoE (UTC-12) or this submission will be marked
>> "Returned with Feedback".
>
> Thomas, Are you working on another version even? You've not replied to
> me or David, so its difficult to know what next.
>
> Not sure whether this a 6 day lag, or we should show NULL because we
> are up to date.

Hah.  Apologies for the delay -- I will post a patch with
documentation as requested within 24 hours.

--
Thomas Munro
http://www.enterprisedb.com
On 22 March 2017 at 11:03, Thomas Munro <thomas.munro@enterprisedb.com> wrote:

> Hah.  Apologies for the delay -- I will post a patch with
> documentation as requested within 24 hours.

Thanks very much. I'll reserve time to commit it tomorrow, all else being good.

--
Simon Riggs                http://www.2ndQuadrant.com/
PostgreSQL Development, 24x7 Support, Remote DBA, Training & Services
On Wed, Mar 22, 2017 at 6:57 AM, Simon Riggs <simon@2ndquadrant.com> wrote:
> Not sure whether this a 6 day lag, or we should show NULL because we
> are up to date.

OK, that made me laugh.

Thanks for putting in the effort on this patch, BTW.

--
Robert Haas
EnterpriseDB: http://www.enterprisedb.com
The Enterprise PostgreSQL Company
On Thu, Mar 23, 2017 at 12:12 AM, Simon Riggs <simon@2ndquadrant.com> wrote:
> On 22 March 2017 at 11:03, Thomas Munro <thomas.munro@enterprisedb.com> wrote:
>
>> Hah.  Apologies for the delay -- I will post a patch with
>> documentation as requested within 24 hours.
>
> Thanks very much. I'll reserve time to commit it tomorrow, all else being good.

Thanks!  Please find attached v7, which includes a note we can point
at when someone asks why it doesn't show 00:00:00, as requested.

--
Thomas Munro
http://www.enterprisedb.com

--
Sent via pgsql-hackers mailing list (pgsql-hackers@postgresql.org)
To make changes to your subscription:
http://www.postgresql.org/mailpref/pgsql-hackers
Attachment
On Wed, Mar 15, 2017 at 8:15 PM, Ian Barwick
<ian.barwick@2ndquadrant.com> wrote:
>> 2.  Recognise when the last reported write/flush/apply LSN from the
>> standby == end of WAL on the sending server, and show lag times of
>> 00:00:00 in all three columns.  I consider this entirely bogus: it's
>> not an actual measurement that was ever made, and on an active system
>> it would flip-flop between real measurements and the artificial
>> 00:00:00.  I do not like this.
>
> I agree with this; while initially I was expecting to see 00:00:00,
> SQL NULL is definitely correct here. Anyone writing tools etc. which need to
> report an actual interval can convert this to 00:00:00 easily enough .

Right.

Another point here is that if someone really wants to see "estimated
time until caught up to current end of WAL" where 00:00:00 makes sense
when fully replayed, then it is already possible to compute that using
information that is published in pg_stat_replication in 9.6.

An external tool or a plpgsql function could do something like:
observe replay_location twice with a sleep in between to estimate the
current rate of replay, then divide the current distance between
replay location and end-of-WAL by the replay rate to estimate the time
of arrival.  I think the result would behave a bit like the infamous
Windows file transfer dialogue ("3 seconds, not 7 months, no 4
seconds, no INFINITY, oh wait 0 seconds, you have arrived at your
destination!") due to the lumpiness of replay, though perhaps that
could be corrected by applying the right kind of smoothing to the
rate.  I thought about something like that but figured it would be
better to stick to measuring facts about the past rather than making
predictions about the future.  That's on top of the more serious
problem for the syncrep delay measurement use case, where I started
this journey, that many systems would show zero whenever you query
them because they often catch up in between writes, even though sync
rep is not free.

>> 5.  The new proposal:  Show only true measured write/flush/apply data,
>> as in 1, but with a time limit.  To avoid the scenario where we show
>> the same times during prolonged periods of idleness, clear the numbers
>> like in option 3 after a period of idleness.  This way we avoid the
>> dreaded flickering/flip-flopping.  A natural time to do that is when
>> wal_receiver_status_interval expires on idle systems and defaults to
>> 10 seconds.
>>
>> Done using approach 5 in the attached version.  Do you think this is a
>> good compromise?  No bogus numbers, only true measured
>> write/flush/apply times, but a time limit on 'stale' lag information.
>
> This makes sense to me. I'd also add that while on production servers
> it's likely there'll be enough activity to keep the columns updated,
> on a quiescent test/development systems seeing a stale value looks plain
> wrong (and will cause no end of questions from people asking why lag
> is still showing when their system isn't doing anything).

Cool, and now Simon has agreed to this too.

> I suggest the documentation of these columns needs to be extended to mention
> that they will be NULL if no lag was measured recently, and to explain
> the circumstances in which the numbers are cleared.

Done in the v7.  Thanks for the feedback!

--
Thomas Munro
http://www.enterprisedb.com
On 23 March 2017 at 01:02, Thomas Munro <thomas.munro@enterprisedb.com> wrote:

> Thanks!  Please find attached v7, which includes a note we can point
> at when someone asks why it doesn't show 00:00:00, as requested.

Thanks.

Now I look harder the handling for logical lag seems like it would be
problematic in many cases. It's up to the plugin whether it sends
anything at all, so we should make a LagTrackerWrite() call only if
the plugin sends something. Otherwise the lag tracker will just slow
down logical replication.

What I think we should do is add an LSN onto LogicalDecodingContext to
represent the last LSN sent by the plugin, if any.

If that advances after the call to LogicalDecodingProcessRecord() then
we know we just sent a message and we can track that with
LagTrackerWrite().

So we make it the plugin's responsibility to maintain this LSN
correctly, if at all. (It may decide not to)

In English that means the plugin will update the LSN after each
Commit, and since we reply only on commit this will provide a series
of measurements we can use. It will still give a saw-tooth, but its
better than flooding the LagTracker with false measurements.

I think it seems easier to add that as a minor cleanup/open item after
this commit.

--
Simon Riggs                http://www.2ndQuadrant.com/
PostgreSQL Development, 24x7 Support, Remote DBA, Training & Services
On 23 March 2017 at 06:42, Simon Riggs <simon@2ndquadrant.com> wrote:
> On 23 March 2017 at 01:02, Thomas Munro <thomas.munro@enterprisedb.com> wrote:
>
>> Thanks!  Please find attached v7, which includes a note we can point
>> at when someone asks why it doesn't show 00:00:00, as requested.
>
> Thanks.
>
> Now I look harder the handling for logical lag seems like it would be
> problematic in many cases. It's up to the plugin whether it sends
> anything at all, so we should make a LagTrackerWrite() call only if
> the plugin sends something. Otherwise the lag tracker will just slow
> down logical replication.
>
> What I think we should do is add an LSN onto LogicalDecodingContext to
> represent the last LSN sent by the plugin, if any.
>
> If that advances after the call to LogicalDecodingProcessRecord() then
> we know we just sent a message and we can track that with
> LagTrackerWrite().
>
> So we make it the plugin's responsibility to maintain this LSN
> correctly, if at all. (It may decide not to)
>
> In English that means the plugin will update the LSN after each
> Commit, and since we reply only on commit this will provide a series
> of measurements we can use. It will still give a saw-tooth, but its
> better than flooding the LagTracker with false measurements.
>
> I think it seems easier to add that as a minor cleanup/open item after
> this commit.

Second thoughts... I'll just make LagTrackerWrite externally
available, so a plugin can send anything it wants to the tracker.
Which means I'm explicitly removing the "logical replication support"
from this patch.

--
Simon Riggs                http://www.2ndQuadrant.com/
PostgreSQL Development, 24x7 Support, Remote DBA, Training & Services
> Second thoughts... I'll just make LagTrackerWrite externally
> available, so a plugin can send anything it wants to the tracker.
> Which means I'm explicitly removing the "logical replication support"
> from this patch.

Done.

Here's the patch I'm looking to commit, with some docs and minor code
changes as discussed.

--
Simon Riggs                http://www.2ndQuadrant.com/
PostgreSQL Development, 24x7 Support, Remote DBA, Training & Services

--
Sent via pgsql-hackers mailing list (pgsql-hackers@postgresql.org)
To make changes to your subscription:
http://www.postgresql.org/mailpref/pgsql-hackers
Attachment
On Thu, Mar 23, 2017 at 10:50 PM, Simon Riggs <simon@2ndquadrant.com> wrote:
>> Second thoughts... I'll just make LagTrackerWrite externally
>> available, so a plugin can send anything it wants to the tracker.
>> Which means I'm explicitly removing the "logical replication support"
>> from this patch.
>
> Done.
>
> Here's the patch I'm looking to commit, with some docs and minor code
> changes as discussed.

Giving LagTrackerWrite external linkage seems sensible, assuming there
is a reasonable way for logical replication to decide when to call it.

+    system. Monitoring systems should choose whether the represent this
+    as missing data, zero or continue to display the last known value.

s/whether the/whether to/

--
Thomas Munro
http://www.enterprisedb.com
On Thu, Mar 23, 2017 at 10:50 PM, Simon Riggs <simon@2ndquadrant.com> wrote:
>> Second thoughts... I'll just make LagTrackerWrite externally
>> available, so a plugin can send anything it wants to the tracker.
>> Which means I'm explicitly removing the "logical replication support"
>> from this patch.
>
> Done.
>
> Here's the patch I'm looking to commit, with some docs and minor code
> changes as discussed.

Thank you for committing this.  Time-based replication lag tracking
seems to be a regular topic on mailing lists and IRC, so I hope that
this will provide what people are looking for and not simply replace
that discussion with a new discussion about what lag really means :-)

Many thanks to Simon and Fujii-san for convincing me to move the
buffer to the sender (which now seems so obviously better), to
Fujii-san for the idea of tracking write and flush lag too, and to
Abhijit, Sawada-san, Ian, Craig and Robert for valuable feedback.

--
Thomas Munro
http://www.enterprisedb.com
On 24 March 2017 at 05:39, Thomas Munro <thomas.munro@enterprisedb.com> wrote:

> Fujii-san for the idea of tracking write and flush lag too

You mentioned wishing that logical replication would update sent lag
as the decoding position.

It appears to do just that already; see the references to restart_lsn
in StartLogicalReplication, and the update of sentPtr in
XLogSendLogical .

It's a bit misleading, since it hasn't *sent* anything, it buffers it
until commit. But it's useful.

-- Craig Ringer                   http://www.2ndQuadrant.com/PostgreSQL Development, 24x7 Support, Training & Services