Thread: Performance bottleneck. High active sessions but postmaster kernel threads are in a sleep state, low CPU utilization
Performance bottleneck. High active sessions but postmaster kernel threads are in a sleep state, low CPU utilization
From
Hotmail
Date:
Hi All,
We are trying to gain some insight into a performance bottleneck that we are hitting while load testing Postgres on 11.11. We are running in a GCP environment on a server with 244 vcpu's
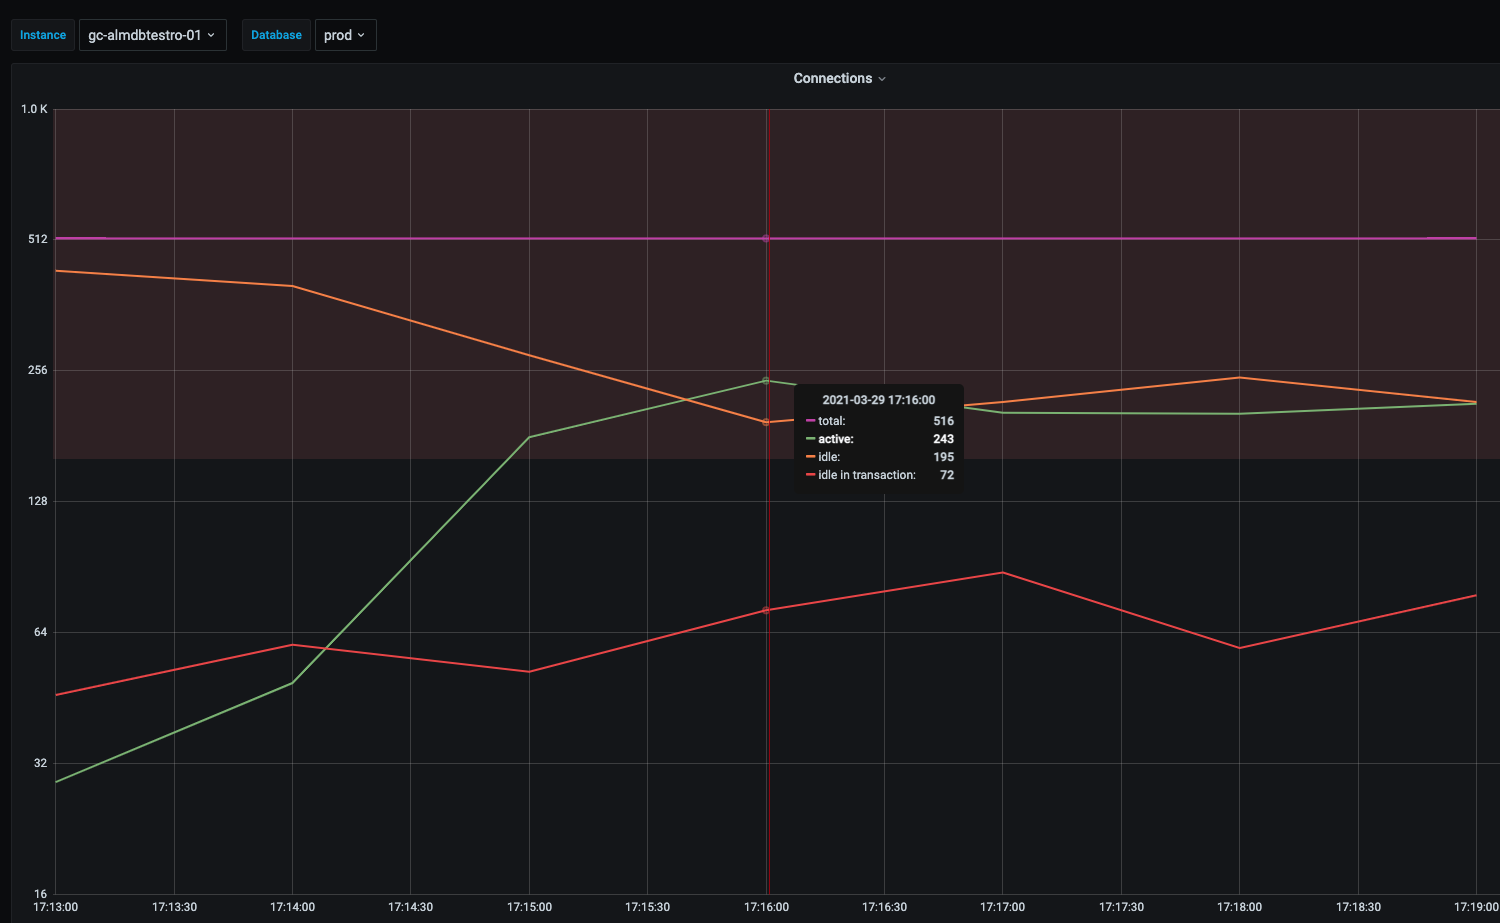
In our testing active sessions are running fine and then we hit a hockey stick where active sessions spike way up but we don’t see a corresponding increase in CPU utlization on the server.
Here’s a grafana graph of the pg_stat_activity sessions states.
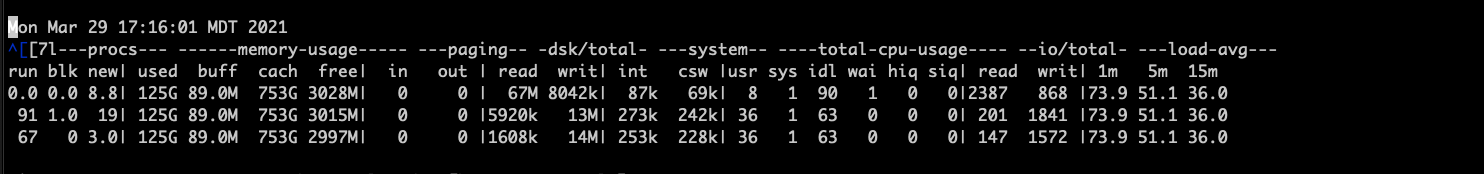
CPU utilization is not close to maximum when this event occurs with the server CPU utilization being 2/3 idle. Here’s a quick look at dstat output when the bottleneck occurs:
What has us stumped is that while we have a lot of sessions in an active state when we sample the postmaster threads with a Linux process profiling tool we see that many of the postmaster process threads are in a sleep state on the wait channel “poll schedule timeout” and only a fraction of what the database considers to be active sessions are actually running on the CPU. Here’s what we see in the profiler.

If we drill down into the postmaster threads that are sleeping we can verify that these threads are truly in a postgres select statement and waiting on a kernel stack backtrace of "system_call_fastpath()->SyS_select()->core_sys_select()->do_select()->poll_schedule_timeout()"

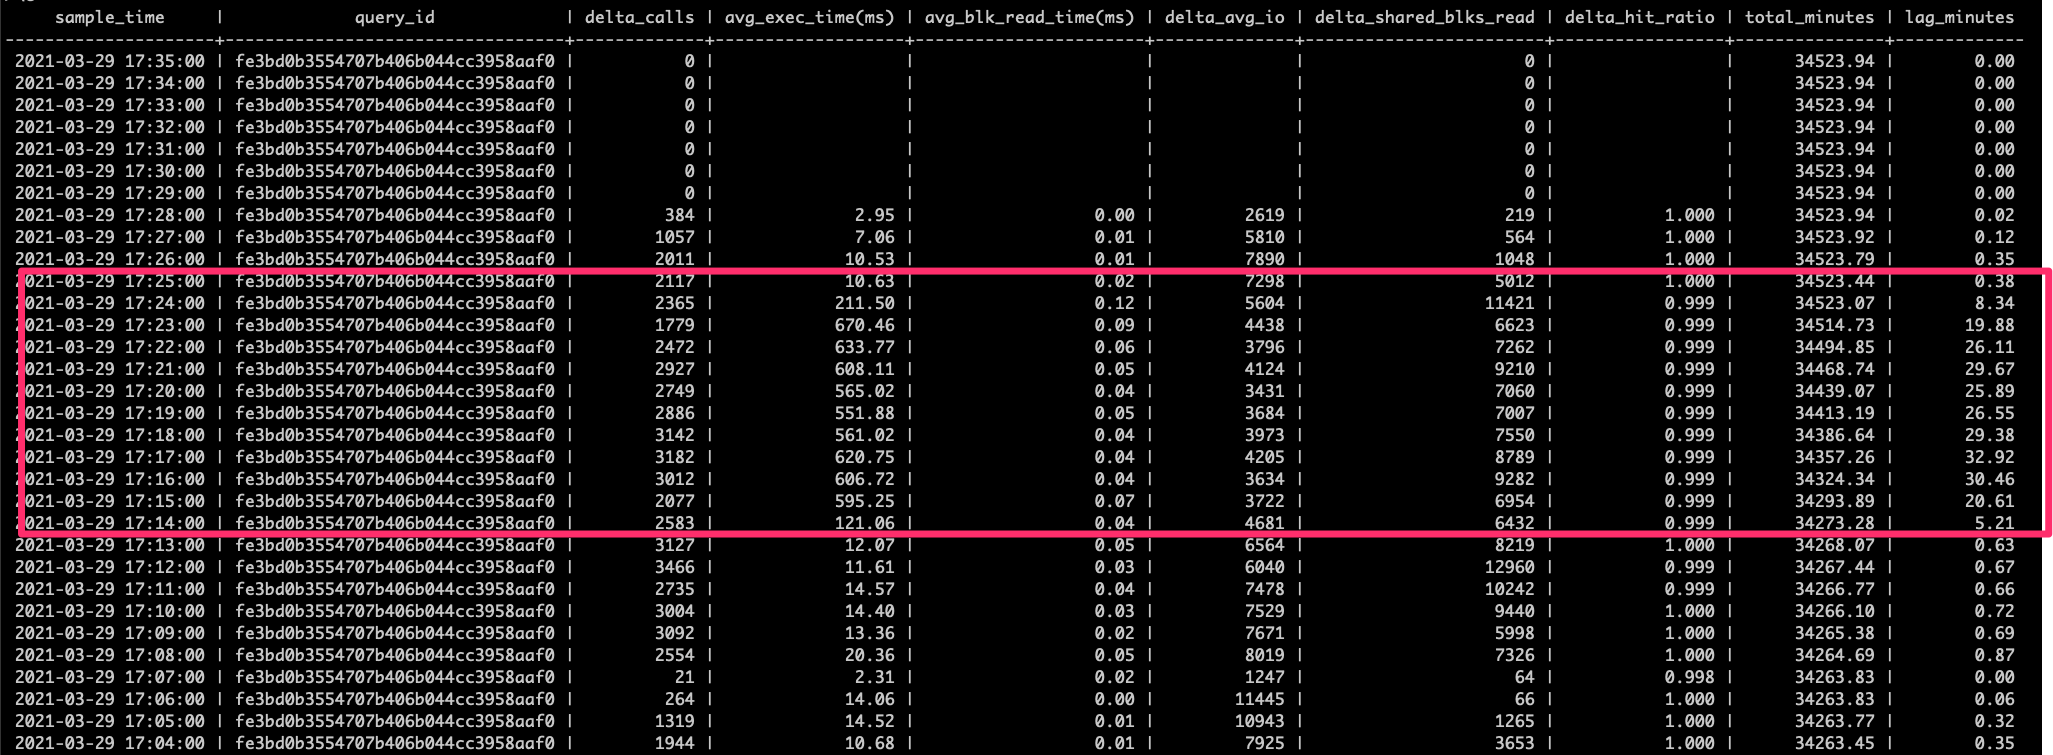
Finally, when the bottleneck occurs queries that normally run in low double digit milliseconds degrade into triple digit milliseconds worth of execution time. Here’s an example query showing the average execution time degradation. The query is a simple two table join with the leading table being accessed by primary key.
All of this feels like the postmaster threads that are in an active state but sleeping at the kernel level are in a sleep/retry cycle waiting on a resource. The challenge is that we have no idea what resource postgres is waiting on because we see no wait events in pg_stat_activity for these active sessions.
Any ideas on what we could look at to understand this behavior would be appreciated.
Regards,
Craig Jackson
We are trying to gain some insight into a performance bottleneck that we are hitting while load testing Postgres on 11.11. We are running in a GCP environment on a server with 244 vcpu's
In our testing active sessions are running fine and then we hit a hockey stick where active sessions spike way up but we don’t see a corresponding increase in CPU utlization on the server.
Here’s a grafana graph of the pg_stat_activity sessions states.
CPU utilization is not close to maximum when this event occurs with the server CPU utilization being 2/3 idle. Here’s a quick look at dstat output when the bottleneck occurs:
What has us stumped is that while we have a lot of sessions in an active state when we sample the postmaster threads with a Linux process profiling tool we see that many of the postmaster process threads are in a sleep state on the wait channel “poll schedule timeout” and only a fraction of what the database considers to be active sessions are actually running on the CPU. Here’s what we see in the profiler.
If we drill down into the postmaster threads that are sleeping we can verify that these threads are truly in a postgres select statement and waiting on a kernel stack backtrace of "system_call_fastpath()->SyS_select()->core_sys_select()->do_select()->poll_schedule_timeout()"
Finally, when the bottleneck occurs queries that normally run in low double digit milliseconds degrade into triple digit milliseconds worth of execution time. Here’s an example query showing the average execution time degradation. The query is a simple two table join with the leading table being accessed by primary key.
All of this feels like the postmaster threads that are in an active state but sleeping at the kernel level are in a sleep/retry cycle waiting on a resource. The challenge is that we have no idea what resource postgres is waiting on because we see no wait events in pg_stat_activity for these active sessions.
Any ideas on what we could look at to understand this behavior would be appreciated.
Regards,
Craig Jackson
Attachment
Re: Performance bottleneck. High active sessions but postmaster kernel threads are in a sleep state, low CPU utilization
From
Laurenz Albe
Date:
On Tue, 2021-03-30 at 12:22 -0600, Hotmail wrote:
> We are trying to gain some insight into a performance bottleneck that we are hitting while load testing Postgres on
11.11.
> [hundreds of active sessions, but CPU is not maxed out]

With that many active sessions you are probably hitting some contention inside
the database.  Look at "wait_event" and "wait_event_type" in pg_stat_activity.

Yours,
Laurenz Albe
--
Cybertec | https://www.cybertec-postgresql.com
Re: Performance bottleneck. High active sessions but postmaster kernel threads are in a sleep state, low CPU utilization
From
MichaelDBA
Date:
Hi,
You showed a lot of detail from the operating system perspective, but nothing from pg_stat_activity or pg_locks during those contention times where the cpu is low but lot of concurrent activity in the database.
I would guess that there is a lot of lightweight and/or spinlocks going on. This activity usually occurs when there appears to be no heavy cpu activity, no cpu io wait activity, but the db is being hit big time with a bunch of concurrent active connections contending over the same resources as Laurenz mentioned.
You can identify lightweight locks/spinlocks with the general wait type: wait_event_type = LWLock. The wait_event column will drill down even further. You can also help yourself by installing and using pg_wait_sampling extension. Because locks come and go so fast in pg_stat_activity, this historical perspective from the sampling extension may provide a better picture.
https://github.com/postgrespro/pg_wait_sampling
Regards,
Michael Vitale
Laurenz Albe wrote on 3/31/2021 5:47 AM:
On Tue, 2021-03-30 at 12:22 -0600, Hotmail wrote:We are trying to gain some insight into a performance bottleneck that we are hitting while load testing Postgres on 11.11. [hundreds of active sessions, but CPU is not maxed out]With that many active sessions you are probably hitting some contention inside the database. Look at "wait_event" and "wait_event_type" in pg_stat_activity. Yours, Laurenz Albe
Re: Performance bottleneck. High active sessions but postmaster kernel threads are in a sleep state, low CPU utilization
From
Hotmail
Date:
Unfortunately, the wait_event and wait_event_type columns are all NULL for these active sessions.
Craig
On Mar 31, 2021, 3:47 AM -0600, Laurenz Albe <laurenz.albe@cybertec.at>, wrote:
On Tue, 2021-03-30 at 12:22 -0600, Hotmail wrote:We are trying to gain some insight into a performance bottleneck that we are hitting while load testing Postgres on 11.11.
[hundreds of active sessions, but CPU is not maxed out]
With that many active sessions you are probably hitting some contention inside
the database.  Look at "wait_event" and "wait_event_type" in pg_stat_activity.

Yours,
Laurenz Albe
--
Cybertec | https://www.cybertec-postgresql.com
Re: Performance bottleneck. High active sessions but postmaster kernel threads are in a sleep state, low CPU utilization
From
Hotmail
Date:
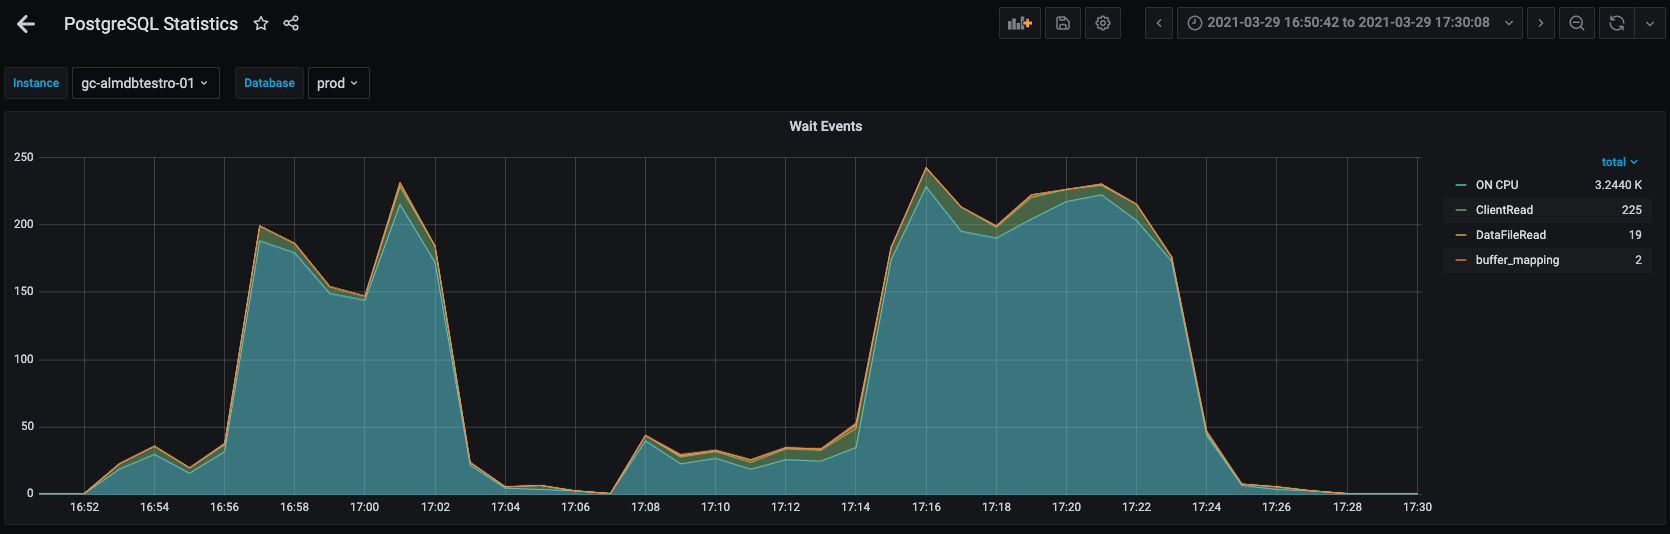
We actually keep track of the wait events in another grafana graph. We use the following query to generate the graph. (We assume that an active session that has a NULL wait_event is "ON CPU”. Not sure if our assuming an active session with a null wait being on cpu is valid. We sample pg_stat_activity every 30 seconds.
SELECT
coalesce(wait_event, 'ON CPU') AS type,
count(*)
FROM
pg_stat_activity
WHERE
state = 'active'
AND usename != 'repmgr'
GROUP BY
TYPE
ORDER BY
count(*) DESC ";
Here’s a sample from our wait_event graph during times when we see high active sessions but a sleeping postgres OS process. Is it possible we could be hitting an un-instremented wait event?
Craig
On Mar 31, 2021, 10:00 AM -0600, Hotmail <crajac66@hotmail.com>, wrote:
Unfortunately, the wait_event and wait_event_type columns are all NULL for these active sessions.CraigOn Mar 31, 2021, 3:47 AM -0600, Laurenz Albe <laurenz.albe@cybertec.at>, wrote:On Tue, 2021-03-30 at 12:22 -0600, Hotmail wrote:We are trying to gain some insight into a performance bottleneck that we are hitting while load testing Postgres on 11.11.
[hundreds of active sessions, but CPU is not maxed out]
With that many active sessions you are probably hitting some contention inside
the database. Look at "wait_event" and "wait_event_type" in pg_stat_activity.
Yours,
Laurenz Albe
--
Cybertec | https://www.cybertec-postgresql.com
Attachment
Re: Performance bottleneck. High active sessions but postmaster kernel threads are in a sleep state, low CPU utilization
From
Hotmail
Date:
To complete the picture here is our grafana graph on locks. The only locks we see are access share locks.

Craig
On Mar 31, 2021, 10:22 AM -0600, Hotmail <crajac66@hotmail.com>, wrote:
We actually keep track of the wait events in another grafana graph. We use the following query to generate the graph. (We assume that an active session that has a NULL wait_event is "ON CPU”. Not sure if our assuming an active session with a null wait being on cpu is valid. We sample pg_stat_activity every 30 seconds.
SELECT
coalesce(wait_event, 'ON CPU') AS type,
count(*)
FROM
pg_stat_activity
WHERE
state = 'active'
AND usename != 'repmgr'
GROUP BY
TYPE
ORDER BY
count(*) DESC ";
Here’s a sample from our wait_event graph during times when we see high active sessions but a sleeping postgres OS process. Is it possible we could be hitting an un-instremented wait event?
<Screen Shot 2021-03-31 at 10.18.01 AM.png>CraigOn Mar 31, 2021, 10:00 AM -0600, Hotmail <crajac66@hotmail.com>, wrote:Unfortunately, the wait_event and wait_event_type columns are all NULL for these active sessions.CraigOn Mar 31, 2021, 3:47 AM -0600, Laurenz Albe <laurenz.albe@cybertec.at>, wrote:On Tue, 2021-03-30 at 12:22 -0600, Hotmail wrote:We are trying to gain some insight into a performance bottleneck that we are hitting while load testing Postgres on 11.11.
[hundreds of active sessions, but CPU is not maxed out]
With that many active sessions you are probably hitting some contention inside
the database. Look at "wait_event" and "wait_event_type" in pg_stat_activity.
Yours,
Laurenz Albe
--
Cybertec | https://www.cybertec-postgresql.com
Attachment
Re: Performance bottleneck. High active sessions but postmaster kernel threads are in a sleep state, low CPU utilization
From
Hotmail
Date:
An additional data point is that this database is a streaming read-only replica. We do not see a corresponding spike in active sessions on the primary (15 active sessions) when the replica active sessions spike. No locks or wait events are observable in the primary when the replica active sessions spike.
Craig
On Mar 31, 2021, 10:26 AM -0600, Hotmail <crajac66@hotmail.com>, wrote:
To complete the picture here is our grafana graph on locks. The only locks we see are access share locks.
<Screen Shot 2021-03-31 at 10.23.30 AM.png>CraigOn Mar 31, 2021, 10:22 AM -0600, Hotmail <crajac66@hotmail.com>, wrote:We actually keep track of the wait events in another grafana graph. We use the following query to generate the graph. (We assume that an active session that has a NULL wait_event is "ON CPU”. Not sure if our assuming an active session with a null wait being on cpu is valid. We sample pg_stat_activity every 30 seconds.
SELECT
coalesce(wait_event, 'ON CPU') AS type,
count(*)
FROM
pg_stat_activity
WHERE
state = 'active'
AND usename != 'repmgr'
GROUP BY
TYPE
ORDER BY
count(*) DESC ";
Here’s a sample from our wait_event graph during times when we see high active sessions but a sleeping postgres OS process. Is it possible we could be hitting an un-instremented wait event?
<Screen Shot 2021-03-31 at 10.18.01 AM.png>CraigOn Mar 31, 2021, 10:00 AM -0600, Hotmail <crajac66@hotmail.com>, wrote:Unfortunately, the wait_event and wait_event_type columns are all NULL for these active sessions.CraigOn Mar 31, 2021, 3:47 AM -0600, Laurenz Albe <laurenz.albe@cybertec.at>, wrote:On Tue, 2021-03-30 at 12:22 -0600, Hotmail wrote:We are trying to gain some insight into a performance bottleneck that we are hitting while load testing Postgres on 11.11.
[hundreds of active sessions, but CPU is not maxed out]
With that many active sessions you are probably hitting some contention inside
the database. Look at "wait_event" and "wait_event_type" in pg_stat_activity.
Yours,
Laurenz Albe
--
Cybertec | https://www.cybertec-postgresql.com