Thread: Two identical systems, radically different performance
This is driving me crazy. A new server, virtually identical to an old one, has 50% of the performance with pgbench. I've checked everything I can think of.
The setups (call the servers "old" and "new"):
old: 2 x 4-core Intel Xeon E5620
new: 4 x 4-core Intel Xeon E5606
both:
memory: 12 GB DDR EC
Disks: 12x500GB disks (Western Digital 7200RPM SATA)
2 disks, RAID1: OS (ext4) and postgres xlog (ext2)
8 disks, RAID10: $PGDATA
3WARE 9650SE-12ML with battery-backed cache. The admin tool (tw_cli)
indicates that the battery is charged and the cache is working on both units.
Linux: 2.6.32-41-server #94-Ubuntu SMP (new server's disk was
actually cloned from old server).
Postgres: 8.4.4 (yes, I should update. But both are identical.)
The postgres.conf files are identical; diffs from the original are:
max_connections = 500
shared_buffers = 1000MB
work_mem = 128MB
synchronous_commit = off
full_page_writes = off
wal_buffers = 256kB
checkpoint_segments = 30
effective_cache_size = 4GB
track_activities = on
track_counts = on
track_functions = none
autovacuum = on
autovacuum_naptime = 5min
escape_string_warning = off
Note that the old server is in production and was serving a light load while this test was running, so in theory it should be slower, not faster, than the new server.
pgbench: Old server
pgbench -i -s 100 -U test
pgbench -U test -c ... -t ...
-c -t TPS
5 20000 3777
10 10000 2622
20 5000 3759
30 3333 5712
40 2500 5953
50 2000 6141
New server
-c -t TPS
5 20000 2733
10 10000 2783
20 5000 3241
30 3333 2987
40 2500 2739
50 2000 2119
As you can see, the new server is dramatically slower than the old one.
I tested both the RAID10 data disk and the RAID1 xlog disk with bonnie++. The xlog disks were almost identical in performance. The RAID10 pg-data disks looked like this:
Old server:
Version 1.96 ------Sequential Output------ --Sequential Input- --Random-
Concurrency 1 -Per Chr- --Block-- -Rewrite- -Per Chr- --Block-- --Seeks--
Machine Size K/sec %CP K/sec %CP K/sec %CP K/sec %CP K/sec %CP /sec %CP
xenon 24064M 687 99 203098 26 81904 16 3889 96 403747 31 737.6 31
Latency 20512us 469ms 394ms 21402us 396ms 112ms
Version 1.96 ------Sequential Create------ --------Random Create--------
xenon -Create-- --Read--- -Delete-- -Create-- --Read--- -Delete--
files /sec %CP /sec %CP /sec %CP /sec %CP /sec %CP /sec %CP
16 15953 27 +++++ +++ +++++ +++ +++++ +++ +++++ +++ +++++ +++
Latency 43291us 857us 519us 1588us 37us 178us
1.96,1.96,xenon,1,1349726125,24064M,,687,99,203098,26,81904,16,3889,96,403747,31,737.6,31,16,,,,,15953,27,+++++,+++,+++++,++\
+,+++++,+++,+++++,+++,+++++,+++,20512us,469ms,394ms,21402us,396ms,112ms,43291us,857us,519us,1588us,37us,178us
New server:
Version 1.96 ------Sequential Output------ --Sequential Input- --Random-
Concurrency 1 -Per Chr- --Block-- -Rewrite- -Per Chr- --Block-- --Seeks--
Machine Size K/sec %CP K/sec %CP K/sec %CP K/sec %CP K/sec %CP /sec %CP
zinc 24064M 862 99 212143 54 96008 14 4921 99 279239 17 752.0 23
Latency 15613us 598ms 597ms 2764us 398ms 215ms
Version 1.96 ------Sequential Create------ --------Random Create--------
zinc -Create-- --Read--- -Delete-- -Create-- --Read--- -Delete--
files /sec %CP /sec %CP /sec %CP /sec %CP /sec %CP /sec %CP
16 20380 26 +++++ +++ +++++ +++ +++++ +++ +++++ +++ +++++ +++
Latency 487us 627us 407us 972us 29us 262us
1.96,1.96,zinc,1,1349722017,24064M,,862,99,212143,54,96008,14,4921,99,279239,17,752.0,23,16,,,,,20380,26,+++++,+++,+++++,+++\
,+++++,+++,+++++,+++,+++++,+++,15613us,598ms,597ms,2764us,398ms,215ms,487us,627us,407us,972us,29us,262us
I don't know enough about bonnie++ to know if these differences are interesting.
One dramatic difference I noted via vmstat. On the old server, the I/O load during the bonnie++ run was steady, like this:
procs -----------memory---------- ---swap-- -----io---- -system-- ----cpu----
r b swpd free buff cache si so bi bo in cs us sy id wa
r b swpd free buff cache si so bi bo in cs us sy id wa
0 2 71800 2117612 17940 9375660 0 0 82948 81944 1992 1341 1 3 86 10
0 2 71800 2113328 17948 9383896 0 0 76288 75806 1751 1167 0 2 86 11
0 1 71800 2111004 17948 9386540 92 0 93324 94232 2230 1510 0 4 86 10
0 1 71800 2106796 17948 9387436 114 0 67698 67588 1572 1088 0 2 87 11
0 1 71800 2106724 17956 9387968 50 0 81970 85710 1918 1287 0 3 86 10
1 1 71800 2103304 17956 9390700 0 0 92096 92160 1970 1194 0 4 86 10
0 2 71800 2103196 17976 9389204 0 0 70722 69680 1655 1116 1 3 86 10
1 1 71800 2099064 17980 9390824 0 0 57346 57348 1357 949 0 2 87 11
0 1 71800 2095596 17980 9392720 0 0 57344 57348 1379 987 0 2 86 12
But the new server varied wildly during bonnie++:
procs -----------memory---------- ---swap-- -----io---- -system-- ----cpu----
r b swpd free buff cache si so bi bo in cs us sy id wa
0 1 0 4518352 12004 7167000 0 0 118894 120838 2613 1539 0 2 93 5
0 1 0 4517252 12004 7167824 0 0 52116 53248 1179 793 0 1 94 5
0 1 0 4515864 12004 7169088 0 0 46764 49152 1104 733 0 1 91 7
0 1 0 4515180 12012 7169764 0 0 32924 30724 750 542 0 1 93 6
0 1 0 4514328 12016 7170780 0 0 42188 45056 1019 664 0 1 90 9
0 1 0 4513072 12016 7171856 0 0 67528 65540 1487 993 0 1 96 4
0 1 0 4510852 12016 7173160 0 0 56876 57344 1358 942 0 1 94 5
0 1 0 4500280 12044 7179924 0 0 91564 94220 2505 2504 1 2 91 6
0 1 0 4495564 12052 7183492 0 0 102660 104452 2289 1473 0 2 92 6
0 1 0 4492092 12052 7187720 0 0 98498 96274 2140 1385 0 2 93 5
0 1 0 4488608 12060 7190772 0 0 97628 100358 2176 1398 0 1 94 4
1 0 0 4485880 12052 7192600 0 0 112406 114686 2461 1509 0 3 90 7
1 0 0 4483424 12052 7195612 0 0 64678 65536 1449 948 0 1 91 8
0 1 0 4480252 12052 7199404 0 0 99608 100356 2217 1452 0 1 96 3
Any ideas where to look next would be greatly appreciated.
Craig
On Oct 9, 2012, at 1:45 AM, Craig James <cjames@emolecules.com> wrote:
This is driving me crazy. A new server, virtually identical to an old one, has 50% of the performance with pgbench. I've checked everything I can think of.
The setups (call the servers "old" and "new"):
old: 2 x 4-core Intel Xeon E5620
new: 4 x 4-core Intel Xeon E5606
both:
memory: 12 GB DDR EC
Disks: 12x500GB disks (Western Digital 7200RPM SATA)
2 disks, RAID1: OS (ext4) and postgres xlog (ext2)
8 disks, RAID10: $PGDATA
3WARE 9650SE-12ML with battery-backed cache. The admin tool (tw_cli)
indicates that the battery is charged and the cache is working on both units.
Linux: 2.6.32-41-server #94-Ubuntu SMP (new server's disk was
actually cloned from old server).
Postgres: 8.4.4 (yes, I should update. But both are identical.)
The postgres.conf files are identical; diffs from the original are:
max_connections = 500
shared_buffers = 1000MB
work_mem = 128MB
synchronous_commit = off
full_page_writes = off
wal_buffers = 256kB
checkpoint_segments = 30
effective_cache_size = 4GB
track_activities = on
track_counts = on
track_functions = none
autovacuum = on
autovacuum_naptime = 5min
escape_string_warning = off
Note that the old server is in production and was serving a light load while this test was running, so in theory it should be slower, not faster, than the new server.
pgbench: Old server
pgbench -i -s 100 -U test
pgbench -U test -c ... -t ...
-c -t TPS
5 20000 3777
10 10000 2622
20 5000 3759
30 3333 5712
40 2500 5953
50 2000 6141
New server
-c -t TPS
5 20000 2733
10 10000 2783
20 5000 3241
30 3333 2987
40 2500 2739
50 2000 2119
As you can see, the new server is dramatically slower than the old one.
I tested both the RAID10 data disk and the RAID1 xlog disk with bonnie++. The xlog disks were almost identical in performance. The RAID10 pg-data disks looked like this:
Old server:
Version 1.96 ------Sequential Output------ --Sequential Input- --Random-
Concurrency 1 -Per Chr- --Block-- -Rewrite- -Per Chr- --Block-- --Seeks--
Machine Size K/sec %CP K/sec %CP K/sec %CP K/sec %CP K/sec %CP /sec %CP
xenon 24064M 687 99 203098 26 81904 16 3889 96 403747 31 737.6 31
Latency 20512us 469ms 394ms 21402us 396ms 112ms
Version 1.96 ------Sequential Create------ --------Random Create--------
xenon -Create-- --Read--- -Delete-- -Create-- --Read--- -Delete--
files /sec %CP /sec %CP /sec %CP /sec %CP /sec %CP /sec %CP
16 15953 27 +++++ +++ +++++ +++ +++++ +++ +++++ +++ +++++ +++
Latency 43291us 857us 519us 1588us 37us 178us
1.96,1.96,xenon,1,1349726125,24064M,,687,99,203098,26,81904,16,3889,96,403747,31,737.6,31,16,,,,,15953,27,+++++,+++,+++++,++\
+,+++++,+++,+++++,+++,+++++,+++,20512us,469ms,394ms,21402us,396ms,112ms,43291us,857us,519us,1588us,37us,178us
New server:
Version 1.96 ------Sequential Output------ --Sequential Input- --Random-
Concurrency 1 -Per Chr- --Block-- -Rewrite- -Per Chr- --Block-- --Seeks--
Machine Size K/sec %CP K/sec %CP K/sec %CP K/sec %CP K/sec %CP /sec %CP
zinc 24064M 862 99 212143 54 96008 14 4921 99 279239 17 752.0 23
Latency 15613us 598ms 597ms 2764us 398ms 215ms
Version 1.96 ------Sequential Create------ --------Random Create--------
zinc -Create-- --Read--- -Delete-- -Create-- --Read--- -Delete--
files /sec %CP /sec %CP /sec %CP /sec %CP /sec %CP /sec %CP
16 20380 26 +++++ +++ +++++ +++ +++++ +++ +++++ +++ +++++ +++
Latency 487us 627us 407us 972us 29us 262us
1.96,1.96,zinc,1,1349722017,24064M,,862,99,212143,54,96008,14,4921,99,279239,17,752.0,23,16,,,,,20380,26,+++++,+++,+++++,+++\
,+++++,+++,+++++,+++,+++++,+++,15613us,598ms,597ms,2764us,398ms,215ms,487us,627us,407us,972us,29us,262us
Sequential Input on the new one is 279MB/s, on the old 400MB/s.
I don't know enough about bonnie++ to know if these differences are interesting.
One dramatic difference I noted via vmstat. On the old server, the I/O load during the bonnie++ run was steady, like this:
procs -----------memory---------- ---swap-- -----io---- -system-- ----cpu----
r b swpd free buff cache si so bi bo in cs us sy id wa
r b swpd free buff cache si so bi bo in cs us sy id wa
0 2 71800 2117612 17940 9375660 0 0 82948 81944 1992 1341 1 3 86 10
0 2 71800 2113328 17948 9383896 0 0 76288 75806 1751 1167 0 2 86 11
0 1 71800 2111004 17948 9386540 92 0 93324 94232 2230 1510 0 4 86 10
0 1 71800 2106796 17948 9387436 114 0 67698 67588 1572 1088 0 2 87 11
0 1 71800 2106724 17956 9387968 50 0 81970 85710 1918 1287 0 3 86 10
1 1 71800 2103304 17956 9390700 0 0 92096 92160 1970 1194 0 4 86 10
0 2 71800 2103196 17976 9389204 0 0 70722 69680 1655 1116 1 3 86 10
1 1 71800 2099064 17980 9390824 0 0 57346 57348 1357 949 0 2 87 11
0 1 71800 2095596 17980 9392720 0 0 57344 57348 1379 987 0 2 86 12
But the new server varied wildly during bonnie++:
procs -----------memory---------- ---swap-- -----io---- -system-- ----cpu----
r b swpd free buff cache si so bi bo in cs us sy id wa
0 1 0 4518352 12004 7167000 0 0 118894 120838 2613 1539 0 2 93 5
0 1 0 4517252 12004 7167824 0 0 52116 53248 1179 793 0 1 94 5
0 1 0 4515864 12004 7169088 0 0 46764 49152 1104 733 0 1 91 7
0 1 0 4515180 12012 7169764 0 0 32924 30724 750 542 0 1 93 6
0 1 0 4514328 12016 7170780 0 0 42188 45056 1019 664 0 1 90 9
0 1 0 4513072 12016 7171856 0 0 67528 65540 1487 993 0 1 96 4
0 1 0 4510852 12016 7173160 0 0 56876 57344 1358 942 0 1 94 5
0 1 0 4500280 12044 7179924 0 0 91564 94220 2505 2504 1 2 91 6
0 1 0 4495564 12052 7183492 0 0 102660 104452 2289 1473 0 2 92 6
0 1 0 4492092 12052 7187720 0 0 98498 96274 2140 1385 0 2 93 5
0 1 0 4488608 12060 7190772 0 0 97628 100358 2176 1398 0 1 94 4
1 0 0 4485880 12052 7192600 0 0 112406 114686 2461 1509 0 3 90 7
1 0 0 4483424 12052 7195612 0 0 64678 65536 1449 948 0 1 91 8
0 1 0 4480252 12052 7199404 0 0 99608 100356 2217 1452 0 1 96 3
Any ideas where to look next would be greatly appreciated.
Craig
On Mon, Oct 8, 2012 at 2:57 PM, Evgeny Shishkin <itparanoia@gmail.com> wrote:
But why? What have I overlooked?
Thanks,
Craig
On Oct 9, 2012, at 1:45 AM, Craig James <cjames@emolecules.com> wrote:I tested both the RAID10 data disk and the RAID1 xlog disk with bonnie++. The xlog disks were almost identical in performance. The RAID10 pg-data disks looked like this:
Old server:
Version 1.96 ------Sequential Output------ --Sequential Input- --Random-
Concurrency 1 -Per Chr- --Block-- -Rewrite- -Per Chr- --Block-- --Seeks--
Machine Size K/sec %CP K/sec %CP K/sec %CP K/sec %CP K/sec %CP /sec %CP
xenon 24064M 687 99 203098 26 81904 16 3889 96 403747 31 737.6 31
Latency 20512us 469ms 394ms 21402us 396ms 112ms
Version 1.96 ------Sequential Create------ --------Random Create--------
xenon -Create-- --Read--- -Delete-- -Create-- --Read--- -Delete--
files /sec %CP /sec %CP /sec %CP /sec %CP /sec %CP /sec %CP
16 15953 27 +++++ +++ +++++ +++ +++++ +++ +++++ +++ +++++ +++
Latency 43291us 857us 519us 1588us 37us 178us
1.96,1.96,xenon,1,1349726125,24064M,,687,99,203098,26,81904,16,3889,96,403747,31,737.6,31,16,,,,,15953,27,+++++,+++,+++++,++\
+,+++++,+++,+++++,+++,+++++,+++,20512us,469ms,394ms,21402us,396ms,112ms,43291us,857us,519us,1588us,37us,178us
New server:
Version 1.96 ------Sequential Output------ --Sequential Input- --Random-
Concurrency 1 -Per Chr- --Block-- -Rewrite- -Per Chr- --Block-- --Seeks--
Machine Size K/sec %CP K/sec %CP K/sec %CP K/sec %CP K/sec %CP /sec %CP
zinc 24064M 862 99 212143 54 96008 14 4921 99 279239 17 752.0 23
Latency 15613us 598ms 597ms 2764us 398ms 215ms
Version 1.96 ------Sequential Create------ --------Random Create--------
zinc -Create-- --Read--- -Delete-- -Create-- --Read--- -Delete--
files /sec %CP /sec %CP /sec %CP /sec %CP /sec %CP /sec %CP
16 20380 26 +++++ +++ +++++ +++ +++++ +++ +++++ +++ +++++ +++
Latency 487us 627us 407us 972us 29us 262us
1.96,1.96,zinc,1,1349722017,24064M,,862,99,212143,54,96008,14,4921,99,279239,17,752.0,23,16,,,,,20380,26,+++++,+++,+++++,+++\
,+++++,+++,+++++,+++,+++++,+++,15613us,598ms,597ms,2764us,398ms,215ms,487us,627us,407us,972us,29us,262usSequential Input on the new one is 279MB/s, on the old 400MB/s.
But why? What have I overlooked?
Thanks,
Craig
On Oct 9, 2012, at 2:06 AM, Craig James <cjames@emolecules.com> wrote:
On Mon, Oct 8, 2012 at 2:57 PM, Evgeny Shishkin <itparanoia@gmail.com> wrote:On Oct 9, 2012, at 1:45 AM, Craig James <cjames@emolecules.com> wrote:I tested both the RAID10 data disk and the RAID1 xlog disk with bonnie++. The xlog disks were almost identical in performance. The RAID10 pg-data disks looked like this:
Old server:
Version 1.96 ------Sequential Output------ --Sequential Input- --Random-
Concurrency 1 -Per Chr- --Block-- -Rewrite- -Per Chr- --Block-- --Seeks--
Machine Size K/sec %CP K/sec %CP K/sec %CP K/sec %CP K/sec %CP /sec %CP
xenon 24064M 687 99 203098 26 81904 16 3889 96 403747 31 737.6 31
Latency 20512us 469ms 394ms 21402us 396ms 112ms
Version 1.96 ------Sequential Create------ --------Random Create--------
xenon -Create-- --Read--- -Delete-- -Create-- --Read--- -Delete--
files /sec %CP /sec %CP /sec %CP /sec %CP /sec %CP /sec %CP
16 15953 27 +++++ +++ +++++ +++ +++++ +++ +++++ +++ +++++ +++
Latency 43291us 857us 519us 1588us 37us 178us
1.96,1.96,xenon,1,1349726125,24064M,,687,99,203098,26,81904,16,3889,96,403747,31,737.6,31,16,,,,,15953,27,+++++,+++,+++++,++\
+,+++++,+++,+++++,+++,+++++,+++,20512us,469ms,394ms,21402us,396ms,112ms,43291us,857us,519us,1588us,37us,178us
New server:
Version 1.96 ------Sequential Output------ --Sequential Input- --Random-
Concurrency 1 -Per Chr- --Block-- -Rewrite- -Per Chr- --Block-- --Seeks--
Machine Size K/sec %CP K/sec %CP K/sec %CP K/sec %CP K/sec %CP /sec %CP
zinc 24064M 862 99 212143 54 96008 14 4921 99 279239 17 752.0 23
Latency 15613us 598ms 597ms 2764us 398ms 215ms
Version 1.96 ------Sequential Create------ --------Random Create--------
zinc -Create-- --Read--- -Delete-- -Create-- --Read--- -Delete--
files /sec %CP /sec %CP /sec %CP /sec %CP /sec %CP /sec %CP
16 20380 26 +++++ +++ +++++ +++ +++++ +++ +++++ +++ +++++ +++
Latency 487us 627us 407us 972us 29us 262us
1.96,1.96,zinc,1,1349722017,24064M,,862,99,212143,54,96008,14,4921,99,279239,17,752.0,23,16,,,,,20380,26,+++++,+++,+++++,+++\
,+++++,+++,+++++,+++,+++++,+++,15613us,598ms,597ms,2764us,398ms,215ms,487us,627us,407us,972us,29us,262usSequential Input on the new one is 279MB/s, on the old 400MB/s.
But why? What have I overlooked?
Also you benchmarked volume for pgdata? Can you provide benchmarks for wal volume?
Thanks,
Craig
On Mon, Oct 8, 2012 at 7:06 PM, Craig James <cjames@emolecules.com> wrote:
>> Sequential Input on the new one is 279MB/s, on the old 400MB/s.
>>
>
> But why? What have I overlooked?

Do you have readahead properly set up on the new one?
On 10/08/2012 02:45 PM, Craig James wrote:
This is driving me crazy. A new server, virtually identical to an old one, has 50% of the performance with pgbench. I've checked everything I can think of.Exact same model of disk, same on-board cache, same RAID-card RAM size, same RAID strip-size, etc.??
The setups (call the servers "old" and "new"):
old: 2 x 4-core Intel Xeon E5620
new: 4 x 4-core Intel Xeon E5606
both:
memory: 12 GB DDR EC
Disks: 12x500GB disks (Western Digital 7200RPM SATA)
2 disks, RAID1: OS (ext4) and postgres xlog (ext2)
8 disks, RAID10: $PGDATA
Cheers,
Steve
On Mon, Oct 8, 2012 at 3:09 PM, Claudio Freire <klaussfreire@gmail.com> wrote:
On Mon, Oct 8, 2012 at 7:06 PM, Craig James <cjames@emolecules.com> wrote:
>> Sequential Input on the new one is 279MB/s, on the old 400MB/s.
>>
>
> But why? What have I overlooked?
Do you have readahead properly set up on the new one?
# blockdev --getra /dev/sdb1
256
Same on both servers.
Thanks,
Craig
>old: 2 x 4-core Intel Xeon E5620
>new: 4 x 4-core Intel Xeon E5606
old: Xeon E5620 : 4 cores ; 8 Threads ; Clock Speed : 2.40 GHz ; Max Turbo Frequency: 2.66 GHz
new: Xeon E5606 : 4 cores ; 4 Threads ; Clock Speed : 2.13 GHz ; Max Turbo Frequency: -
the older processor maybe faster ;
Imre
2012/10/8 Craig James <cjames@emolecules.com>
This is driving me crazy. A new server, virtually identical to an old one, has 50% of the performance with pgbench. I've checked everything I can think of.
The setups (call the servers "old" and "new"):
old: 2 x 4-core Intel Xeon E5620
new: 4 x 4-core Intel Xeon E5606
both:
memory: 12 GB DDR EC
Disks: 12x500GB disks (Western Digital 7200RPM SATA)
2 disks, RAID1: OS (ext4) and postgres xlog (ext2)
8 disks, RAID10: $PGDATA
3WARE 9650SE-12ML with battery-backed cache. The admin tool (tw_cli)
indicates that the battery is charged and the cache is working on both units.
Linux: 2.6.32-41-server #94-Ubuntu SMP (new server's disk was
actually cloned from old server).
Postgres: 8.4.4 (yes, I should update. But both are identical.)
The postgres.conf files are identical; diffs from the original are:
max_connections = 500
shared_buffers = 1000MB
work_mem = 128MB
synchronous_commit = off
full_page_writes = off
wal_buffers = 256kB
checkpoint_segments = 30
effective_cache_size = 4GB
track_activities = on
track_counts = on
track_functions = none
autovacuum = on
autovacuum_naptime = 5min
escape_string_warning = off
Note that the old server is in production and was serving a light load while this test was running, so in theory it should be slower, not faster, than the new server.
pgbench: Old server
pgbench -i -s 100 -U test
pgbench -U test -c ... -t ...
-c -t TPS
5 20000 3777
10 10000 2622
20 5000 3759
30 3333 5712
40 2500 5953
50 2000 6141
New server
-c -t TPS
5 20000 2733
10 10000 2783
20 5000 3241
30 3333 2987
40 2500 2739
50 2000 2119
As you can see, the new server is dramatically slower than the old one.
I tested both the RAID10 data disk and the RAID1 xlog disk with bonnie++. The xlog disks were almost identical in performance. The RAID10 pg-data disks looked like this:
Old server:
Version 1.96 ------Sequential Output------ --Sequential Input- --Random-
Concurrency 1 -Per Chr- --Block-- -Rewrite- -Per Chr- --Block-- --Seeks--
Machine Size K/sec %CP K/sec %CP K/sec %CP K/sec %CP K/sec %CP /sec %CP
xenon 24064M 687 99 203098 26 81904 16 3889 96 403747 31 737.6 31
Latency 20512us 469ms 394ms 21402us 396ms 112ms
Version 1.96 ------Sequential Create------ --------Random Create--------
xenon -Create-- --Read--- -Delete-- -Create-- --Read--- -Delete--
files /sec %CP /sec %CP /sec %CP /sec %CP /sec %CP /sec %CP
16 15953 27 +++++ +++ +++++ +++ +++++ +++ +++++ +++ +++++ +++
Latency 43291us 857us 519us 1588us 37us 178us
1.96,1.96,xenon,1,1349726125,24064M,,687,99,203098,26,81904,16,3889,96,403747,31,737.6,31,16,,,,,15953,27,+++++,+++,+++++,++\
+,+++++,+++,+++++,+++,+++++,+++,20512us,469ms,394ms,21402us,396ms,112ms,43291us,857us,519us,1588us,37us,178us
New server:
Version 1.96 ------Sequential Output------ --Sequential Input- --Random-
Concurrency 1 -Per Chr- --Block-- -Rewrite- -Per Chr- --Block-- --Seeks--
Machine Size K/sec %CP K/sec %CP K/sec %CP K/sec %CP K/sec %CP /sec %CP
zinc 24064M 862 99 212143 54 96008 14 4921 99 279239 17 752.0 23
Latency 15613us 598ms 597ms 2764us 398ms 215ms
Version 1.96 ------Sequential Create------ --------Random Create--------
zinc -Create-- --Read--- -Delete-- -Create-- --Read--- -Delete--
files /sec %CP /sec %CP /sec %CP /sec %CP /sec %CP /sec %CP
16 20380 26 +++++ +++ +++++ +++ +++++ +++ +++++ +++ +++++ +++
Latency 487us 627us 407us 972us 29us 262us
1.96,1.96,zinc,1,1349722017,24064M,,862,99,212143,54,96008,14,4921,99,279239,17,752.0,23,16,,,,,20380,26,+++++,+++,+++++,+++\
,+++++,+++,+++++,+++,+++++,+++,15613us,598ms,597ms,2764us,398ms,215ms,487us,627us,407us,972us,29us,262us
I don't know enough about bonnie++ to know if these differences are interesting.
One dramatic difference I noted via vmstat. On the old server, the I/O load during the bonnie++ run was steady, like this:
procs -----------memory---------- ---swap-- -----io---- -system-- ----cpu----
r b swpd free buff cache si so bi bo in cs us sy id wa
r b swpd free buff cache si so bi bo in cs us sy id wa
0 2 71800 2117612 17940 9375660 0 0 82948 81944 1992 1341 1 3 86 10
0 2 71800 2113328 17948 9383896 0 0 76288 75806 1751 1167 0 2 86 11
0 1 71800 2111004 17948 9386540 92 0 93324 94232 2230 1510 0 4 86 10
0 1 71800 2106796 17948 9387436 114 0 67698 67588 1572 1088 0 2 87 11
0 1 71800 2106724 17956 9387968 50 0 81970 85710 1918 1287 0 3 86 10
1 1 71800 2103304 17956 9390700 0 0 92096 92160 1970 1194 0 4 86 10
0 2 71800 2103196 17976 9389204 0 0 70722 69680 1655 1116 1 3 86 10
1 1 71800 2099064 17980 9390824 0 0 57346 57348 1357 949 0 2 87 11
0 1 71800 2095596 17980 9392720 0 0 57344 57348 1379 987 0 2 86 12
But the new server varied wildly during bonnie++:
procs -----------memory---------- ---swap-- -----io---- -system-- ----cpu----
r b swpd free buff cache si so bi bo in cs us sy id wa
0 1 0 4518352 12004 7167000 0 0 118894 120838 2613 1539 0 2 93 5
0 1 0 4517252 12004 7167824 0 0 52116 53248 1179 793 0 1 94 5
0 1 0 4515864 12004 7169088 0 0 46764 49152 1104 733 0 1 91 7
0 1 0 4515180 12012 7169764 0 0 32924 30724 750 542 0 1 93 6
0 1 0 4514328 12016 7170780 0 0 42188 45056 1019 664 0 1 90 9
0 1 0 4513072 12016 7171856 0 0 67528 65540 1487 993 0 1 96 4
0 1 0 4510852 12016 7173160 0 0 56876 57344 1358 942 0 1 94 5
0 1 0 4500280 12044 7179924 0 0 91564 94220 2505 2504 1 2 91 6
0 1 0 4495564 12052 7183492 0 0 102660 104452 2289 1473 0 2 92 6
0 1 0 4492092 12052 7187720 0 0 98498 96274 2140 1385 0 2 93 5
0 1 0 4488608 12060 7190772 0 0 97628 100358 2176 1398 0 1 94 4
1 0 0 4485880 12052 7192600 0 0 112406 114686 2461 1509 0 3 90 7
1 0 0 4483424 12052 7195612 0 0 64678 65536 1449 948 0 1 91 8
0 1 0 4480252 12052 7199404 0 0 99608 100356 2217 1452 0 1 96 3
Any ideas where to look next would be greatly appreciated.
Craig
One mistake in my descriptions...
On Mon, Oct 8, 2012 at 2:45 PM, Craig James <cjames@emolecules.com> wrote:
Actually it's not 16 cores. It's 8 cores, hyperthreaded. Hyperthreading is disabled on the old system.
Is that enough to make this radical difference? (The server is at a co-location site, so I have to go down there to boot into the BIOS and disable hyperthreading.)
Craig
This is driving me crazy. A new server, virtually identical to an old one, has 50% of the performance with pgbench. I've checked everything I can think of.
The setups (call the servers "old" and "new"):
old: 2 x 4-core Intel Xeon E5620
new: 4 x 4-core Intel Xeon E5606
Actually it's not 16 cores. It's 8 cores, hyperthreaded. Hyperthreading is disabled on the old system.
Is that enough to make this radical difference? (The server is at a co-location site, so I have to go down there to boot into the BIOS and disable hyperthreading.)
Craig
both:
memory: 12 GB DDR EC
Disks: 12x500GB disks (Western Digital 7200RPM SATA)
2 disks, RAID1: OS (ext4) and postgres xlog (ext2)
8 disks, RAID10: $PGDATA
3WARE 9650SE-12ML with battery-backed cache. The admin tool (tw_cli)
indicates that the battery is charged and the cache is working on both units.
Linux: 2.6.32-41-server #94-Ubuntu SMP (new server's disk was
actually cloned from old server).
Postgres: 8.4.4 (yes, I should update. But both are identical.)
The postgres.conf files are identical; diffs from the original are:
max_connections = 500
shared_buffers = 1000MB
work_mem = 128MB
synchronous_commit = off
full_page_writes = off
wal_buffers = 256kB
checkpoint_segments = 30
effective_cache_size = 4GB
track_activities = on
track_counts = on
track_functions = none
autovacuum = on
autovacuum_naptime = 5min
escape_string_warning = off
Note that the old server is in production and was serving a light load while this test was running, so in theory it should be slower, not faster, than the new server.
pgbench: Old server
pgbench -i -s 100 -U test
pgbench -U test -c ... -t ...
-c -t TPS
5 20000 3777
10 10000 2622
20 5000 3759
30 3333 5712
40 2500 5953
50 2000 6141
New server
-c -t TPS
5 20000 2733
10 10000 2783
20 5000 3241
30 3333 2987
40 2500 2739
50 2000 2119
As you can see, the new server is dramatically slower than the old one.
I tested both the RAID10 data disk and the RAID1 xlog disk with bonnie++. The xlog disks were almost identical in performance. The RAID10 pg-data disks looked like this:
Old server:
Version 1.96 ------Sequential Output------ --Sequential Input- --Random-
Concurrency 1 -Per Chr- --Block-- -Rewrite- -Per Chr- --Block-- --Seeks--
Machine Size K/sec %CP K/sec %CP K/sec %CP K/sec %CP K/sec %CP /sec %CP
xenon 24064M 687 99 203098 26 81904 16 3889 96 403747 31 737.6 31
Latency 20512us 469ms 394ms 21402us 396ms 112ms
Version 1.96 ------Sequential Create------ --------Random Create--------
xenon -Create-- --Read--- -Delete-- -Create-- --Read--- -Delete--
files /sec %CP /sec %CP /sec %CP /sec %CP /sec %CP /sec %CP
16 15953 27 +++++ +++ +++++ +++ +++++ +++ +++++ +++ +++++ +++
Latency 43291us 857us 519us 1588us 37us 178us
1.96,1.96,xenon,1,1349726125,24064M,,687,99,203098,26,81904,16,3889,96,403747,31,737.6,31,16,,,,,15953,27,+++++,+++,+++++,++\
+,+++++,+++,+++++,+++,+++++,+++,20512us,469ms,394ms,21402us,396ms,112ms,43291us,857us,519us,1588us,37us,178us
New server:
Version 1.96 ------Sequential Output------ --Sequential Input- --Random-
Concurrency 1 -Per Chr- --Block-- -Rewrite- -Per Chr- --Block-- --Seeks--
Machine Size K/sec %CP K/sec %CP K/sec %CP K/sec %CP K/sec %CP /sec %CP
zinc 24064M 862 99 212143 54 96008 14 4921 99 279239 17 752.0 23
Latency 15613us 598ms 597ms 2764us 398ms 215ms
Version 1.96 ------Sequential Create------ --------Random Create--------
zinc -Create-- --Read--- -Delete-- -Create-- --Read--- -Delete--
files /sec %CP /sec %CP /sec %CP /sec %CP /sec %CP /sec %CP
16 20380 26 +++++ +++ +++++ +++ +++++ +++ +++++ +++ +++++ +++
Latency 487us 627us 407us 972us 29us 262us
1.96,1.96,zinc,1,1349722017,24064M,,862,99,212143,54,96008,14,4921,99,279239,17,752.0,23,16,,,,,20380,26,+++++,+++,+++++,+++\
,+++++,+++,+++++,+++,+++++,+++,15613us,598ms,597ms,2764us,398ms,215ms,487us,627us,407us,972us,29us,262us
I don't know enough about bonnie++ to know if these differences are interesting.
One dramatic difference I noted via vmstat. On the old server, the I/O load during the bonnie++ run was steady, like this:
procs -----------memory---------- ---swap-- -----io---- -system-- ----cpu----
r b swpd free buff cache si so bi bo in cs us sy id wa
r b swpd free buff cache si so bi bo in cs us sy id wa
0 2 71800 2117612 17940 9375660 0 0 82948 81944 1992 1341 1 3 86 10
0 2 71800 2113328 17948 9383896 0 0 76288 75806 1751 1167 0 2 86 11
0 1 71800 2111004 17948 9386540 92 0 93324 94232 2230 1510 0 4 86 10
0 1 71800 2106796 17948 9387436 114 0 67698 67588 1572 1088 0 2 87 11
0 1 71800 2106724 17956 9387968 50 0 81970 85710 1918 1287 0 3 86 10
1 1 71800 2103304 17956 9390700 0 0 92096 92160 1970 1194 0 4 86 10
0 2 71800 2103196 17976 9389204 0 0 70722 69680 1655 1116 1 3 86 10
1 1 71800 2099064 17980 9390824 0 0 57346 57348 1357 949 0 2 87 11
0 1 71800 2095596 17980 9392720 0 0 57344 57348 1379 987 0 2 86 12
But the new server varied wildly during bonnie++:
procs -----------memory---------- ---swap-- -----io---- -system-- ----cpu----
r b swpd free buff cache si so bi bo in cs us sy id wa
0 1 0 4518352 12004 7167000 0 0 118894 120838 2613 1539 0 2 93 5
0 1 0 4517252 12004 7167824 0 0 52116 53248 1179 793 0 1 94 5
0 1 0 4515864 12004 7169088 0 0 46764 49152 1104 733 0 1 91 7
0 1 0 4515180 12012 7169764 0 0 32924 30724 750 542 0 1 93 6
0 1 0 4514328 12016 7170780 0 0 42188 45056 1019 664 0 1 90 9
0 1 0 4513072 12016 7171856 0 0 67528 65540 1487 993 0 1 96 4
0 1 0 4510852 12016 7173160 0 0 56876 57344 1358 942 0 1 94 5
0 1 0 4500280 12044 7179924 0 0 91564 94220 2505 2504 1 2 91 6
0 1 0 4495564 12052 7183492 0 0 102660 104452 2289 1473 0 2 92 6
0 1 0 4492092 12052 7187720 0 0 98498 96274 2140 1385 0 2 93 5
0 1 0 4488608 12060 7190772 0 0 97628 100358 2176 1398 0 1 94 4
1 0 0 4485880 12052 7192600 0 0 112406 114686 2461 1509 0 3 90 7
1 0 0 4483424 12052 7195612 0 0 64678 65536 1449 948 0 1 91 8
0 1 0 4480252 12052 7199404 0 0 99608 100356 2217 1452 0 1 96 3
Any ideas where to look next would be greatly appreciated.
Craig
On Oct 9, 2012, at 1:45 AM, Craig James <cjames@emolecules.com> wrote:
This is driving me crazy. A new server, virtually identical to an old one, has 50% of the performance with pgbench. I've checked everything I can think of.
The setups (call the servers "old" and "new"):
old: 2 x 4-core Intel Xeon E5620
new: 4 x 4-core Intel Xeon E5606
both:
memory: 12 GB DDR EC
Disks: 12x500GB disks (Western Digital 7200RPM SATA)
2 disks, RAID1: OS (ext4) and postgres xlog (ext2)
8 disks, RAID10: $PGDATA
3WARE 9650SE-12ML with battery-backed cache. The admin tool (tw_cli)
indicates that the battery is charged and the cache is working on both units.
Linux: 2.6.32-41-server #94-Ubuntu SMP (new server's disk was
actually cloned from old server).
Postgres: 8.4.4 (yes, I should update. But both are identical.)
The postgres.conf files are identical; diffs from the original are:
max_connections = 500
shared_buffers = 1000MB
work_mem = 128MB
synchronous_commit = off
full_page_writes = off
wal_buffers = 256kB
checkpoint_segments = 30
effective_cache_size = 4GB
track_activities = on
track_counts = on
track_functions = none
autovacuum = on
autovacuum_naptime = 5min
escape_string_warning = off
Note that the old server is in production and was serving a light load while this test was running, so in theory it should be slower, not faster, than the new server.
pgbench: Old server
pgbench -i -s 100 -U test
pgbench -U test -c ... -t ...
-c -t TPS
5 20000 3777
10 10000 2622
20 5000 3759
30 3333 5712
40 2500 5953
50 2000 6141
New server
-c -t TPS
5 20000 2733
10 10000 2783
20 5000 3241
30 3333 2987
40 2500 2739
50 2000 2119
As you can see, the new server is dramatically slower than the old one.
I tested both the RAID10 data disk and the RAID1 xlog disk with bonnie++. The xlog disks were almost identical in performance. The RAID10 pg-data disks looked like this:
Old server:
Version 1.96 ------Sequential Output------ --Sequential Input- --Random-
Concurrency 1 -Per Chr- --Block-- -Rewrite- -Per Chr- --Block-- --Seeks--
Machine Size K/sec %CP K/sec %CP K/sec %CP K/sec %CP K/sec %CP /sec %CP
xenon 24064M 687 99 203098 26 81904 16 3889 96 403747 31 737.6 31
Latency 20512us 469ms 394ms 21402us 396ms 112ms
Version 1.96 ------Sequential Create------ --------Random Create--------
xenon -Create-- --Read--- -Delete-- -Create-- --Read--- -Delete--
files /sec %CP /sec %CP /sec %CP /sec %CP /sec %CP /sec %CP
16 15953 27 +++++ +++ +++++ +++ +++++ +++ +++++ +++ +++++ +++
Latency 43291us 857us 519us 1588us 37us 178us
1.96,1.96,xenon,1,1349726125,24064M,,687,99,203098,26,81904,16,3889,96,403747,31,737.6,31,16,,,,,15953,27,+++++,+++,+++++,++\
+,+++++,+++,+++++,+++,+++++,+++,20512us,469ms,394ms,21402us,396ms,112ms,43291us,857us,519us,1588us,37us,178us
New server:
Version 1.96 ------Sequential Output------ --Sequential Input- --Random-
Concurrency 1 -Per Chr- --Block-- -Rewrite- -Per Chr- --Block-- --Seeks--
Machine Size K/sec %CP K/sec %CP K/sec %CP K/sec %CP K/sec %CP /sec %CP
zinc 24064M 862 99 212143 54 96008 14 4921 99 279239 17 752.0 23
Latency 15613us 598ms 597ms 2764us 398ms 215ms
Version 1.96 ------Sequential Create------ --------Random Create--------
zinc -Create-- --Read--- -Delete-- -Create-- --Read--- -Delete--
files /sec %CP /sec %CP /sec %CP /sec %CP /sec %CP /sec %CP
16 20380 26 +++++ +++ +++++ +++ +++++ +++ +++++ +++ +++++ +++
Latency 487us 627us 407us 972us 29us 262us
1.96,1.96,zinc,1,1349722017,24064M,,862,99,212143,54,96008,14,4921,99,279239,17,752.0,23,16,,,,,20380,26,+++++,+++,+++++,+++\
,+++++,+++,+++++,+++,+++++,+++,15613us,598ms,597ms,2764us,398ms,215ms,487us,627us,407us,972us,29us,262us
I don't know enough about bonnie++ to know if these differences are interesting.
One dramatic difference I noted via vmstat. On the old server, the I/O load during the bonnie++ run was steady, like this:
procs -----------memory---------- ---swap-- -----io---- -system-- ----cpu----
r b swpd free buff cache si so bi bo in cs us sy id wa
r b swpd free buff cache si so bi bo in cs us sy id wa
0 2 71800 2117612 17940 9375660 0 0 82948 81944 1992 1341 1 3 86 10
0 2 71800 2113328 17948 9383896 0 0 76288 75806 1751 1167 0 2 86 11
0 1 71800 2111004 17948 9386540 92 0 93324 94232 2230 1510 0 4 86 10
0 1 71800 2106796 17948 9387436 114 0 67698 67588 1572 1088 0 2 87 11
0 1 71800 2106724 17956 9387968 50 0 81970 85710 1918 1287 0 3 86 10
1 1 71800 2103304 17956 9390700 0 0 92096 92160 1970 1194 0 4 86 10
0 2 71800 2103196 17976 9389204 0 0 70722 69680 1655 1116 1 3 86 10
1 1 71800 2099064 17980 9390824 0 0 57346 57348 1357 949 0 2 87 11
0 1 71800 2095596 17980 9392720 0 0 57344 57348 1379 987 0 2 86 12
But the new server varied wildly during bonnie++:
procs -----------memory---------- ---swap-- -----io---- -system-- ----cpu----
r b swpd free buff cache si so bi bo in cs us sy id wa
0 1 0 4518352 12004 7167000 0 0 118894 120838 2613 1539 0 2 93 5
0 1 0 4517252 12004 7167824 0 0 52116 53248 1179 793 0 1 94 5
0 1 0 4515864 12004 7169088 0 0 46764 49152 1104 733 0 1 91 7
0 1 0 4515180 12012 7169764 0 0 32924 30724 750 542 0 1 93 6
0 1 0 4514328 12016 7170780 0 0 42188 45056 1019 664 0 1 90 9
0 1 0 4513072 12016 7171856 0 0 67528 65540 1487 993 0 1 96 4
0 1 0 4510852 12016 7173160 0 0 56876 57344 1358 942 0 1 94 5
0 1 0 4500280 12044 7179924 0 0 91564 94220 2505 2504 1 2 91 6
0 1 0 4495564 12052 7183492 0 0 102660 104452 2289 1473 0 2 92 6
0 1 0 4492092 12052 7187720 0 0 98498 96274 2140 1385 0 2 93 5
0 1 0 4488608 12060 7190772 0 0 97628 100358 2176 1398 0 1 94 4
1 0 0 4485880 12052 7192600 0 0 112406 114686 2461 1509 0 3 90 7
1 0 0 4483424 12052 7195612 0 0 64678 65536 1449 948 0 1 91 8
0 1 0 4480252 12052 7199404 0 0 99608 100356 2217 1452 0 1 96 3
Any ideas where to look next would be greatly appreciated.
Craig
On Mon, Oct 8, 2012 at 3:33 PM, Evgeny Shishkin <itparanoia@gmail.com> wrote:
The old server is in production and is running Apache/Postgres requests.
Craig
On Oct 9, 2012, at 1:45 AM, Craig James <cjames@emolecules.com> wrote:One dramatic difference I noted via vmstat. On the old server, the I/O load during the bonnie++ run was steady, like this:
procs -----------memory---------- ---swap-- -----io---- -system-- ----cpu----
r b swpd free buff cache si so bi bo in cs us sy id wa
r b swpd free buff cache si so bi bo in cs us sy id wa
0 2 71800 2117612 17940 9375660 0 0 82948 81944 1992 1341 1 3 86 10
0 2 71800 2113328 17948 9383896 0 0 76288 75806 1751 1167 0 2 86 11
0 1 71800 2111004 17948 9386540 92 0 93324 94232 2230 1510 0 4 86 10
0 1 71800 2106796 17948 9387436 114 0 67698 67588 1572 1088 0 2 87 11
0 1 71800 2106724 17956 9387968 50 0 81970 85710 1918 1287 0 3 86 10
1 1 71800 2103304 17956 9390700 0 0 92096 92160 1970 1194 0 4 86 10
0 2 71800 2103196 17976 9389204 0 0 70722 69680 1655 1116 1 3 86 10
1 1 71800 2099064 17980 9390824 0 0 57346 57348 1357 949 0 2 87 11
0 1 71800 2095596 17980 9392720 0 0 57344 57348 1379 987 0 2 86 12
But the new server varied wildly during bonnie++:
procs -----------memory---------- ---swap-- -----io---- -system-- ----cpu----
r b swpd free buff cache si so bi bo in cs us sy id wa
0 1 0 4518352 12004 7167000 0 0 118894 120838 2613 1539 0 2 93 5
0 1 0 4517252 12004 7167824 0 0 52116 53248 1179 793 0 1 94 5
0 1 0 4515864 12004 7169088 0 0 46764 49152 1104 733 0 1 91 7
0 1 0 4515180 12012 7169764 0 0 32924 30724 750 542 0 1 93 6
0 1 0 4514328 12016 7170780 0 0 42188 45056 1019 664 0 1 90 9
0 1 0 4513072 12016 7171856 0 0 67528 65540 1487 993 0 1 96 4
0 1 0 4510852 12016 7173160 0 0 56876 57344 1358 942 0 1 94 5
0 1 0 4500280 12044 7179924 0 0 91564 94220 2505 2504 1 2 91 6
0 1 0 4495564 12052 7183492 0 0 102660 104452 2289 1473 0 2 92 6
0 1 0 4492092 12052 7187720 0 0 98498 96274 2140 1385 0 2 93 5
0 1 0 4488608 12060 7190772 0 0 97628 100358 2176 1398 0 1 94 4
1 0 0 4485880 12052 7192600 0 0 112406 114686 2461 1509 0 3 90 7
1 0 0 4483424 12052 7195612 0 0 64678 65536 1449 948 0 1 91 8
0 1 0 4480252 12052 7199404 0 0 99608 100356 2217 1452 0 1 96 3Also note the difference in free/cache distribution. Unless you took these numbers in completely different stages of bonnie++.
The old server is in production and is running Apache/Postgres requests.
Craig
On Mon, Oct 8, 2012 at 7:25 PM, Craig James <cjames@emolecules.com> wrote:
>> > But why? What have I overlooked?
>>
>> Do you have readahead properly set up on the new one?
>
>
>  # blockdev --getra /dev/sdb1
> 256


It's probably this. 256 is way too low to saturate your I/O system.
Pump it up. I've found 8192 works nice for a system I have, 32000 I
guess could work too.
On Oct 9, 2012, at 2:44 AM, Claudio Freire <klaussfreire@gmail.com> wrote:

> On Mon, Oct 8, 2012 at 7:25 PM, Craig James <cjames@emolecules.com> wrote:
>>>> But why? What have I overlooked?
>>>
>>> Do you have readahead properly set up on the new one?
>>
>>
>> # blockdev --getra /dev/sdb1
>> 256
>
>
> It's probably this. 256 is way too low to saturate your I/O system.
> Pump it up. I've found 8192 works nice for a system I have, 32000 I
> guess could work too.

This, i also suggest to rebenchmark with increased wal_buffers. May be that downscale comes from wal mutex contention.
On Mon, Oct 8, 2012 at 3:44 PM, Claudio Freire <klaussfreire@gmail.com> wrote:
On Mon, Oct 8, 2012 at 7:25 PM, Craig James <cjames@emolecules.com> wrote:
>> > But why? What have I overlooked?
>>
>> Do you have readahead properly set up on the new one?
>
>
> # blockdev --getra /dev/sdb1
> 256
It's probably this. 256 is way too low to saturate your I/O system.
Pump it up. I've found 8192 works nice for a system I have, 32000 I
guess could work too.
But again ... the two systems are identical. This can't explain it.
Thanks,
Craig
On Mon, Oct 8, 2012 at 7:48 PM, Craig James <cjames@emolecules.com> wrote:
>> >  # blockdev --getra /dev/sdb1
>> > 256
>>
>>
>> It's probably this. 256 is way too low to saturate your I/O system.
>> Pump it up. I've found 8192 works nice for a system I have, 32000 I
>> guess could work too.
>
>
> But again ... the two systems are identical.  This can't explain it.

Is the read-ahead the same in both systems?
On Mon, Oct 8, 2012 at 3:50 PM, Claudio Freire <klaussfreire@gmail.com> wrote:
On Mon, Oct 8, 2012 at 7:48 PM, Craig James <cjames@emolecules.com> wrote:
>> > # blockdev --getra /dev/sdb1
>> > 256
>>
>>
>> It's probably this. 256 is way too low to saturate your I/O system.
>> Pump it up. I've found 8192 works nice for a system I have, 32000 I
>> guess could work too.
>
>
> But again ... the two systems are identical. This can't explain it.
Is the read-ahead the same in both systems?
Yes, as I said in the original reply (it got cut off from your reply): "Same on both servers."
Craig
On 09/10/12 11:48, Craig James wrote:
> On Mon, Oct 8, 2012 at 3:44 PM, Claudio Freire <klaussfreire@gmail.com>wrote:
>
>> On Mon, Oct 8, 2012 at 7:25 PM, Craig James <cjames@emolecules.com> wrote:
>>>>> But why? What have I overlooked?
>>>> Do you have readahead properly set up on the new one?
>>>
>>>   # blockdev --getra /dev/sdb1
>>> 256
>>
>> It's probably this. 256 is way too low to saturate your I/O system.
>> Pump it up. I've found 8192 works nice for a system I have, 32000 I
>> guess could work too.
>>
> But again ... the two systems are identical.  This can't explain it.
>

Maybe check all sysctl's are the same - in particular:

vm.zone_reclaim_mode

has a tendency to set itself to 1 on newer hardware, which will reduce
performance of database style workloads.

Cheers

Mark
On Mon, Oct 8, 2012 at 8:03 PM, Craig James <cjames@emolecules.com> wrote:
>> > But again ... the two systems are identical.  This can't explain it.
>>
>> Is the read-ahead the same in both systems?
>
>
> Yes, as I said in the original reply (it got cut off from your reply): "Same
> on both servers."

Oh, yes. Google collapsed it. Wierd.

Anyway, sequential I/O isn't the same in both servers, and usually you
don't get full sequential performance unless you bump up the
read-ahead. I'm still betting on that for the difference in sequential
performance.

As for pgbench, I'm not sure, but I think pgbench doesn't really
stress sequential performance. You seem to be getting bad queueing
performance. Did you check NCQ status on the RAID controller? Is it on
on both servers?
On 9.10.2012 01:03, Craig James wrote:
>
>
> On Mon, Oct 8, 2012 at 3:50 PM, Claudio Freire <klaussfreire@gmail.com
> <mailto:klaussfreire@gmail.com>> wrote:
>
>     On Mon, Oct 8, 2012 at 7:48 PM, Craig James <cjames@emolecules.com
>     <mailto:cjames@emolecules.com>> wrote:
>     >> >  # blockdev --getra /dev/sdb1
>     >> > 256
>     >>
>     >>
>     >> It's probably this. 256 is way too low to saturate your I/O system.
>     >> Pump it up. I've found 8192 works nice for a system I have, 32000 I
>     >> guess could work too.
>     >
>     >
>     > But again ... the two systems are identical.  This can't explain it.
>
>     Is the read-ahead the same in both systems?
>
>
> Yes, as I said in the original reply (it got cut off from your reply):
> "Same on both servers."

And what about read-ahead settings on the controller? 3WARE used to have
a read-ahead settings on their own (usually there are three options -
read-ahead, no read-ahead and adaptive). Is this set to the same value
on both machines?

Tomas
On 9.10.2012 00:33, Evgeny Shishkin wrote:
>>
>> pgbench: Old server
>>
>>     pgbench -i -s 100 -U test
>>     pgbench -U test -c ... -t ...
>>
>>     -c  -t      TPS
>>      5  20000  3777
>>     10  10000  2622
>>     20  5000   3759
>>     30  3333   5712
>>     40  2500   5953
>>     50  2000   6141
>>
>> New server
>>     -c  -t      TPS
>>     5   20000  2733
>>     10  10000  2783
>>     20  5000   3241
>>     30  3333   2987
>>     40  2500   2739
>>     50  2000   2119
>
> On new server postgresql do not scale at all. Looks like contention.

Why? The evidence we've seen so far IMHO suggests a poorly performing
I/O subsystem. Post a few lines of "vmstat 1" / "iostat -x -k 1"
collected when the pgbench is running, that might tell us more.

Try a few very basic I/O tests that are easy to understand rather than
running bonnie++ which is quite complex. For example try this:

time sh -c "dd if=/dev/zero of=myfile.tmp bs=8192 count=4194304 && sync"

dd if=myfile.tmp of=/dev/null bs=8192

The former measures sequential write speed, the latter measures
sequential read speed in a very primitive way. Watch vmstat/iostat and
don't bother running pgbench until you get a reasonable performance on
both systems.


Tomas
On Oct 9, 2012, at 3:24 AM, Tomas Vondra <tv@fuzzy.cz> wrote:

> On 9.10.2012 00:33, Evgeny Shishkin wrote:
>>>
>>> pgbench: Old server
>>>
>>>    pgbench -i -s 100 -U test
>>>    pgbench -U test -c ... -t ...
>>>
>>>    -c  -t      TPS
>>>     5  20000  3777
>>>    10  10000  2622
>>>    20  5000   3759
>>>    30  3333   5712
>>>    40  2500   5953
>>>    50  2000   6141
>>>
>>> New server
>>>    -c  -t      TPS
>>>    5   20000  2733
>>>    10  10000  2783
>>>    20  5000   3241
>>>    30  3333   2987
>>>    40  2500   2739
>>>    50  2000   2119
>>
>> On new server postgresql do not scale at all. Looks like contention.
>
> Why? The evidence we've seen so far IMHO suggests a poorly performing
> I/O subsystem. Post a few lines of "vmstat 1" / "iostat -x -k 1"
> collected when the pgbench is running, that might tell us more.
>

Because 50 clients can push io even with small read ahead. And hear we see nice parabola. Just guessing anyway.

> Try a few very basic I/O tests that are easy to understand rather than
> running bonnie++ which is quite complex. For example try this:
>
> time sh -c "dd if=/dev/zero of=myfile.tmp bs=8192 count=4194304 && sync"
>
> dd if=myfile.tmp of=/dev/null bs=8192
>
> The former measures sequential write speed, the latter measures
> sequential read speed in a very primitive way. Watch vmstat/iostat and
> don't bother running pgbench until you get a reasonable performance on
> both systems.
>
>
> Tomas
>
>
> --
> Sent via pgsql-performance mailing list (pgsql-performance@postgresql.org)
> To make changes to your subscription:
> http://www.postgresql.org/mailpref/pgsql-performance
Nobody has commented on the hyperthreading question yet ... does it really matter? The old (fast) server has hyperthreading disabled, and the new (slower) server has hyperthreads enabled.
If hyperthreading is definitely NOT an issue, it will save me a trip to the co-lo facility.
Thanks,
Craig
If hyperthreading is definitely NOT an issue, it will save me a trip to the co-lo facility.
Thanks,
Craig
On Mon, Oct 8, 2012 at 3:29 PM, Craig James <cjames@emolecules.com> wrote:
One mistake in my descriptions...On Mon, Oct 8, 2012 at 2:45 PM, Craig James <cjames@emolecules.com> wrote:This is driving me crazy. A new server, virtually identical to an old one, has 50% of the performance with pgbench. I've checked everything I can think of.
The setups (call the servers "old" and "new"):
old: 2 x 4-core Intel Xeon E5620
new: 4 x 4-core Intel Xeon E5606
Actually it's not 16 cores. It's 8 cores, hyperthreaded. Hyperthreading is disabled on the old system.
Is that enough to make this radical difference? (The server is at a co-location site, so I have to go down there to boot into the BIOS and disable hyperthreading.)
Craig
On 2012-10-08 23:45, Craig James wrote:
> This is driving me crazy.  A new server, virtually identical to an old
> one, has 50% of the performance with pgbench.  I've checked everything
> I can think of.
>
> The setups (call the servers "old" and "new"):
>
> old: 2 x 4-core Intel Xeon E5620
> new: 4 x 4-core Intel Xeon E5606

How are the filesystems formatted and mounted (-o nobarrier?)

regards
Yeb
On 10/08/2012 06:40 PM, Craig James wrote:

> Nobody has commented on the hyperthreading question yet ... does it
> really matter? The old (fast) server has hyperthreading disabled, and
> the new (slower) server has hyperthreads enabled.

I doubt it's this. With the newer post-Nehalem processors,
hyperthreading is actually much better than it was before. But you also
have this:

CPU    Speed    L3 Cache  DDR3 Speed
E5606  2.13Ghz  8MB       800Mhz
E5620  2.4Ghz   12MB      1066Mhz

Even with "equal" threads, the CPUs you  have in the new server, as
opposed to the old, are much worse. The E5606 doesn't even have
hyper-threading, so it's not an issue here. In fact, if you enabled it
on the old server, it would likely get *much faster*.

We saw a 40% improvement by enabling hyper-threading. Sure, it's not
100%, but it's not negative or zero, either.

Basically we can see, at the very least, that your servers are not
"identical." Little things like this can make a massive difference. The
old server has a much better CPU. Even crippled without hyperthreading,
I could see it beating the new server.

One thing you might want to check in the BIOS of the new server, is to
make sure that power saving mode is disabled everywhere you can find it.
Some servers come with that set by default, and that puts the CPU to
sleep occasionally, and the spin-up necessary to re-engage it is
punishing and inconsistent. We saw 20-40% drops in pgbench pretty much
at random, when CPU power saving was enabled.

This doesn't cover why your IO subsystem is slower on the new system,
but I suspect it might have something to do with the memory speed. It
suggests a slower PCI bus, which could choke your RAID card.

--
Shaun Thomas
OptionsHouse | 141 W. Jackson Blvd. | Suite 500 | Chicago IL, 60604
312-444-8534
sthomas@optionshouse.com

______________________________________________

See http://www.peak6.com/email_disclaimer/ for terms and conditions related to this email
On Mon, Oct 08, 2012 at 04:40:31PM -0700, Craig James wrote:
>    Nobody has commented on the hyperthreading question yet ... does it
>    really matter? The old (fast) server has hyperthreading disabled, and
>    the new (slower) server has hyperthreads enabled.
>    If hyperthreading is definitely NOT an issue, it will save me a trip to
>    the co-lo facility.

From my reading it seems that hyperthreading hasn't been a major issue
for quite sometime on modern kernels.
http://archives.postgresql.org/pgsql-performance/2004-10/msg00052.php

I doubt it would hurt much, but I wouldn't make a special trip to the
co-lo to change it.
--
DavidT
On Tue, Oct 9, 2012 at 9:02 AM, Shaun Thomas <sthomas@optionshouse.com> wrote:
Even more mysterious, because it turns out it's backwards. I copy-and-pasted the CPU information wrong. I wrote:
> old: 2 x 4-core Intel Xeon E5620
> new: 4 x 4-core Intel Xeon E5606
The correct configuration is:
old: 2x4-core Intel Xeon E2606 2.133 GHz
new: 2x4-core Intex Xeon E5620 2.40 GHz
So that makes the poor performance of the new system even more mystifying.
I'm going down there right now to disable hyperthreading and see if that's the answer. So far, that's the only concrete thing that I've been able to discover that's different between the two systems.
Thanks, I'll double check that too. That's a good suspect.
The motherboards are supposed to be identical. But I'll double check that too.
Craig
On 10/08/2012 06:40 PM, Craig James wrote:Nobody has commented on the hyperthreading question yet ... does it
really matter? The old (fast) server has hyperthreading disabled, and
the new (slower) server has hyperthreads enabled.
I doubt it's this. With the newer post-Nehalem processors, hyperthreading is actually much better than it was before. But you also have this:
CPU Speed L3 Cache DDR3 Speed
E5606 2.13Ghz 8MB 800Mhz
E5620 2.4Ghz 12MB 1066Mhz
Even with "equal" threads, the CPUs you have in the new server, as opposed to the old, are much worse. The E5606 doesn't even have hyper-threading, so it's not an issue here. In fact, if you enabled it on the old server, it would likely get *much faster*.
Even more mysterious, because it turns out it's backwards. I copy-and-pasted the CPU information wrong. I wrote:
> old: 2 x 4-core Intel Xeon E5620
> new: 4 x 4-core Intel Xeon E5606
The correct configuration is:
old: 2x4-core Intel Xeon E2606 2.133 GHz
new: 2x4-core Intex Xeon E5620 2.40 GHz
So that makes the poor performance of the new system even more mystifying.
I'm going down there right now to disable hyperthreading and see if that's the answer. So far, that's the only concrete thing that I've been able to discover that's different between the two systems.
We saw a 40% improvement by enabling hyper-threading. Sure, it's not 100%, but it's not negative or zero, either.
Basically we can see, at the very least, that your servers are not "identical." Little things like this can make a massive difference. The old server has a much better CPU. Even crippled without hyperthreading, I could see it beating the new server.
One thing you might want to check in the BIOS of the new server, is to make sure that power saving mode is disabled everywhere you can find it. Some servers come with that set by default, and that puts the CPU to sleep occasionally, and the spin-up necessary to re-engage it is punishing and inconsistent. We saw 20-40% drops in pgbench pretty much at random, when CPU power saving was enabled.
Thanks, I'll double check that too. That's a good suspect.
This doesn't cover why your IO subsystem is slower on the new system, but I suspect it might have something to do with the memory speed. It suggests a slower PCI bus, which could choke your RAID card.
The motherboards are supposed to be identical. But I'll double check that too.
Craig
--
Shaun Thomas
OptionsHouse | 141 W. Jackson Blvd. | Suite 500 | Chicago IL, 60604
312-444-8534
sthomas@optionshouse.com
______________________________________________
See http://www.peak6.com/email_disclaimer/ for terms and conditions related to this email
On Tue, Oct 9, 2012 at 9:14 AM, David Thomas <david@digitaldogma.org> wrote:
At this point I've discovered no other options, so down to the co-lo I go. I'm also going to check power-save options and the RAID controller's built-in configuration to see if I overlooked something there (readahead, blocksize, whatever).
Craig
On Mon, Oct 08, 2012 at 04:40:31PM -0700, Craig James wrote:
> Nobody has commented on the hyperthreading question yet ... does it
> really matter? The old (fast) server has hyperthreading disabled, and
> the new (slower) server has hyperthreads enabled.
> If hyperthreading is definitely NOT an issue, it will save me a trip to
> the co-lo facility.
From my reading it seems that hyperthreading hasn't been a major issue
for quite sometime on modern kernels.
http://archives.postgresql.org/pgsql-performance/2004-10/msg00052.php
I doubt it would hurt much, but I wouldn't make a special trip to the
co-lo to change it.
At this point I've discovered no other options, so down to the co-lo I go. I'm also going to check power-save options and the RAID controller's built-in configuration to see if I overlooked something there (readahead, blocksize, whatever).
Craig
--
DavidT
On 09/10/12 12:40, Craig James wrote:
Nobody has commented on the hyperthreading question yet ... does it really matter? The old (fast) server has hyperthreading disabled, and the new (slower) server has hyperthreads enabled.My latest development box (Intel Latest Core i7 3770K Ivy Bridge Quad Core with HT 3.4GHz) has hyperthreading - and it does make a significant difference.
If hyperthreading is definitely NOT an issue, it will save me a trip to the co-lo facility.
Thanks,
CraigOn Mon, Oct 8, 2012 at 3:29 PM, Craig James <cjames@emolecules.com> wrote:One mistake in my descriptions...On Mon, Oct 8, 2012 at 2:45 PM, Craig James <cjames@emolecules.com> wrote:This is driving me crazy. A new server, virtually identical to an old one, has 50% of the performance with pgbench. I've checked everything I can think of.
The setups (call the servers "old" and "new"):
old: 2 x 4-core Intel Xeon E5620
new: 4 x 4-core Intel Xeon E5606
Actually it's not 16 cores. It's 8 cores, hyperthreaded. Hyperthreading is disabled on the old system.
Is that enough to make this radical difference? (The server is at a co-location site, so I have to go down there to boot into the BIOS and disable hyperthreading.)
Craig
Cheers,
Gavin
On Tue, Oct 9, 2012 at 2:40 AM, Craig James <cjames@emolecules.com> wrote:
> Nobody has commented on the hyperthreading question yet ... does it really
> matter? The old (fast) server has hyperthreading disabled, and the new
> (slower) server has hyperthreads enabled.
>
> If hyperthreading is definitely NOT an issue, it will save me a trip to the
> co-lo facility.

Hyperthreading will make lock contention issues worse by having more
threads fighting. Test the new box with postgres 9.2, if the newer
version exhibits much better scaling behavior it strongly suggest lock
contention rather than IO being the root cause.

Ants Aasma
--
Cybertec Schönig & Schönig GmbH
Gröhrmühlgasse 26
A-2700 Wiener Neustadt
Web: http://www.postgresql-support.de
On 10/09/2012 01:40 AM, Craig James wrote:
> Nobody has commented on the hyperthreading question yet ... does it really matter? The old (fast) server has
hyperthreadingdisabled, and the new (slower) server has hyperthreads enabled.
>
> If hyperthreading is definitely NOT an issue, it will save me a trip to the co-lo facility.


sorry to come late to the party, but being in a similar condition
I've googled a bit and I've found a way to disable hyperthreading without
the need to reboot the system and entering the bios:

echo 0 >/sys/devices/system/node/node0/cpuX/online

where X belongs to 1..(#cores * 2) if hyperthreading is enabled
(cpu0 can't be switched off).

didn't try myself on live system, but I definitely will
as soon as I have a new machine to test.

Andrea
On Thu, Oct 11, 2012 at 11:14 AM, Andrea Suisani <sickpig@opinioni.net> wrote:
> sorry to come late to the party, but being in a similar condition
> I've googled a bit and I've found a way to disable hyperthreading without
> the need to reboot the system and entering the bios:
>
> echo 0 >/sys/devices/system/node/node0/cpuX/online
>
> where X belongs to 1..(#cores * 2) if hyperthreading is enabled
> (cpu0 can't be switched off).
>
> didn't try myself on live system, but I definitely will
> as soon as I have a new machine to test.

Question is... will that remove the performance penalty of HyperThreading?

I don't think so, because a big one is the register file split (half
the hardware registers go to a CPU, half to the other). If that action
doesn't tell the CPU to "unsplit", some shared components may become
unbogged, like the decode stage probably, but I'm not sure it's the
same as disabling it from the BIOS.
On 10/11/2012 04:19 PM, Claudio Freire wrote:
> On Thu, Oct 11, 2012 at 11:14 AM, Andrea Suisani <sickpig@opinioni.net> wrote:
>> sorry to come late to the party, but being in a similar condition
>> I've googled a bit and I've found a way to disable hyperthreading without
>> the need to reboot the system and entering the bios:
>>
>> echo 0 >/sys/devices/system/node/node0/cpuX/online
>>
>> where X belongs to 1..(#cores * 2) if hyperthreading is enabled
>> (cpu0 can't be switched off).
>>
>> didn't try myself on live system, but I definitely will
>> as soon as I have a new machine to test.
>
> Question is... will that remove the performance penalty of HyperThreading?

So I've added to my todo list to perform a test to verify this claim :)

> I don't think so, because a big one is the register file split (half
> the hardware registers go to a CPU, half to the other). If that action
> doesn't tell the CPU to "unsplit", some shared components may become
> unbogged, like the decode stage probably, but I'm not sure it's the
> same as disabling it from the BIOS.

Although I think that you're probably right to assume that disabling HT
through the syfs interface won't remove the performance penalty for real.

thanks

Andrea
On 10/11/2012 04:40 PM, Andrea Suisani wrote:
> On 10/11/2012 04:19 PM, Claudio Freire wrote:
>> On Thu, Oct 11, 2012 at 11:14 AM, Andrea Suisani <sickpig@opinioni.net> wrote:
>>> sorry to come late to the party, but being in a similar condition
>>> I've googled a bit and I've found a way to disable hyperthreading without
>>> the need to reboot the system and entering the bios:
>>>
>>> echo 0 >/sys/devices/system/node/node0/cpuX/online
>>>
>>> where X belongs to 1..(#cores * 2) if hyperthreading is enabled
>>> (cpu0 can't be switched off).
>>>
>>> didn't try myself on live system, but I definitely will
>>> as soon as I have a new machine to test.
>>
>> Question is... will that remove the performance penalty of HyperThreading?
>
> So I've added to my todo list to perform a test to verify this claim :)

done.

in a brief: the box is dell a PowerEdge r720 with 16GB of RAM,
the cpu is a Xeon 5620 with 6 core, the OS is installed on a raid
(sata disk 7.2k rpm) and the PGDATA is on separate RAID 1 array
(sas 15K rpm) and the controller is a PERC H710 (bbwc with a cache
of 512 MB).

Postgres ver 9.2.1 (sorry for not having benchmarked 9.1,
but this what we plan to deploy in production). Both the OS
(Ubuntu 12.04.1) and Postgres had been briefly tuned according
to the usal standards while trying to mimic Craig's configuration
(see specific settings at the bottom).

TPS including connection establishing, pgbench run in a single
thread mode, connection made through unix socket, OS cache dropped
and Postgres restarted for every run.

those are the results:

                HT        HT SYSFS DIS    HT BIOS DISABLE
-c -t     r1   r2   r3    r1   r2   r3    r1   r2   r3
5  20K   1641 1831 1496  2020 1974 2033  2005 1988 1967
10 10K   2161 2134 2136  2277 2252 2216  1854 1824 1810
20 5k    2550 2508 2558  2417 2388 2357  1924 1928 1954
30 3333  2216 2272 2250  2333 2493 2496  1993 2009 2008
40 2.5K  2179 2221 2250  2568 2535 2500  2025 2048 2018
50 2K    2217 2213 2213  2487 2449 2604  2112 2016 2023

Despite the fact the results don't match my expectation
(I suspect that there's something wrong with the PERC
because, having the controller cache enabled make no
difference in terms of TPS), it seems strange that disabling
HT from the bios will give lesser TPS that HT disable through
sysfs interface.

OS conf:

vm.swappiness=0
vm.overcommit_memory=2
vm.dirty_ratio=2
vm.dirty_background_ratio=1
kernel.shmmax=3454820352
kernel.shmall=2048341
/sbin/blockdev --setra 8192 /dev/sdb
$PGDATA is on ext4 (rw,noatime)
Linux cloud 3.2.0-32-generic #51-Ubuntu SMP Wed Sep 26 21:33:09 UTC 2012 x86_64 x86_64 x86_64 GNU/Linux
sdb scheduler is [cfq]

DB conf:

max_connections = 100
shared_buffers = 3200MB
work_mem = 30MB
maintenance_work_mem = 800MB
synchronous_commit = off
full_page_writes = off
checkpoint_segments = 40
checkpoint_timeout = 5min
checkpoint_completion_target = 0.9
random_page_cost = 3.5
effective_cache_size = 10GB
log_autovacuum_min_duration = 0
autovacuum_naptime = 5min


Andrea

p.s. as last try in the process of increasing TPS
I've change the scheduler from cfq to deadline
and for -c 5 t 20K I've got r1=3007, r2=2930 and r3=2985.
On Mon, Oct 15, 2012 at 1:27 AM, Andrea Suisani <sickpig@opinioni.net> wrote:
> On 10/11/2012 04:40 PM, Andrea Suisani wrote:
>>
>> On 10/11/2012 04:19 PM, Claudio Freire wrote:
>>>
>>> On Thu, Oct 11, 2012 at 11:14 AM, Andrea Suisani <sickpig@opinioni.net>
>>> wrote:
>>>>
>>>> sorry to come late to the party, but being in a similar condition
>>>> I've googled a bit and I've found a way to disable hyperthreading
>>>> without
>>>> the need to reboot the system and entering the bios:
>>>>
>>>> echo 0 >/sys/devices/system/node/node0/cpuX/online
>>>>
>>>> where X belongs to 1..(#cores * 2) if hyperthreading is enabled
>>>> (cpu0 can't be switched off).
>>>>
>>>> didn't try myself on live system, but I definitely will
>>>> as soon as I have a new machine to test.
>>>
>>>
>>> Question is... will that remove the performance penalty of
>>> HyperThreading?
>>
>>
>> So I've added to my todo list to perform a test to verify this claim :)
>
>
> done.
>
> in a brief: the box is dell a PowerEdge r720 with 16GB of RAM,
> the cpu is a Xeon 5620 with 6 core, the OS is installed on a raid
> (sata disk 7.2k rpm) and the PGDATA is on separate RAID 1 array
> (sas 15K rpm) and the controller is a PERC H710 (bbwc with a cache
> of 512 MB).
>
> Postgres ver 9.2.1 (sorry for not having benchmarked 9.1,
> but this what we plan to deploy in production). Both the OS
> (Ubuntu 12.04.1) and Postgres had been briefly tuned according
> to the usal standards while trying to mimic Craig's configuration
> (see specific settings at the bottom).
>
> TPS including connection establishing, pgbench run in a single
> thread mode, connection made through unix socket, OS cache dropped
> and Postgres restarted for every run.
>
> those are the results:
>
>                HT        HT SYSFS DIS    HT BIOS DISABLE
> -c -t     r1   r2   r3    r1   r2   r3    r1   r2   r3
> 5  20K   1641 1831 1496  2020 1974 2033  2005 1988 1967
> 10 10K   2161 2134 2136  2277 2252 2216  1854 1824 1810
> 20 5k    2550 2508 2558  2417 2388 2357  1924 1928 1954
> 30 3333  2216 2272 2250  2333 2493 2496  1993 2009 2008
> 40 2.5K  2179 2221 2250  2568 2535 2500  2025 2048 2018
> 50 2K    2217 2213 2213  2487 2449 2604  2112 2016 2023
>
> Despite the fact the results don't match my expectation

You have a RAID1 with 15K SAS disks.  I have a RAID10 with 8 7200 SATA
disks plus another RAID1 for the XLOG file system.  Ten 7K SATA disks
on two file systems should be quite a bit faster than two 15K SAS
disks, right?

> (I suspect that there's something wrong with the PERC
> because, having the controller cache enabled make no
> difference in terms of TPS), it seems strange that disabling
> HT from the bios will give lesser TPS that HT disable through
> sysfs interface.

Well, all I can say is that I like my 3WARE controllers, and it's the
secondary reason why I moved away from Dell (the primary reason is
price).

Craig

>
> OS conf:
>
> vm.swappiness=0
> vm.overcommit_memory=2
> vm.dirty_ratio=2
> vm.dirty_background_ratio=1
> kernel.shmmax=3454820352
> kernel.shmall=2048341
> /sbin/blockdev --setra 8192 /dev/sdb
> $PGDATA is on ext4 (rw,noatime)
> Linux cloud 3.2.0-32-generic #51-Ubuntu SMP Wed Sep 26 21:33:09 UTC 2012
> x86_64 x86_64 x86_64 GNU/Linux
> sdb scheduler is [cfq]
>
> DB conf:
>
> max_connections = 100
> shared_buffers = 3200MB
> work_mem = 30MB
> maintenance_work_mem = 800MB
> synchronous_commit = off
> full_page_writes = off
> checkpoint_segments = 40
> checkpoint_timeout = 5min
> checkpoint_completion_target = 0.9
> random_page_cost = 3.5
> effective_cache_size = 10GB
> log_autovacuum_min_duration = 0
> autovacuum_naptime = 5min
>
>
> Andrea
>
> p.s. as last try in the process of increasing TPS
> I've change the scheduler from cfq to deadline
> and for -c 5 t 20K I've got r1=3007, r2=2930 and r3=2985.
>
>
>
On Mon, Oct 15, 2012 at 5:27 AM, Andrea Suisani <sickpig@opinioni.net> wrote:
> it seems strange that disabling
> HT from the bios will give lesser TPS that HT disable through
> sysfs interface.

It does prove they're not equivalent though.
On 10/15/2012 05:01 PM, Claudio Freire wrote:
> On Mon, Oct 15, 2012 at 5:27 AM, Andrea Suisani <sickpig@opinioni.net> wrote:
>> it seems strange that disabling
>> HT from the bios will give lesser TPS that HT disable through
>> sysfs interface.
>
> It does prove they're not equivalent though.
>

sure you're right.

It's just that my bet was on a higher throughput
when HT was isabled from the BIOS (as you stated
previously in this thread).

Andrea
On Mon, Oct 15, 2012 at 12:24 PM, Andrea Suisani <sickpig@opinioni.net> wrote:
>> It does prove they're not equivalent though.
>>
>
> sure you're right.
>
> It's just that my bet was on a higher throughput
> when HT was isabled from the BIOS (as you stated
> previously in this thread).

Yes, mine too. It's bizarre. If I were you, I'd look into it more
deeply. It may be a flaw in your test methodology (maybe you disabled
the wrong cores?). If not, it would be good to know why the extra TPS
to replicate elsewhere.
On Mon, Oct 15, 2012 at 9:01 AM, Craig James <cjames@emolecules.com> wrote:
> On Mon, Oct 15, 2012 at 1:27 AM, Andrea Suisani <sickpig@opinioni.net> wrote:
>> (I suspect that there's something wrong with the PERC
>> because, having the controller cache enabled make no
>> difference in terms of TPS), it seems strange that disabling
>> HT from the bios will give lesser TPS that HT disable through
>> sysfs interface.
>
> Well, all I can say is that I like my 3WARE controllers, and it's the
> secondary reason why I moved away from Dell (the primary reason is
> price).

Mediocre performance, random lockups, and Dell's refusal to address
said lockups are the reasons I abandoned Dell's PERC controllers.  My
preference is Areca 1680/1880, then 3Ware 96xx, then LSI, then
Adaptec.  Areca's web interface on a dedicated ethernet port make them
super easy to configure while the machine is running with no need for
specialized software for a given OS, and they're performance and
reliability are great.  The 3Wares are very solid with later model
BIOS on board.  LSI gets a rasberry for MegaCLI, the 2nd klunkiest
interface ever, the worst being their horrible horrible BIOS boot
setup screen.
On Mon, Oct 15, 2012 at 9:28 AM, Claudio Freire <klaussfreire@gmail.com> wrote:
> On Mon, Oct 15, 2012 at 12:24 PM, Andrea Suisani <sickpig@opinioni.net> wrote:
>> sure you're right.
>>
>> It's just that my bet was on a higher throughput
>> when HT was isabled from the BIOS (as you stated
>> previously in this thread).
>
> Yes, mine too. It's bizarre. If I were you, I'd look into it more
> deeply. It may be a flaw in your test methodology (maybe you disabled
> the wrong cores?). If not, it would be good to know why the extra TPS
> to replicate elsewhere.

I'd recommend more synthetic benchmarks when trying to compare systems
like this.  bonnie++, the memory stream test that Greg Smith was
working on, and so on.  Get an idea what core differences the machines
display under such testing.
[cut]


>> TPS including connection establishing, pgbench run in a single
>> thread mode, connection made through unix socket, OS cache dropped
>> and Postgres restarted for every run.
>>
>> those are the results:
>>
>>                 HT        HT SYSFS DIS    HT BIOS DISABLE
>> -c -t     r1   r2   r3    r1   r2   r3    r1   r2   r3
>> 5  20K   1641 1831 1496  2020 1974 2033  2005 1988 1967
>> 10 10K   2161 2134 2136  2277 2252 2216  1854 1824 1810
>> 20 5k    2550 2508 2558  2417 2388 2357  1924 1928 1954
>> 30 3333  2216 2272 2250  2333 2493 2496  1993 2009 2008
>> 40 2.5K  2179 2221 2250  2568 2535 2500  2025 2048 2018
>> 50 2K    2217 2213 2213  2487 2449 2604  2112 2016 2023
>>
>> Despite the fact the results don't match my expectation
>
> You have a RAID1 with 15K SAS disks.  I have a RAID10 with 8 7200 SATA
> disks plus another RAID1 for the XLOG file system.  Ten 7K SATA disks
> on two file systems should be quite a bit faster than two 15K SAS
> disks, right?

I think you're right. But I never have the chance to try such
a configuration in first person. But, yes, spreading I/O on two
different subsystems (xlog and pgdata) and having pgdata on
a RAID10 should surely outperform my RAID1 with 15K SAS disks.

>> (I suspect that there's something wrong with the PERC
>> because, having the controller cache enabled make no
>> difference in terms of TPS), it seems strange that disabling
>> HT from the bios will give lesser TPS that HT disable through
>> sysfs interface.
>
> Well, all I can say is that I like my 3WARE controllers, and it's the
> secondary reason why I moved away from Dell (the primary reason is
> price).

Something I surely will take into account the next time
I will buy a new server.

Andrea
On 10/15/2012 05:28 PM, Claudio Freire wrote:
> On Mon, Oct 15, 2012 at 12:24 PM, Andrea Suisani <sickpig@opinioni.net> wrote:
>>> It does prove they're not equivalent though.
>>>
>>
>> sure you're right.
>>
>> It's just that my bet was on a higher throughput
>> when HT was isabled from the BIOS (as you stated
>> previously in this thread).
>
> Yes, mine too. It's bizarre. If I were you, I'd look into it more
> deeply. It may be a flaw in your test methodology (maybe you disabled
> the wrong cores?).

this is the first thing I thought after looking at the results
but I've double-checked cores topology (core_id, core_siblings_list end
friends under /sys/devices/system/cpu/cpu0/topology) and I seems
to me that I've disabled the right ones.

It could be that I've messed up with something else...

 > If not, it would be good to know why the extra TPS
> to replicate elsewhere.

definitely I will try to understand the
probable causes performing other tests...
any hints are welcome :)


>
On 10/15/2012 05:34 PM, Scott Marlowe wrote:
> On Mon, Oct 15, 2012 at 9:28 AM, Claudio Freire <klaussfreire@gmail.com> wrote:
>> On Mon, Oct 15, 2012 at 12:24 PM, Andrea Suisani <sickpig@opinioni.net> wrote:
>>> sure you're right.
>>>
>>> It's just that my bet was on a higher throughput
>>> when HT was isabled from the BIOS (as you stated
>>> previously in this thread).
>>
>> Yes, mine too. It's bizarre. If I were you, I'd look into it more
>> deeply. It may be a flaw in your test methodology (maybe you disabled
>> the wrong cores?). If not, it would be good to know why the extra TPS
>> to replicate elsewhere.
>
> I'd recommend more synthetic benchmarks when trying to compare systems
> like this.  bonnie++, the memory stream test that Greg Smith was
> working on, and so on.  Get an idea what core differences the machines
> display under such testing.
>

Will try tomorrow
thanks for the hint

Andrea
On 15.10.2012 17:01, Craig James wrote:
>>>> On Thu, Oct 11, 2012 at 11:14 AM, Andrea Suisani <sickpig@opinioni.net>
>>>> wrote:
>>>>> I've googled a bit and I've found a way to disable hyperthreading
>>>>> without
>>>>> the need to reboot the system and entering the bios:
>>>>>
>>>>> echo 0 >/sys/devices/system/node/node0/cpuX/online

A safer method is probably to just add the "noht" kernel boot option and
reboot.

Did you set the same stride / stripe-width values on your FS when you
initialized them? Are both really freshly-made ext4 FS and not e.g. the
old one an ext3 mounted as ext4? Do all the disks have the same cache,
link speed and NCQ settings (for their own caches, not the controller;
try /c0/p0 show all etc. with tw_cli)?

-mjy
On 10/15/2012 05:34 PM, Scott Marlowe wrote:
> On Mon, Oct 15, 2012 at 9:28 AM, Claudio Freire <klaussfreire@gmail.com> wrote:
>> On Mon, Oct 15, 2012 at 12:24 PM, Andrea Suisani <sickpig@opinioni.net> wrote:
>>> sure you're right.
>>>
>>> It's just that my bet was on a higher throughput
>>> when HT was isabled from the BIOS (as you stated
>>> previously in this thread).
>>
>> Yes, mine too. It's bizarre. If I were you, I'd look into it more
>> deeply. It may be a flaw in your test methodology (maybe you disabled
>> the wrong cores?). If not, it would be good to know why the extra TPS
>> to replicate elsewhere.
>
> I'd recommend more synthetic benchmarks when trying to compare systems
> like this.  bonnie++,

you were right. bonnie++ (-f -n 0 -c 4) show that there's very little (if any)
difference in terms of sequential input whether or not cache is enabled on the
RAID1 (SAS 15K, sdb).

I've run 2 bonnie++ test with both cache enabled and disabled and what I get
(see attachments for more details) it's a 400MB/s sequential input (cache) vs
390MBs (nocache).

I dunno why but I would have expected a higher delta (due to the 512MB cache)
not a mere 10MB/s, but this is only based on my gut feeling.

I've also tried to test RAID1 array where the OS is installed (2 SATA 7.2Krpm, sda)
just to verify if cache effect is comparable with the one I get from SAS disks.

Well it seems that there's no cache effects or if it's is there is so small as to be
confused with the noise.

Both array are configured with this params

Read Policy               : Adaptive Read Ahead
Write Policy              : Write Back
Stripe Element Size       : 64 KB
Disk Cache Policy         : Disabled

those tests are performed with HT disable from the BIOS, but without
using noht kernel boot param. the scheduler for sdb was setted to deadline
while the default cfq for sda.

>  the memory stream test that Greg Smith was
> working on, and so on.

this one https://github.com/gregs1104/stream-scaling, right?

I've executed the test with HT enabled, HT disabled from the BIOS
and HT disable using sys interface. Attached 3 graphs and related
text files


> Get an idea what core differences the machines
> display under such testing.

I'm trying... hard :)

Andrea
Attachment
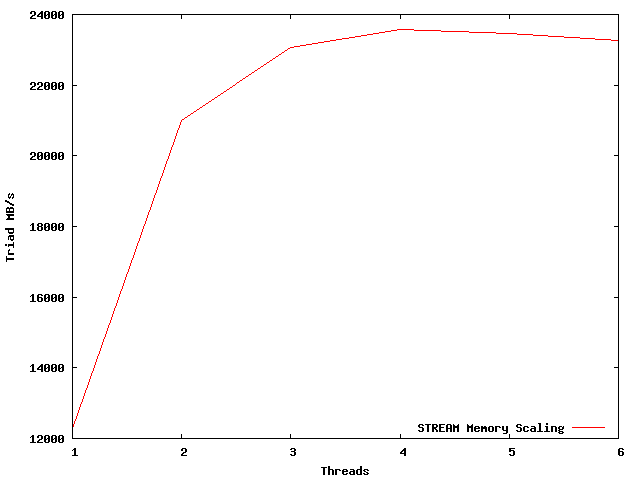
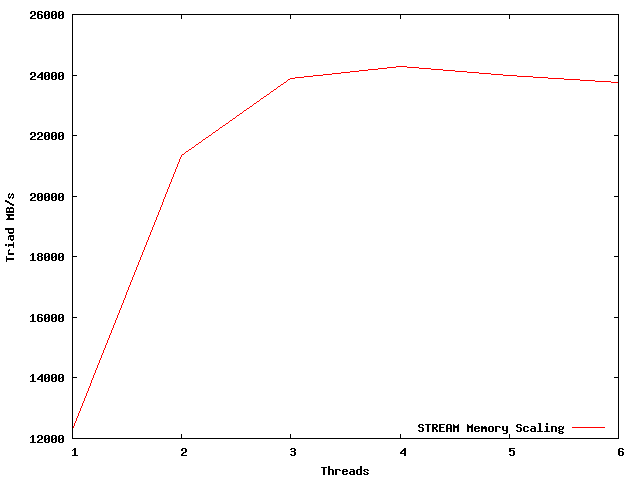
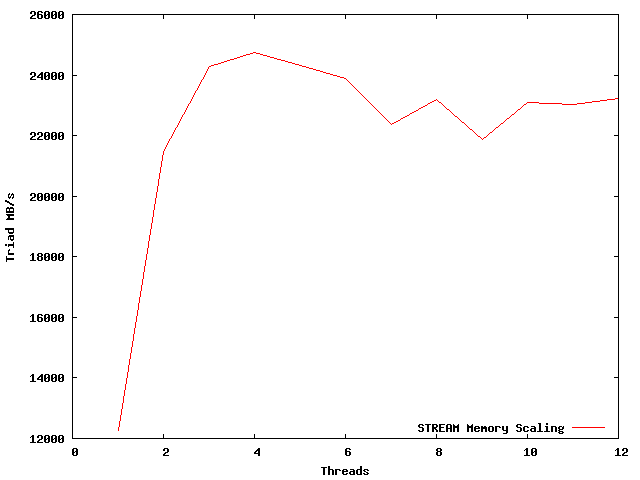
On Wed, Oct 17, 2012 at 9:45 AM, Andrea Suisani <sickpig@opinioni.net> wrote:
> On 10/15/2012 05:34 PM, Scott Marlowe wrote:
>> I'd recommend more synthetic benchmarks when trying to compare systems
>> like this.  bonnie++,
>
>
> you were right. bonnie++ (-f -n 0 -c 4) show that there's very little (if
> any)
> difference in terms of sequential input whether or not cache is enabled on
> the
> RAID1 (SAS 15K, sdb).

I'm mainly wanting to know the difference between the two systems, so
if you can run it on the old and new machine and compare that that's
the real test.

> I've run 2 bonnie++ test with both cache enabled and disabled and what I get
> (see attachments for more details) it's a 400MB/s sequential input (cache)
> vs
> 390MBs (nocache).
>
> I dunno why but I would have expected a higher delta (due to the 512MB
> cache)
> not a mere 10MB/s, but this is only based on my gut feeling.

Well the sequential throughput doesn't really rely on caching.  It's
the random writes that benefit from caching, and the other things
(random reads and seq read/write) that indirectly benefit because the
random writes are so much faster that they no longer get in the way.
So mostly compare random access between the old and new machines and
look for differences there.
>>  the memory stream test that Greg Smith was
>> working on, and so on.
>
>
> this one https://github.com/gregs1104/stream-scaling, right?

Yep.

> I've executed the test with HT enabled, HT disabled from the BIOS
> and HT disable using sys interface. Attached 3 graphs and related
> text files

Well it's pretty meh.  I'd like to see the older machine compared to
the newer one here tho.

> I'm trying... hard :)

You're doing great.  These problems take effort to sort out.
On 10/17/2012 06:35 PM, Scott Marlowe wrote:
> On Wed, Oct 17, 2012 at 9:45 AM, Andrea Suisani <sickpig@opinioni.net> wrote:
>> On 10/15/2012 05:34 PM, Scott Marlowe wrote:
>>> I'd recommend more synthetic benchmarks when trying to compare systems
>>> like this.  bonnie++,
>>
>>
>> you were right. bonnie++ (-f -n 0 -c 4) show that there's very little (if
>> any)
>> difference in terms of sequential input whether or not cache is enabled on
>> the
>> RAID1 (SAS 15K, sdb).

Maybe there's a misunderstanding here.. :) Craig (James) is the one
the had started this thread. I've joined later suggesting a way to
disable HT without rebooting (using sysfs interface), trying to avoid
a trip to the data-center to Craig.

At that point Claudio Freire wondering if disabling HT from sysfs
would have removed the performance penalty that Craig has experienced.

So I decided to test this on a brand new box that I've just bought.

When performing this test I've discovered by chance that
the raid controller (PERC H710) behave in an unexpected way,
cause the hw cache has almost no effect in terms of TPS in
a pgbench session.

> I'm mainly wanting to know the difference between the two systems, so
> if you can run it on the old and new machine and compare that that's
> the real test.

This is something that Craig can do.

[cut]

>> I dunno why but I would have expected a higher delta (due to the 512MB
>> cache)
>> not a mere 10MB/s, but this is only based on my gut feeling.
 >
> Well the sequential throughput doesn't really rely on caching.  It's
> the random writes that benefit from caching, and the other things
> (random reads and seq read/write) that indirectly benefit because the
> random writes are so much faster that they no longer get in the way.
> So mostly compare random access between the old and new machines and
> look for differences there.

make sense.

I will focus on tests that measure random path access.

>>>   the memory stream test that Greg Smith was
>>> working on, and so on.
>>
>>
>> this one https://github.com/gregs1104/stream-scaling, right?
>
> Yep.
>
>> I've executed the test with HT enabled, HT disabled from the BIOS
>> and HT disable using sys interface. Attached 3 graphs and related
>> text files
>
> Well it's pretty meh.

:/

do you think that Xeon Xeon 5620 perform poorly ?

> I'd like to see the older machine compared to
> the newer one here tho.

also this one is on Craig side.

>> I'm trying... hard :)
>
> You're doing great.  These problems take effort to sort out.

thanks
On Wed, Oct 17, 2012 at 11:57 PM, Andrea Suisani <sickpig@opinioni.net> wrote:
> On 10/17/2012 06:35 PM, Scott Marlowe wrote:
>>
>> On Wed, Oct 17, 2012 at 9:45 AM, Andrea Suisani <sickpig@opinioni.net>
>> wrote:
>>>
>>> On 10/15/2012 05:34 PM, Scott Marlowe wrote:
>>>>
>>>> I'd recommend more synthetic benchmarks when trying to compare systems
>>>> like this.  bonnie++,
>>>
>>>
>>>
>>> you were right. bonnie++ (-f -n 0 -c 4) show that there's very little (if
>>> any)
>>> difference in terms of sequential input whether or not cache is enabled
>>> on
>>> the
>>> RAID1 (SAS 15K, sdb).
>
>
> Maybe there's a misunderstanding here.. :) Craig (James) is the one
> the had started this thread. I've joined later suggesting a way to
> disable HT without rebooting (using sysfs interface), trying to avoid
> a trip to the data-center to Craig.
>
> At that point Claudio Freire wondering if disabling HT from sysfs
> would have removed the performance penalty that Craig has experienced.
>
> So I decided to test this on a brand new box that I've just bought.
>
> When performing this test I've discovered by chance that
> the raid controller (PERC H710) behave in an unexpected way,
> cause the hw cache has almost no effect in terms of TPS in
> a pgbench session.
>
>> I'm mainly wanting to know the difference between the two systems, so
>> if you can run it on the old and new machine and compare that that's
>> the real test.
>
>
> This is something that Craig can do.

Too late ... the new machine is in production.

Craig

>
> [cut]
>
>>> I dunno why but I would have expected a higher delta (due to the 512MB
>>> cache)
>>> not a mere 10MB/s, but this is only based on my gut feeling.
>
>>
>>
>> Well the sequential throughput doesn't really rely on caching.  It's
>> the random writes that benefit from caching, and the other things
>> (random reads and seq read/write) that indirectly benefit because the
>> random writes are so much faster that they no longer get in the way.
>> So mostly compare random access between the old and new machines and
>> look for differences there.
>
>
> make sense.
>
> I will focus on tests that measure random path access.
>
>>>>   the memory stream test that Greg Smith was
>>>> working on, and so on.
>>>
>>>
>>>
>>> this one https://github.com/gregs1104/stream-scaling, right?
>>
>>
>> Yep.
>>
>>> I've executed the test with HT enabled, HT disabled from the BIOS
>>> and HT disable using sys interface. Attached 3 graphs and related
>>> text files
>>
>>
>> Well it's pretty meh.
>
>
> :/
>
> do you think that Xeon Xeon 5620 perform poorly ?
>
>> I'd like to see the older machine compared to
>> the newer one here tho.
>
>
> also this one is on Craig side.
>
>>> I'm trying... hard :)
>>
>>
>> You're doing great.  These problems take effort to sort out.
>
>
> thanks
>
>
xfs perform a lot better than ext4 [WAS: Re: Two identical systems, radically different performance]
From
Andrea Suisani
Date:
[sorry for resuming an old thread]

[cut]

>>> Question is... will that remove the performance penalty of HyperThreading?
>>
>> So I've added to my todo list to perform a test to verify this claim :)
>
> done.

on this box:

> in a brief: the box is dell a PowerEdge r720 with 16GB of RAM,
> the cpu is a Xeon 5620 with 6 core, the OS is installed on a raid
> (sata disk 7.2k rpm) and the PGDATA is on separate RAID 1 array
> (sas 15K rpm) and the controller is a PERC H710 (bbwc with a cache
> of 512 MB). (ubuntu 12.04)

with postgres 9.2.1 and $PGDATA on a ext4 formatted partition
i've got:

> those are the results:
>
>                 HT        HT SYSFS DIS    HT BIOS DISABLE
> -c -t     r1   r2   r3    r1   r2   r3    r1   r2   r3
> 5  20K   1641 1831 1496  2020 1974 2033  2005 1988 1967
> 10 10K   2161 2134 2136  2277 2252 2216  1854 1824 1810
> 20 5k    2550 2508 2558  2417 2388 2357  1924 1928 1954
> 30 3333  2216 2272 2250  2333 2493 2496  1993 2009 2008
> 40 2.5K  2179 2221 2250  2568 2535 2500  2025 2048 2018
> 50 2K    2217 2213 2213  2487 2449 2604  2112 2016 2023

on the same machine with the same configuration,
having PGDATA on a xfs formatted partition gives me
a much better TPS.

e.g. pgbench  -c 20 -t 5000 gives me 6305 TPS
(3 runs with "echo 3 > /proc/sys/vm/drop_caches && /etc/init.d/postgresql-9.2 restart"
in between).

Anybody else have experienced this kind of differences
between etx4 and xfs?

Andrea
Re: xfs perform a lot better than ext4 [WAS: Re: Two identical systems, radically different performance]
From
Jean-David Beyer
Date:
On 12/05/2012 10:34 AM, Andrea Suisani wrote:
[sorry for resuming an old thread]I thought that postgreSQL did its own journalling, if that is the proper term, so why not use an ext2 file system to lower overhead?
[cut]Question is... will that remove the performance penalty of HyperThreading?
So I've added to my todo list to perform a test to verify this claim :)
done.
on this box:in a brief: the box is dell a PowerEdge r720 with 16GB of RAM,
the cpu is a Xeon 5620 with 6 core, the OS is installed on a raid
(sata disk 7.2k rpm) and the PGDATA is on separate RAID 1 array
(sas 15K rpm) and the controller is a PERC H710 (bbwc with a cache
of 512 MB). (ubuntu 12.04)
with postgres 9.2.1 and $PGDATA on a ext4 formatted partition
i've got:those are the results:
HT HT SYSFS DIS HT BIOS DISABLE
-c -t r1 r2 r3 r1 r2 r3 r1 r2 r3
5 20K 1641 1831 1496 2020 1974 2033 2005 1988 1967
10 10K 2161 2134 2136 2277 2252 2216 1854 1824 1810
20 5k 2550 2508 2558 2417 2388 2357 1924 1928 1954
30 3333 2216 2272 2250 2333 2493 2496 1993 2009 2008
40 2.5K 2179 2221 2250 2568 2535 2500 2025 2048 2018
50 2K 2217 2213 2213 2487 2449 2604 2112 2016 2023
on the same machine with the same configuration,
having PGDATA on a xfs formatted partition gives me
a much better TPS.
e.g. pgbench -c 20 -t 5000 gives me 6305 TPS
(3 runs with "echo 3 > /proc/sys/vm/drop_caches && /etc/init.d/postgresql-9.2 restart"
in between).
Anybody else have experienced this kind of differences
between etx4 and xfs?
Andrea
Re: xfs perform a lot better than ext4 [WAS: Re: Two identical systems, radically different performance]
From
Claudio Freire
Date:
On Wed, Dec 5, 2012 at 1:51 PM, Jean-David Beyer <jeandavid8@verizon.net> wrote:
> I thought that postgreSQL did its own journalling, if that is the proper
> term, so why not use an ext2 file system to lower overhead?

Because you can still have metadata-level corruption.
Re: xfs perform a lot better than ext4 [WAS: Re: Two identical systems, radically different performance]
From
Andrew Dunstan
Date:
On 12/05/2012 11:51 AM, Jean-David Beyer wrote:
>>
>>
> I thought that postgreSQL did its own journalling, if that is the
> proper term, so why not use an ext2 file system to lower overhead?


Postgres journalling will not save you from a corrupt file system.

cheers

andrew
Re: xfs perform a lot better than ext4 [WAS: Re: Two identical systems, radically different performance]
From
John Lister
Date:
> on this box:
>
>> in a brief: the box is dell a PowerEdge r720 with 16GB of RAM,
>> the cpu is a Xeon 5620 with 6 core, the OS is installed on a raid
>> (sata disk 7.2k rpm) and the PGDATA is on separate RAID 1 array
>> (sas 15K rpm) and the controller is a PERC H710 (bbwc with a cache
>> of 512 MB). (ubuntu 12.04)
>
> on the same machine with the same configuration,
> having PGDATA on a xfs formatted partition gives me
> a much better TPS.
>
> e.g. pgbench  -c 20 -t 5000 gives me 6305 TPS
> (3 runs with "echo 3 > /proc/sys/vm/drop_caches &&
> /etc/init.d/postgresql-9.2 restart"
> in between).
Hi, I found this interesting as I'm trying to do some benchmarks on my
box which is very similar to the above but I don't believe the tps is
any where near what it should be. Is the 6305 figure from xfs? I'm
assuming that your main data array is just 2 15k sas drives, are you
putting the WAL on the data array or is that stored somewhere else? Can
I ask what scaling params, etc you used to build the pgbench tables and
look at your postgresql.conf file to see if I missed something (offline
if you wish)

I'm running 8x SSDs in RAID 10 for the data and pull just under 10k on a
xfs system which is much lower than I'd expect for that setup and isn't
significantly greater than your reported results, so something must be
very wrong.

Thanks

John
Re: xfs perform a lot better than ext4 [WAS: Re: Two identical systems, radically different performance]
From
Andrea Suisani
Date:
Hi John,

On 12/06/2012 09:29 AM, John Lister wrote:
>
>> on this box:
>>
>>> in a brief: the box is dell a PowerEdge r720 with 16GB of RAM,
>>> the cpu is a Xeon 5620 with 6 core, the OS is installed on a raid
>>> (sata disk 7.2k rpm) and the PGDATA is on separate RAID 1 array
>>> (sas 15K rpm) and the controller is a PERC H710 (bbwc with a cache
>>> of 512 MB). (ubuntu 12.04)
>>
>> on the same machine with the same configuration,
>> having PGDATA on a xfs formatted partition gives me
>> a much better TPS.
>>
>> e.g. pgbench  -c 20 -t 5000 gives me 6305 TPS
>> (3 runs with "echo 3 > /proc/sys/vm/drop_caches && /etc/init.d/postgresql-9.2 restart"
>> in between).


> Hi, I found this interesting as I'm trying to do some benchmarks on my box which is
 > very similar to the above but I don't believe the tps is any where near what it should be.
 > Is the 6305 figure from xfs?

yes, it is.

> I'm assuming that your main data array is just 2 15k sas drives,

correct

> are you putting the WAL on the data array or is that stored somewhere else?

pg_xlog is placed in the data array.

> Can I ask what scaling params,

sure, I've initialized pgbench db issuing:

pgbench -i -s 10 pgbench

> etc you used to build the pgbench tables and look at your postgresql.conf file to see if I missed something (offline
ifyou wish)

those are non default values in postgresql.conf

listen_addresses = '*'
max_connections = 100
shared_buffers = 3200MB
work_mem = 30MB
maintenance_work_mem = 800MB
synchronous_commit = off
full_page_writes = off
checkpoint_segments = 40
checkpoint_completion_target = 0.9
random_page_cost = 3.5
effective_cache_size = 10GB
log_timezone = 'localtime'
stats_temp_directory = 'pg_stat_tmp_ram'
autovacuum_naptime = 5min

and then OS tweaks:

HT bios disabled
/sbin/blockdev --setra 8192 /dev/sdb
echo deadline > /sys/block/sdb/queue/scheduler
vm.swappiness=0
vm.overcommit_memory=2
vm.dirty_ratio=2
vm.dirty_background_ratio=1
kernel.shmmax=3454820352
kernel.shmall=2048341
$PGDATA is on xfs (rw,noatime)
tmpfs on /db/9.2/pg_stat_tmp_ram type tmpfs (rw,size=50M,uid=1001,gid=1001)
kernel 3.2.0-32-generic


Andrea
Re: xfs perform a lot better than ext4 [WAS: Re: Two identical systems, radically different performance]
From
Andrea Suisani
Date:
[added performance list back]

On 12/06/2012 10:04 AM, John Lister wrote:
> Thanks for the info, I'll have a play and see what values I get with similar settings, etc

you're welcome

> Still think something is wrong with my config, but we'll see.

which kind of ssd disks do you have ?
maybe they are of the same typeShaun Thomas is having problem with here:
http://archives.postgresql.org/pgsql-performance/2012-12/msg00030.php

Andrea


> john
>
> On 06/12/2012 08:44, Andrea Suisani wrote:
>> Hi John,
>>
>> On 12/06/2012 09:29 AM, John Lister wrote:
>>>
>>>> on this box:
>>>>
>>>>> in a brief: the box is dell a PowerEdge r720 with 16GB of RAM,
>>>>> the cpu is a Xeon 5620 with 6 core, the OS is installed on a raid
>>>>> (sata disk 7.2k rpm) and the PGDATA is on separate RAID 1 array
>>>>> (sas 15K rpm) and the controller is a PERC H710 (bbwc with a cache
>>>>> of 512 MB). (ubuntu 12.04)
>>>>
>>>> on the same machine with the same configuration,
>>>> having PGDATA on a xfs formatted partition gives me
>>>> a much better TPS.
>>>>
>>>> e.g. pgbench  -c 20 -t 5000 gives me 6305 TPS
>>>> (3 runs with "echo 3 > /proc/sys/vm/drop_caches && /etc/init.d/postgresql-9.2 restart"
>>>> in between).
>>
>>
>>> Hi, I found this interesting as I'm trying to do some benchmarks on my box which is
>> > very similar to the above but I don't believe the tps is any where near what it should be.
>> > Is the 6305 figure from xfs?
>>
>> yes, it is.
>>
>>> I'm assuming that your main data array is just 2 15k sas drives,
>>
>> correct
>>
>>> are you putting the WAL on the data array or is that stored somewhere else?
>>
>> pg_xlog is placed in the data array.
>>
>>> Can I ask what scaling params,
>>
>> sure, I've initialized pgbench db issuing:
>>
>> pgbench -i -s 10 pgbench
>>
>>> etc you used to build the pgbench tables and look at your postgresql.conf file to see if I missed something
(offlineif you wish)
>>
>> those are non default values in postgresql.conf
>>
>> listen_addresses = '*'
>> max_connections = 100
>> shared_buffers = 3200MB
>> work_mem = 30MB
>> maintenance_work_mem = 800MB
>> synchronous_commit = off
>> full_page_writes = off
>> checkpoint_segments = 40
>> checkpoint_completion_target = 0.9
>> random_page_cost = 3.5
>> effective_cache_size = 10GB
>> log_timezone = 'localtime'
>> stats_temp_directory = 'pg_stat_tmp_ram'
>> autovacuum_naptime = 5min
>>
>> and then OS tweaks:
>>
>> HT bios disabled
>> /sbin/blockdev --setra 8192 /dev/sdb
>> echo deadline > /sys/block/sdb/queue/scheduler
>> vm.swappiness=0
>> vm.overcommit_memory=2
>> vm.dirty_ratio=2
>> vm.dirty_background_ratio=1
>> kernel.shmmax=3454820352
>> kernel.shmall=2048341
>> $PGDATA is on xfs (rw,noatime)
>> tmpfs on /db/9.2/pg_stat_tmp_ram type tmpfs (rw,size=50M,uid=1001,gid=1001)
>> kernel 3.2.0-32-generic
>>
>>
>> Andrea
>>
>>
>
>
Re: xfs perform a lot better than ext4 [WAS: Re: Two identical systems, radically different performance]
From
John Lister
Date:
On 06/12/2012 09:33, Andrea Suisani wrote:
>
> which kind of ssd disks do you have ?
> maybe they are of the same typeShaun Thomas is having problem with here:
> http://archives.postgresql.org/pgsql-performance/2012-12/msg00030.php
Yeah i saw that post, I'm running the same version of ubuntu with the
3.2 kernel, so when I get a chance to take it down will try the new
kernels, although ubuntu are on 3.5 now... Shaun didn't post what
hardware he was running on, so it would be interesting to see how it
compares. They are intel 320s, which while not the newest should offer
some protection against power failure, etc


John
Re: Re: xfs perform a lot better than ext4 [WAS: Re: Two identical systems, radically different performance]
From
Andrea Suisani
Date:
On 12/06/2012 12:37 PM, John Lister wrote:
> On 06/12/2012 09:33, Andrea Suisani wrote:
>>
>> which kind of ssd disks do you have ?
>> maybe they are of the same typeShaun Thomas is having problem with here:
>> http://archives.postgresql.org/pgsql-performance/2012-12/msg00030.php
> Yeah i saw that post, I'm running the same version of ubuntu with the 3.2 kernel, so when I get a chance to take it
downwill try the new kernels, although ubuntu are on 3.5 now... Shaun didn't post what hardware he was running on, so
itwould be interesting to see how it compares. They are intel
> 320s, which while not the newest should offer some protection against power failure, etc

reading again the thread I realized Shaun is using
fusionIO driver and he said that the regression is due
to "some recent 3.2 kernel patch borks the driver in
some horrible way".

so maybe you're not on the same boat (since you're
using intel 320), or maybe the kernel regression
he's referring to is related to the kernel subsystem
that deal with ssd disks independently from brands.
In the latter case testing a different kernel would be worthy.

Andrea