Thread: Very slow query performance when using CTE
Hello,
I have an issue when using CTEs. A query, which consists of multiple CTEs, runs usually rather fast (~5s on my environment). But it turned out that using one CTE can lead to execution times of up to one minute.
That CTE is used two times within the query. In the CTE there are 2600 rows, compared to results of the other CTEs its a fraction of the data.
When replacing this CTE and use the original table instead in the jions, the query performs nicely.
However, it is not always like this. Running the same query on a almost same set of data, quantity wise, may give indeed good performance when using that CTE.
This is the slow performing query using CTE:
And this is the fast performing query without that CTE:
The query runs on the very same environment and data.
What can be the issue here and how can I address it?
Chris Joysn <joysn71@gmail.com> writes:
> I have an issue when using CTEs. A query, which consists of multiple CTEs,
> runs usually rather fast (~5s on my environment). But it turned out that
> using one CTE can lead to execution times of up to one minute.
> That CTE is used two times within the query.

Try labeling that CTE as NOT MATERIALIZED.

            regards, tom lane
Chris Joysn <joysn71@gmail.com> writes:

> Hello,
> I have an issue when using CTEs. A query, which consists of multiple CTEs, runs usually rather fast (~5s on my
> environment). But it turned out that using one CTE can lead to execution times of up to one minute.
> That CTE is used two times within the query. In the CTE there are 2600 rows, compared to results of the other CTEs
itsa

> fraction of the data.
> When replacing this CTE and use the original table instead in the jions, the query performs nicely.
> However, it is not always like this. Running the same query on a almost same set of data, quantity wise, may give
indeed
> good performance when using that CTE.
> This is the slow performing query using CTE:
> https://explain.dalibo.com/plan/45ce86d9cfge14c7
> And this is the fast performing query without that CTE:
> https://explain.dalibo.com/plan/4abgc4773gg349b4
>
> The query runs on the very same environment and data.
> What can be the issue here and how can I address it?


Hi,

the planner gets really bad estimates on the number of rows that the
first two CTE return. It is the same situation in both queries. It is
just an accident that one of them works fine.

We need to understand why these estimates are wrong. The protocol to fix
this kind of issues is to apply ANALYZE so that the statistics get
update. You can try that, but my guess is that we are dealing with a
generic plan here. So, try to replace the value of $simRunId by the
actual value and see if the plan changes.

Best regards,
Renan
unfortunately that increased the query execution time by a factor of 8:
On Tue, 1 Apr 2025 at 16:28, Tom Lane <tgl@sss.pgh.pa.us> wrote:
Chris Joysn <joysn71@gmail.com> writes:
> I have an issue when using CTEs. A query, which consists of multiple CTEs,
> runs usually rather fast (~5s on my environment). But it turned out that
> using one CTE can lead to execution times of up to one minute.
> That CTE is used two times within the query.
Try labeling that CTE as NOT MATERIALIZED.
regards, tom lane
I tried to create multi variate statistics for the table in question:
CREATE STATISTICS st_simrun_component_metadata (dependencies) ON sim_run_id, key FROM sim_run_component_metadata;
ANALYZE sim_run_component_metadata;
When I run this query, no statistics are returned:
SELECT m.* FROM pg_statistic_ext join pg_statistic_ext_data on (oid = stxoid),
pg_mcv_list_items(stxdmcv) m WHERE stxname = 'st_simrun_component_metadata';
Is there something I might have missed?
What I do not understand is:
The fetch from the table is rather fast. some milliseconds. But a subsequent sort operations takes very long time, for the amount of records fetched.
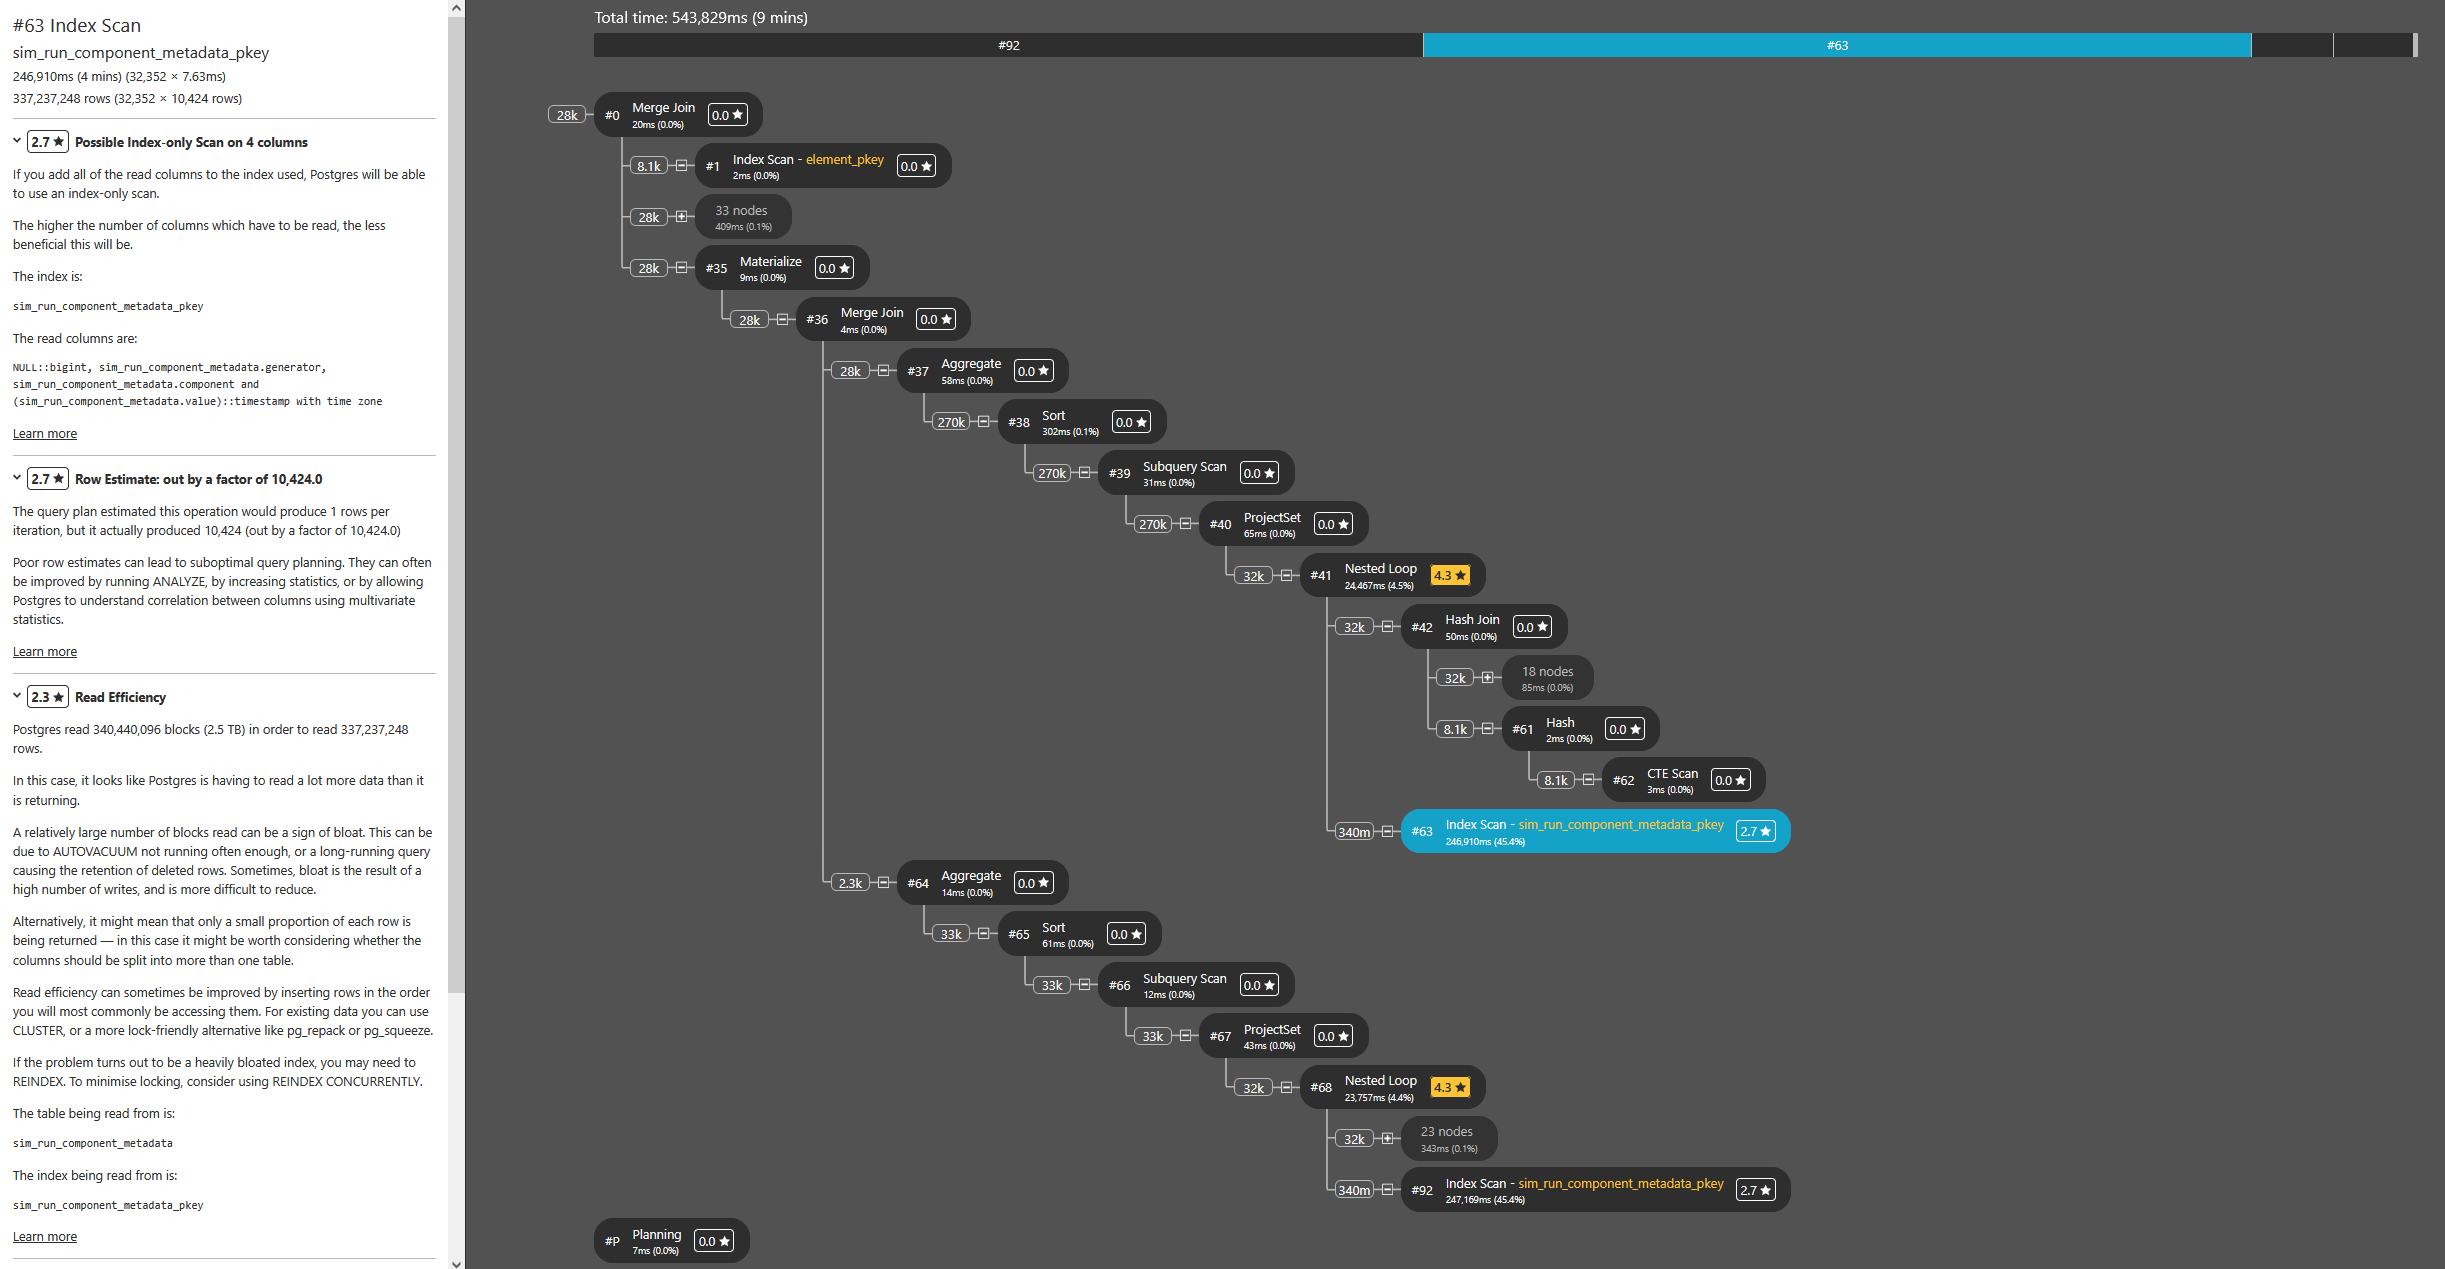
I used pgMustard to check the execution plans and give some hints. But, just like the estimated rows in the plan, it does not match the real amount of available data in the table:
On Wed, 2 Apr 2025 at 13:38, Renan Alves Fonseca <renanfonseca@gmail.com> wrote:
Clearly, the statistics collected for those tables are not good
enough. You can see the estimated frequency for the most common values
with the following query:
select attname, most_common_vals, most_common_freqs
from pg_stats
where tablename = 'samples' and attname in (values ('i'),('j'));
Replace 'samples' and 'i','j' by the table name and columns you want to inspect.
Then you can try to improve the quality of these statistics:
set default_statistics_target = 10000;
analyze [your-table];
I hope this solve the problem in the case of a simple WHERE
clause. Then, you can also create multivariate statistics to handle
complex WHERE clauses.
See https://www.postgresql.org/docs/current/multivariate-statistics-examples.html#MCV-LISTS
Best regards,
Renan
Chris Joysn <joysn71@gmail.com> writes:
> I analyzed all tables which are involved in the query, additionally I added an index to the table and columns which are
> relevant for the query on the CTE.
> I declared that CTE as not materialzed as well.
> The table in question has 1.7mio records, and the query fetches 10400 of those rows.
> But the amount of estimated rows is way off that numbers.
> The access of the table using index scan improved quite a lot compared to the previous approach, but sorting that
> intermediate result remains very costly:
> https://explain.dalibo.com/plan/3h20dce4ge93ca71
>
> btw: following environment:
> PostgreSQL 16.6 on x86_64-pc-linux-musl, compiled by gcc (Alpine 14.2.0) 14.2.0, 64-bit
> |name|current_setting|source|
> |----|---------------|------|
> |autovacuum_max_workers|10|configuration file|
> |autovacuum_naptime|10s|configuration file|
> |checkpoint_completion_target|0.9|configuration file|
> |client_encoding|UTF8|client|
> |DateStyle|ISO, MDY|client|
> |default_statistics_target|100|configuration file|
> |default_text_search_config|pg_catalog.english|configuration file|
> |default_toast_compression|lz4|configuration file|
> |dynamic_shared_memory_type|posix|configuration file|
> |effective_cache_size|48241MB|configuration file|
> |effective_io_concurrency|256|configuration file|
> |extra_float_digits|3|session|
> |jit|off|configuration file|
> |lc_messages|en_US.utf8|configuration file|
> |lc_monetary|en_US.utf8|configuration file|
> |lc_numeric|en_US.utf8|configuration file|
> |lc_time|en_US.utf8|configuration file|
> |listen_addresses|*|configuration file|
> |log_timezone|UTC|configuration file|
> |maintenance_work_mem|2047MB|configuration file|
> |max_connections|100|configuration file|
> |max_locks_per_transaction|1024|configuration file|
> |max_parallel_workers|16|configuration file|
> |max_parallel_workers_per_gather|4|configuration file|
> |max_wal_size|1GB|configuration file|
> |max_worker_processes|27|configuration file|
> |min_wal_size|512MB|configuration file|
> |random_page_cost|1.1|configuration file|
> |search_path|public, public, "$user"|session|
> |shared_buffers|16080MB|configuration file|
> |tcp_keepalives_idle|5|configuration file|
> |timescaledb.last_tuned|2025-02-10T08:58:31Z|configuration file|
> |timescaledb.last_tuned_version|0.18.0|configuration file|
> |timescaledb.max_background_workers|16|configuration file|
> |timescaledb.telemetry_level|basic|configuration file|
> |TimeZone|Europe/Vienna|client|
> |wal_buffers|16MB|configuration file|
> |work_mem|20582kB|configuration file|
>
> On Tue, 1 Apr 2025 at 22:03, Renan Alves Fonseca <renanfonseca@gmail.com> wrote:
>
> Chris Joysn <joysn71@gmail.com> writes:
>
> > Hello,
> > I have an issue when using CTEs. A query, which consists of multiple CTEs, runs usually rather fast (~5s on my
> > environment). But it turned out that using one CTE can lead to execution times of up to one minute.
> > That CTE is used two times within the query. In the CTE there are 2600 rows, compared to results of the other CTEs
> its a
> > fraction of the data.
> > When replacing this CTE and use the original table instead in the jions, the query performs nicely.
> > However, it is not always like this. Running the same query on a almost same set of data, quantity wise, may give
> indeed
> > good performance when using that CTE.
> > This is the slow performing query using CTE:
> > https://explain.dalibo.com/plan/45ce86d9cfge14c7
> > And this is the fast performing query without that CTE:
> > https://explain.dalibo.com/plan/4abgc4773gg349b4
> >
> > The query runs on the very same environment and data.
> > What can be the issue here and how can I address it?
>
> Hi,
>
> the planner gets really bad estimates on the number of rows that the
> first two CTE return. It is the same situation in both queries. It is
> just an accident that one of them works fine.
>
> We need to understand why these estimates are wrong. The protocol to fix
> this kind of issues is to apply ANALYZE so that the statistics get
> update. You can try that, but my guess is that we are dealing with a
> generic plan here. So, try to replace the value of $simRunId by the
> actual value and see if the plan changes.
>
> Best regards,
> Renan
Attachment
CREATE STATISTICS st_simrun_component_metadata (dependencies) ON sim_run_id, key FROM sim_run_component_metadata;ANALYZE sim_run_component_metadata;When I run this query, no statistics are returned:SELECT m.* FROM pg_statistic_ext join pg_statistic_ext_data on (oid = stxoid),
pg_mcv_list_items(stxdmcv) m WHERE stxname = 'st_simrun_component_metadata';
Is there something I might have missed?
It looks like you created "dependencies" statistics, but then searched for "mcv" statistics. To test if mcv helps, you could drop and recreate as: CREATE STATISTICS st_simrun_component_metadata (mcv) ...
The fetch from the table is rather fast. some milliseconds. But a subsequent sort operations takes very long time, for the amount of records fetched.
This does not seem to be the case for the slow cases you shared (those are dominated by several millisecond index scans that are looped over 32k times). So I assume you're talking about the fast case? If so, there is a Sort that takes a couple of hundred milliseconds being done on disk (~15MB) so you might also want to look into how fast that would be in memory (via work_mem).
But, just like the estimated rows in the plan, it does not match the real amount of available data in the table:
I'm not sure what you mean by this, is it only that the row estimates are still bad?
Regards,
Michael
CREATE STATISTICS st_simrun_component_metadata (dependencies) ON sim_run_id, key FROM sim_run_component_metadata;ANALYZE sim_run_component_metadata;When I run this query, no statistics are returned:SELECT m.* FROM pg_statistic_ext join pg_statistic_ext_data on (oid = stxoid),
pg_mcv_list_items(stxdmcv) m WHERE stxname = 'st_simrun_component_metadata';
Is there something I might have missed?It looks like you created "dependencies" statistics, but then searched for "mcv" statistics. To test if mcv helps, you could drop and recreate as: CREATE STATISTICS st_simrun_component_metadata (mcv) ...
oh, right. Thank you. However, I increased the statistics target to 10000, and there are some statistics in pg_statistics_ext. But I am not allowed to access pg_statistics_ext_data.
The fetch from the table is rather fast. some milliseconds. But a subsequent sort operations takes very long time, for the amount of records fetched.
This does not seem to be the case for the slow cases you shared (those are dominated by several millisecond index scans that are looped over 32k times). So I assume you're talking about the fast case? If so, there is a Sort that takes a couple of hundred milliseconds being done on disk (~15MB) so you might also want to look into how fast that would be in memory (via work_mem).
What I see in the plan is, that there is a CTE scan with 512.960.256 rows, consuming 30 seconds. The CTE result set has ~12.632 rows. I do not understand what makes the CTE scan explode so drastically.
I am refering to this plan: https://explain.dalibo.com/plan/0b6f789h973833b1
When I look at this, considering 12632 rows in the CTE:
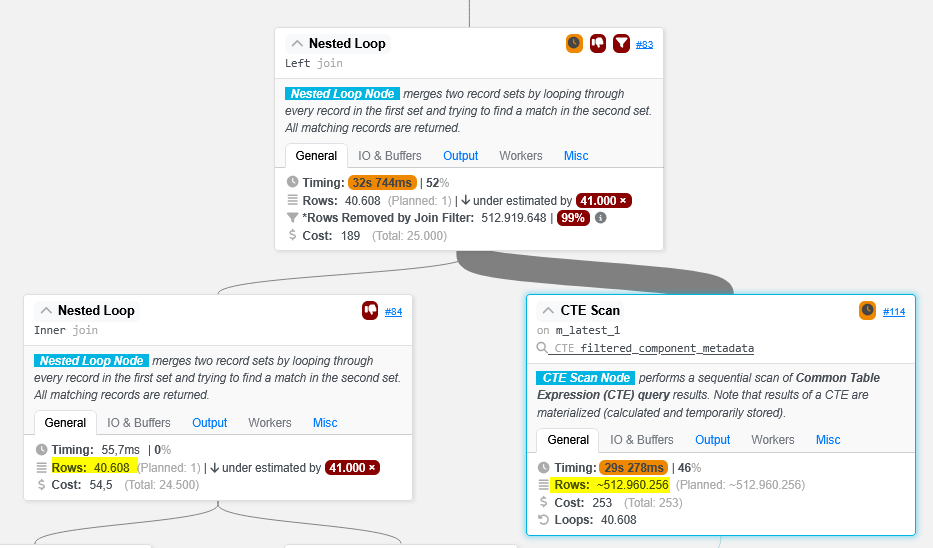
the left join is accessing / scanning the CTE result 40.608 times, and thus reads 512.960.256 rows from the CTE. On the CTE there is no index and thus a scan is needed.
When I remove that CTE and go with the real table on the join, the index is used and thus its way faster.
My naive assumption was that using CTEs in queries when their result is needed multiple times will speed up queries. But this is not the case when as this example shows. Maybe in smaller CTEs result sets, but CTEs will most likely be used in joins, and thus lead to CTE scans which have the potential to explode.
Or are there approaches to address such situations? I can not assume that the row distribution is like I face now, the query might have to deal with even larger sub result sets and way smaller ones as well.
KR
Chris