Thread: Memory leak from ExecutorState context?
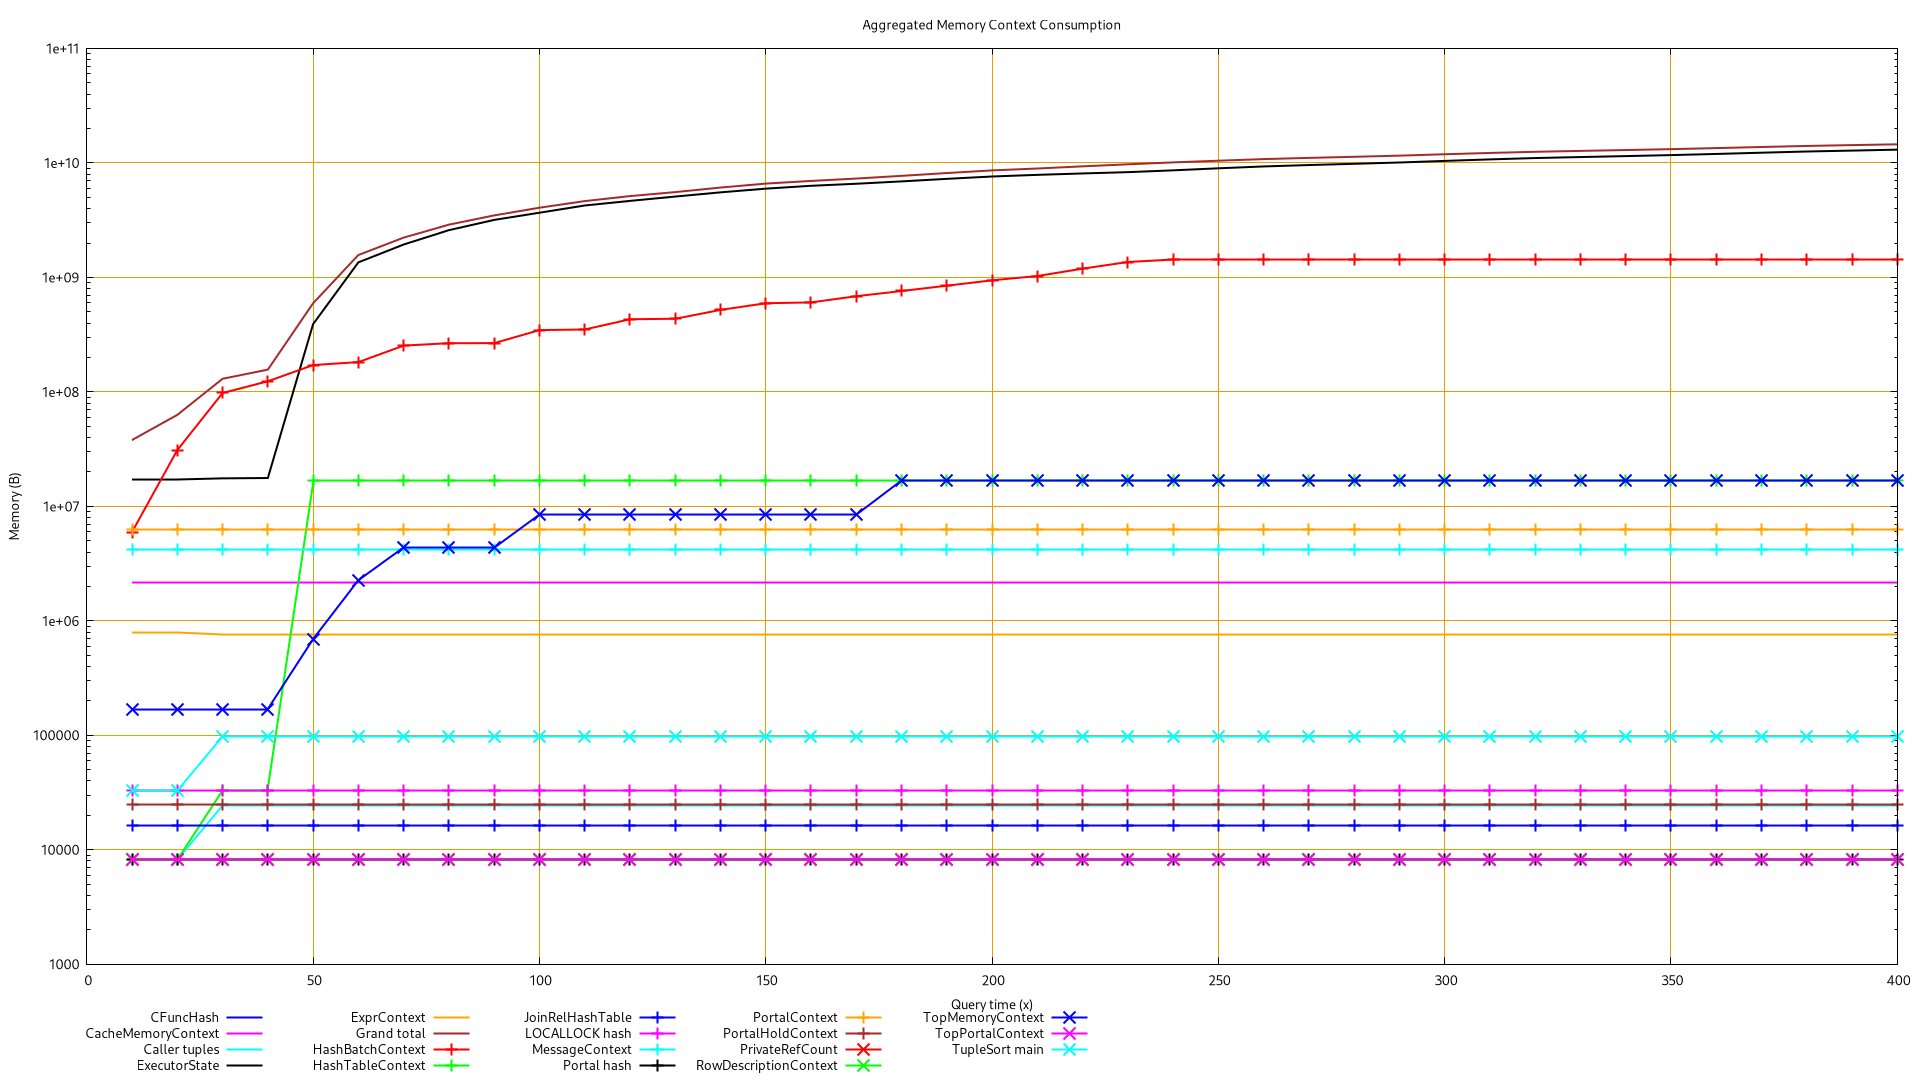
Hello all,

A customer is facing out of memory query which looks similar to this situation:

  https://www.postgresql.org/message-id/flat/12064.1555298699%40sss.pgh.pa.us#eb519865575bbc549007878a5fb7219b

This PostgreSQL version is 11.18. Some settings:

* shared_buffers: 8GB
* work_mem: 64MB
* effective_cache_size: 24GB
* random/seq_page_cost are by default
* physical memory: 32GB

The query is really large and actually update kind of a materialized view.

The customer records the plans of this query on a regular basis. The explain
analyze of this query before running out of memory was:

  https://explain.depesz.com/s/sGOH

The customer is aware he should rewrite this query to optimize it, but it's a
long time process he can not start immediately. To make it run in the meantime,
he actually removed the top CTE to a dedicated table. According to their
experience, it's not the first time they had to split a query this way to make
it work.

I've been able to run this query on a standby myself.  I've "call
MemoryContextStats(TopMemoryContext)" every 10s on a run, see the data parsed
(best view with "less -S") and the graph associated with it in attachment. It
shows:

* HashBatchContext goes up to 1441MB after 240s then stay flat until the end
  (400s as the last record)
* ALL other context are stable before 240s, but ExecutorState
* ExecutorState keeps rising up to 13GB with no interruption until the memory
  exhaustion

I did another run with interactive gdb session (see the messy log session in
attachment, for what it worth). Looking at some backtraces during the memory
inflation close to the end of the query, all of them were having these frames in
common:

  [...]
  #6  0x0000000000621ffc in ExecHashJoinImpl (parallel=false, pstate=0x31a3378)
  at nodeHashjoin.c:398 [...]

...which is not really helpful but at least, it seems to come from a hash join
node or some other hash related code. See the gdb session log for more details.
After the out of mem, pmap of this process shows:

  430:   postgres: postgres <dbname> [local] EXPLAIN
  Address           Kbytes     RSS   Dirty Mode  Mapping
  [...]
  0000000002c5e000 13719620 8062376 8062376 rw---   [ anon ]
  [...]

Is it usual a backend is requesting such large memory size (13 GB) and
actually use less of 60% of it (7.7GB of RSS)?

Sadly, the database is 1.5TB large and I can not test on a newer major version.
I did not try to check how large would be the required data set to reproduce
this, but it moves 10s of million of rows from multiple tables anyway...

Any idea? How could I help to have a better idea if a leak is actually
occurring and where exactly?

Regards,
Attachment
On Tue, Feb 28, 2023 at 07:06:43PM +0100, Jehan-Guillaume de Rorthais wrote:
> Hello all,
>
> A customer is facing out of memory query which looks similar to this situation:
>
>   https://www.postgresql.org/message-id/flat/12064.1555298699%40sss.pgh.pa.us#eb519865575bbc549007878a5fb7219b
>
> This PostgreSQL version is 11.18. Some settings:

hash joins could exceed work_mem until v13:

|Allow hash aggregation to use disk storage for large aggregation result
|sets (Jeff Davis)
|
|Previously, hash aggregation was avoided if it was expected to use more
|than work_mem memory. Now, a hash aggregation plan can be chosen despite
|that. The hash table will be spilled to disk if it exceeds work_mem
|times hash_mem_multiplier.
|
|This behavior is normally preferable to the old behavior, in which once
|hash aggregation had been chosen, the hash table would be kept in memory
|no matter how large it got — which could be very large if the planner
|had misestimated. If necessary, behavior similar to that can be obtained
|by increasing hash_mem_multiplier.

>   https://explain.depesz.com/s/sGOH

This shows multiple plan nodes underestimating the row counts by factors
of ~50,000, which could lead to the issue fixed in v13.

I think you should try to improve the estimates, which might improve
other queries in addition to this one, in addition to maybe avoiding the
issue with joins.

> The customer is aware he should rewrite this query to optimize it, but it's a
> long time process he can not start immediately. To make it run in the meantime,
> he actually removed the top CTE to a dedicated table.

Is the table analyzed ?

> Is it usual a backend is requesting such large memory size (13 GB) and
> actually use less of 60% of it (7.7GB of RSS)?

It's possible it's "using less" simply because it's not available.  Is
the process swapping ?

--
Justin
On 2/28/23 19:25, Justin Pryzby wrote:
> On Tue, Feb 28, 2023 at 07:06:43PM +0100, Jehan-Guillaume de Rorthais wrote:
>> Hello all,
>>
>> A customer is facing out of memory query which looks similar to this situation:
>>
>>   https://www.postgresql.org/message-id/flat/12064.1555298699%40sss.pgh.pa.us#eb519865575bbc549007878a5fb7219b
>>
>> This PostgreSQL version is 11.18. Some settings:
>
> hash joins could exceed work_mem until v13:
>
> |Allow hash aggregation to use disk storage for large aggregation result
> |sets (Jeff Davis)
> |

That's hash aggregate, not hash join.


regards

--
Tomas Vondra
EnterpriseDB: http://www.enterprisedb.com
The Enterprise PostgreSQL Company
On 2/28/23 19:06, Jehan-Guillaume de Rorthais wrote:
> Hello all,
>
> A customer is facing out of memory query which looks similar to this situation:
>
>   https://www.postgresql.org/message-id/flat/12064.1555298699%40sss.pgh.pa.us#eb519865575bbc549007878a5fb7219b
>
> This PostgreSQL version is 11.18. Some settings:
>
> * shared_buffers: 8GB
> * work_mem: 64MB
> * effective_cache_size: 24GB
> * random/seq_page_cost are by default
> * physical memory: 32GB
>
> The query is really large and actually update kind of a materialized view.
>
> The customer records the plans of this query on a regular basis. The explain
> analyze of this query before running out of memory was:
>
>   https://explain.depesz.com/s/sGOH
>
> The customer is aware he should rewrite this query to optimize it, but it's a
> long time process he can not start immediately. To make it run in the meantime,
> he actually removed the top CTE to a dedicated table. According to their
> experience, it's not the first time they had to split a query this way to make
> it work.
>
> I've been able to run this query on a standby myself.  I've "call
> MemoryContextStats(TopMemoryContext)" every 10s on a run, see the data parsed
> (best view with "less -S") and the graph associated with it in attachment. It
> shows:
>
> * HashBatchContext goes up to 1441MB after 240s then stay flat until the end
>   (400s as the last record)

That's interesting. We're using HashBatchContext for very few things, so
what could it consume so much memory? But e.g. the number of buckets
should be limited by work_mem, so how could it get to 1.4GB?

Can you break at ExecHashIncreaseNumBatches/ExecHashIncreaseNumBuckets
and print how many batches/butches are there?

> * ALL other context are stable before 240s, but ExecutorState
> * ExecutorState keeps rising up to 13GB with no interruption until the memory
>   exhaustion
>
> I did another run with interactive gdb session (see the messy log session in
> attachment, for what it worth). Looking at some backtraces during the memory
> inflation close to the end of the query, all of them were having these frames in
> common:
>
>   [...]
>   #6  0x0000000000621ffc in ExecHashJoinImpl (parallel=false, pstate=0x31a3378)
>   at nodeHashjoin.c:398 [...]
>
> ...which is not really helpful but at least, it seems to come from a hash join
> node or some other hash related code. See the gdb session log for more details.
> After the out of mem, pmap of this process shows:
>
>   430:   postgres: postgres <dbname> [local] EXPLAIN
>   Address           Kbytes     RSS   Dirty Mode  Mapping
>   [...]
>   0000000002c5e000 13719620 8062376 8062376 rw---   [ anon ]
>   [...]
>
> Is it usual a backend is requesting such large memory size (13 GB) and
> actually use less of 60% of it (7.7GB of RSS)?
>

No idea. Interpreting this info is pretty tricky, in my experience. It
might mean the memory is no longer used but sbrk couldn't return it to
the OS yet, or something like that.

> Sadly, the database is 1.5TB large and I can not test on a newer major version.
> I did not try to check how large would be the required data set to reproduce
> this, but it moves 10s of million of rows from multiple tables anyway...
>
> Any idea? How could I help to have a better idea if a leak is actually
> occurring and where exactly?
>

Investigating memory leaks is tough, especially for generic memory
contexts like ExecutorState :-( Even more so when you can't reproduce it
on a machine with custom builds.

What I'd try is this:

1) attach breakpoints to all returns in AllocSetAlloc(), printing the
pointer and size for ExecutorState context, so something like

  break aset.c:783 if strcmp("ExecutorState",context->header.name) == 0
  commands
  print MemoryChunkGetPointer(chunk) size
  cont
  end

2) do the same for AllocSetFree()

3) Match the palloc/pfree calls (using the pointer address), to
determine which ones are not freed and do some stats on the size.
Usually there's only a couple distinct sizes that account for most of
the leaked memory.

4) Break AllocSetAlloc on those leaked sizes, to determine where the
calls come from.

This usually gives enough info about the leak or at least allows
focusing the investigation to a particular area of code.


regards

--
Tomas Vondra
EnterpriseDB: http://www.enterprisedb.com
The Enterprise PostgreSQL Company
Hi Justin,

On Tue, 28 Feb 2023 12:25:08 -0600
Justin Pryzby <pryzby@telsasoft.com> wrote:

> On Tue, Feb 28, 2023 at 07:06:43PM +0100, Jehan-Guillaume de Rorthais wrote:
> > Hello all,
> >
> > A customer is facing out of memory query which looks similar to this
> > situation:
> >
> >   https://www.postgresql.org/message-id/flat/12064.1555298699%40sss.pgh.pa.us#eb519865575bbc549007878a5fb7219b
> >
> > This PostgreSQL version is 11.18. Some settings:
>
> hash joins could exceed work_mem until v13:

Yes, I am aware of this. But as far as I understand Tom Lane explanations from
the discussion mentioned up thread, it should not be ExecutorState.
ExecutorState (13GB) is at least ten times bigger than any other context,
including HashBatchContext (1.4GB) or HashTableContext (16MB). So maybe some
aggregate is walking toward the wall because of bad estimation, but something
else is racing way faster to the wall. And presently it might be something
related to some JOIN node.

About your other points, you are right, there's numerous things we could do to
improve this query, and our customer is considering it as well. It's just a
matter of time now.

But in the meantime, we are facing a query with a memory behavior that seemed
suspect. Following the 4 years old thread I mentioned, my goal is to inspect
and provide all possible information to make sure it's a "normal" behavior or
something that might/should be fixed.

Thank you for your help!
On 3/1/23 10:46, Jehan-Guillaume de Rorthais wrote:
> Hi Justin,
>
> On Tue, 28 Feb 2023 12:25:08 -0600
> Justin Pryzby <pryzby@telsasoft.com> wrote:
>
>> On Tue, Feb 28, 2023 at 07:06:43PM +0100, Jehan-Guillaume de Rorthais wrote:
>>> Hello all,
>>>
>>> A customer is facing out of memory query which looks similar to this
>>> situation:
>>>
>>>   https://www.postgresql.org/message-id/flat/12064.1555298699%40sss.pgh.pa.us#eb519865575bbc549007878a5fb7219b
>>>
>>> This PostgreSQL version is 11.18. Some settings:
>>
>> hash joins could exceed work_mem until v13:
>
> Yes, I am aware of this. But as far as I understand Tom Lane explanations from
> the discussion mentioned up thread, it should not be ExecutorState.
> ExecutorState (13GB) is at least ten times bigger than any other context,
> including HashBatchContext (1.4GB) or HashTableContext (16MB). So maybe some
> aggregate is walking toward the wall because of bad estimation, but something
> else is racing way faster to the wall. And presently it might be something
> related to some JOIN node.
>

I still don't understand why would this be due to a hash aggregate. That
should not allocate memory in ExecutorState at all. And HashBatchContext
(which is the one bloated) is used by hashjoin, so the issue is likely
somewhere in that area.

> About your other points, you are right, there's numerous things we could do to
> improve this query, and our customer is considering it as well. It's just a
> matter of time now.
>
> But in the meantime, we are facing a query with a memory behavior that seemed
> suspect. Following the 4 years old thread I mentioned, my goal is to inspect
> and provide all possible information to make sure it's a "normal" behavior or
> something that might/should be fixed.
>

It'd be interesting to see if the gdb stuff I suggested yesterday yields
some interesting info.

Furthermore, I realized the plan you posted yesterday may not be the
case used for the failing query. It'd be interesting to see what plan is
used for the case that actually fails. Can you do at least explain on
it? Or alternatively, if the query is already running and eating a lot
of memory, attach gdb and print the plan in ExecutorStart

  set print elements 0
  p nodeToString(queryDesc->plannedstmt->planTree)

Thinking about this, I have one suspicion. Hashjoins try to fit into
work_mem by increasing the number of batches - when a batch gets too
large, we double the number of batches (and split the batch into two, to
reduce the size). But if there's a lot of tuples for a particular key
(or at least the hash value), we quickly run into work_mem and keep
adding more and more batches.

The problem with this theory is that the batches are allocated in
HashTableContext, and that doesn't grow very much. And the 1.4GB
HashBatchContext is used for buckets - but we should not allocate that
many, because we cap that to nbuckets_optimal (see 30d7ae3c76). And it
does not explain the ExecutorState bloat either.

Nevertheless, it'd be interesting to see the hashtable parameters:

  p *hashtable


regards

--
Tomas Vondra
EnterpriseDB: http://www.enterprisedb.com
The Enterprise PostgreSQL Company
Hi Tomas,

On Tue, 28 Feb 2023 20:51:02 +0100
Tomas Vondra <tomas.vondra@enterprisedb.com> wrote:
> On 2/28/23 19:06, Jehan-Guillaume de Rorthais wrote:
> > * HashBatchContext goes up to 1441MB after 240s then stay flat until the end
> >   (400s as the last record)
>
> That's interesting. We're using HashBatchContext for very few things, so
> what could it consume so much memory? But e.g. the number of buckets
> should be limited by work_mem, so how could it get to 1.4GB?
>
> Can you break at ExecHashIncreaseNumBatches/ExecHashIncreaseNumBuckets
> and print how many batches/butches are there?

I did this test this morning.

Batches and buckets increased really quickly to 1048576/1048576.

ExecHashIncreaseNumBatches was really chatty, having hundreds of thousands of
calls, always short-cut'ed to 1048576, I guess because of the conditional block
«/* safety check to avoid overflow */» appearing early in this function.

I disabled the breakpoint on ExecHashIncreaseNumBatches a few time to make the
query run faster. Enabling it at 19.1GB of memory consumption, it stayed
silent till the memory exhaustion (around 21 or 22GB, I don't remember exactly).

The breakpoint on ExecHashIncreaseNumBuckets triggered some times at beginning,
and a last time close to the end of the query execution.

> > Any idea? How could I help to have a better idea if a leak is actually
> > occurring and where exactly?
>
> Investigating memory leaks is tough, especially for generic memory
> contexts like ExecutorState :-( Even more so when you can't reproduce it
> on a machine with custom builds.
>
> What I'd try is this:
>
> 1) attach breakpoints to all returns in AllocSetAlloc(), printing the
> pointer and size for ExecutorState context, so something like
>
>   break aset.c:783 if strcmp("ExecutorState",context->header.name) == 0
>   commands
>   print MemoryChunkGetPointer(chunk) size
>   cont
>   end
>
> 2) do the same for AllocSetFree()
>
> 3) Match the palloc/pfree calls (using the pointer address), to
> determine which ones are not freed and do some stats on the size.
> Usually there's only a couple distinct sizes that account for most of
> the leaked memory.

So here is what I end up with this afternoon, using file, lines and macro from
REL_11_18:

  set logging  on
  set pagination off

  break aset.c:781 if strcmp("ExecutorState",context.name) == 0
  commands 1
  print (((char *)(chunk)) + sizeof(struct AllocChunkData))
  print chunk->size
  cont
  end

  break aset.c:820 if strcmp("ExecutorState",context.name) == 0
  commands 2
  print (((char *)(chunk)) + sizeof(struct AllocChunkData))
  print chunk->size
  cont
  end

  break aset.c:979 if strcmp("ExecutorState",context.name) == 0
  commands 3
  print (((char *)(chunk)) + sizeof(struct AllocChunkData))
  print chunk->size
  cont
  end

  break AllocSetFree if strcmp("ExecutorState",context.name) == 0
  commands 4
  print pointer
  cont
  end

So far, gdb had more than 3h of CPU time and is eating 2.4GB of memory. The
backend had only 3'32" of CPU time:

   VIRT    RES    SHR S  %CPU %MEM     TIME+ COMMAND
  2727284   2.4g  17840 R  99.0  7.7 181:25.07 gdb
  9054688 220648 103056 t   1.3  0.7   3:32.05 postmaster

Interestingly, the RES memory of the backend did not explode yet, but VIRT is
already high.

I suppose the query will run for some more hours, hopefully, gdb will not
exhaust the memory in the meantime...

You'll find some intermediate stats I already collected in attachment:

* break 1, 2 and 3 are from AllocSetAlloc, break 4 is from AllocSetFree.
* most of the non-free'd chunk are allocated since the very beginning, before
  the 5000's allocation call for almost 1M call so far.
* 3754 of them have a chunk->size of 0
* it seems there's some buggy stats or data:
       # this one actually really comes from the gdb log
       0x38a77b8: break=3 num=191       sz=4711441762604810240 (weird sz)
       # this one might be a bug in my script
             0x2: break=2 num=945346    sz=2                   (weird address)
* ignoring the weird size requested during the 191st call, the total amount
  of non free'd memory is currently 5488MB

I couldn't print "size" as it is optimzed away, that's why I tracked
chunk->size... Is there anything wrong with my current run and gdb log?

The gdb log is 5MB compressed. I'll keep it off-list, but I can provide it if
needed.

Stay tuned...

Thank you!
Attachment
On Wed, 1 Mar 2023 18:48:40 +0100
Jehan-Guillaume de Rorthais <jgdr@dalibo.com> wrote:
...
> You'll find some intermediate stats I already collected in attachment:
>
> * break 1, 2 and 3 are from AllocSetAlloc, break 4 is from AllocSetFree.
> * most of the non-free'd chunk are allocated since the very beginning, before
>   the 5000's allocation call for almost 1M call so far.
> * 3754 of them have a chunk->size of 0
> * it seems there's some buggy stats or data:
>        # this one actually really comes from the gdb log
>        0x38a77b8: break=3 num=191       sz=4711441762604810240 (weird sz)
>        # this one might be a bug in my script
>              0x2: break=2 num=945346    sz=2                   (weird address)
> * ignoring the weird size requested during the 191st call, the total amount
>   of non free'd memory is currently 5488MB

I forgot one stat. I don't know if this is expected, normal or not, but 53
chunks has been allocated on an existing address that was not free'd before.

Regards,
On 3/1/23 18:48, Jehan-Guillaume de Rorthais wrote:
> Hi Tomas,
>
> On Tue, 28 Feb 2023 20:51:02 +0100
> Tomas Vondra <tomas.vondra@enterprisedb.com> wrote:
>> On 2/28/23 19:06, Jehan-Guillaume de Rorthais wrote:
>>> * HashBatchContext goes up to 1441MB after 240s then stay flat until the end
>>>   (400s as the last record)
>>
>> That's interesting. We're using HashBatchContext for very few things, so
>> what could it consume so much memory? But e.g. the number of buckets
>> should be limited by work_mem, so how could it get to 1.4GB?
>>
>> Can you break at ExecHashIncreaseNumBatches/ExecHashIncreaseNumBuckets
>> and print how many batches/butches are there?
>
> I did this test this morning.
>
> Batches and buckets increased really quickly to 1048576/1048576.
>

OK. I think 1M buckets is mostly expected for work_mem=64MB. It means
buckets will use 8MB, which leaves ~56B per tuple (we're aiming for
fillfactor 1.0).

But 1M batches? I guess that could be problematic. It doesn't seem like
much, but we need 1M files on each side - 1M for the hash table, 1M for
the outer relation. That's 16MB of pointers, but the files are BufFile
and we keep 8kB buffer for each of them. That's ~16GB right there :-(

In practice it probably won't be that bad, because not all files will be
allocated/opened concurrently (especially if this is due to many tuples
having the same value). Assuming that's what's happening here, ofc.

> ExecHashIncreaseNumBatches was really chatty, having hundreds of thousands of
> calls, always short-cut'ed to 1048576, I guess because of the conditional block
> «/* safety check to avoid overflow */» appearing early in this function.
>

Hmmm, that's a bit weird, no? I mean, the check is

  /* safety check to avoid overflow */
  if (oldnbatch > Min(INT_MAX / 2, MaxAllocSize / (sizeof(void *) * 2)))
     return;

Why would it stop at 1048576? It certainly is not higher than  INT_MAX/2
and with MaxAllocSize = ~1GB the second value should be ~33M. So what's
happening here?

> I disabled the breakpoint on ExecHashIncreaseNumBatches a few time to make the
> query run faster. Enabling it at 19.1GB of memory consumption, it stayed
> silent till the memory exhaustion (around 21 or 22GB, I don't remember exactly).
>
> The breakpoint on ExecHashIncreaseNumBuckets triggered some times at beginning,
> and a last time close to the end of the query execution.
>
>>> Any idea? How could I help to have a better idea if a leak is actually
>>> occurring and where exactly?
>>
>> Investigating memory leaks is tough, especially for generic memory
>> contexts like ExecutorState :-( Even more so when you can't reproduce it
>> on a machine with custom builds.
>>
>> What I'd try is this:
>>
>> 1) attach breakpoints to all returns in AllocSetAlloc(), printing the
>> pointer and size for ExecutorState context, so something like
>>
>>   break aset.c:783 if strcmp("ExecutorState",context->header.name) == 0
>>   commands
>>   print MemoryChunkGetPointer(chunk) size
>>   cont
>>   end
>>
>> 2) do the same for AllocSetFree()
>>
>> 3) Match the palloc/pfree calls (using the pointer address), to
>> determine which ones are not freed and do some stats on the size.
>> Usually there's only a couple distinct sizes that account for most of
>> the leaked memory.
>
> So here is what I end up with this afternoon, using file, lines and macro from
> REL_11_18:
>
>   set logging  on
>   set pagination off
>
>   break aset.c:781 if strcmp("ExecutorState",context.name) == 0
>   commands 1
>   print (((char *)(chunk)) + sizeof(struct AllocChunkData))
>   print chunk->size
>   cont
>   end
>
>   break aset.c:820 if strcmp("ExecutorState",context.name) == 0
>   commands 2
>   print (((char *)(chunk)) + sizeof(struct AllocChunkData))
>   print chunk->size
>   cont
>   end
>
>   break aset.c:979 if strcmp("ExecutorState",context.name) == 0
>   commands 3
>   print (((char *)(chunk)) + sizeof(struct AllocChunkData))
>   print chunk->size
>   cont
>   end
>
>   break AllocSetFree if strcmp("ExecutorState",context.name) == 0
>   commands 4
>   print pointer
>   cont
>   end
>
> So far, gdb had more than 3h of CPU time and is eating 2.4GB of memory. The
> backend had only 3'32" of CPU time:
>
>    VIRT    RES    SHR S  %CPU %MEM     TIME+ COMMAND
>   2727284   2.4g  17840 R  99.0  7.7 181:25.07 gdb
>   9054688 220648 103056 t   1.3  0.7   3:32.05 postmaster
>
> Interestingly, the RES memory of the backend did not explode yet, but VIRT is
> already high.
>
> I suppose the query will run for some more hours, hopefully, gdb will not
> exhaust the memory in the meantime...
>
> You'll find some intermediate stats I already collected in attachment:
>
> * break 1, 2 and 3 are from AllocSetAlloc, break 4 is from AllocSetFree.
> * most of the non-free'd chunk are allocated since the very beginning, before
>   the 5000's allocation call for almost 1M call so far.
> * 3754 of them have a chunk->size of 0
> * it seems there's some buggy stats or data:
>        # this one actually really comes from the gdb log
>        0x38a77b8: break=3 num=191       sz=4711441762604810240 (weird sz)
>        # this one might be a bug in my script
>              0x2: break=2 num=945346    sz=2                   (weird address)
> * ignoring the weird size requested during the 191st call, the total amount
>   of non free'd memory is currently 5488MB
>
> I couldn't print "size" as it is optimzed away, that's why I tracked
> chunk->size... Is there anything wrong with my current run and gdb log?
>

There's definitely something wrong. The size should not be 0, and
neither it should be > 1GB. I suspect it's because some of the variables
get optimized out, and gdb just uses some nonsense :-(

I guess you'll need to debug the individual breakpoints, and see what's
available. It probably depends on the compiler version, etc. For example
I don't see the "chunk" for breakpoint 3, but "chunk_size" works and I
can print the chunk pointer with a bit of arithmetics:

  p (block->freeptr - chunk_size)

I suppose similar gympastics could work for the other breakpoints.


regards

--
Tomas Vondra
EnterpriseDB: http://www.enterprisedb.com
The Enterprise PostgreSQL Company
On 3/1/23 19:09, Jehan-Guillaume de Rorthais wrote:
> On Wed, 1 Mar 2023 18:48:40 +0100
> Jehan-Guillaume de Rorthais <jgdr@dalibo.com> wrote:
> ...
>> You'll find some intermediate stats I already collected in attachment:
>>
>> * break 1, 2 and 3 are from AllocSetAlloc, break 4 is from AllocSetFree.
>> * most of the non-free'd chunk are allocated since the very beginning, before
>>   the 5000's allocation call for almost 1M call so far.
>> * 3754 of them have a chunk->size of 0
>> * it seems there's some buggy stats or data:
>>        # this one actually really comes from the gdb log
>>        0x38a77b8: break=3 num=191       sz=4711441762604810240 (weird sz)
>>        # this one might be a bug in my script
>>              0x2: break=2 num=945346    sz=2                   (weird address)
>> * ignoring the weird size requested during the 191st call, the total amount
>>   of non free'd memory is currently 5488MB
>
> I forgot one stat. I don't know if this is expected, normal or not, but 53
> chunks has been allocated on an existing address that was not free'd before.
>

It's likely chunk was freed by repalloc() and not by pfree() directly.
Or maybe the whole context got destroyed/reset, in which case we don't
free individual chunks. But that's unlikely for the ExecutorState.

regards

--
Tomas Vondra
EnterpriseDB: http://www.enterprisedb.com
The Enterprise PostgreSQL Company
On Wed, 1 Mar 2023 20:34:08 +0100
Tomas Vondra <tomas.vondra@enterprisedb.com> wrote:

> On 3/1/23 19:09, Jehan-Guillaume de Rorthais wrote:
> > On Wed, 1 Mar 2023 18:48:40 +0100
> > Jehan-Guillaume de Rorthais <jgdr@dalibo.com> wrote:
> > ...
> >> You'll find some intermediate stats I already collected in attachment:
> >>
> >> * break 1, 2 and 3 are from AllocSetAlloc, break 4 is from AllocSetFree.
> >> * most of the non-free'd chunk are allocated since the very beginning,
> >> before the 5000's allocation call for almost 1M call so far.
> >> * 3754 of them have a chunk->size of 0
> >> * it seems there's some buggy stats or data:
> >>        # this one actually really comes from the gdb log
> >>        0x38a77b8: break=3 num=191       sz=4711441762604810240 (weird sz)
> >>        # this one might be a bug in my script
> >>              0x2: break=2 num=945346    sz=2                   (weird
> >> address)
> >> * ignoring the weird size requested during the 191st call, the total amount
> >>   of non free'd memory is currently 5488MB
> >
> > I forgot one stat. I don't know if this is expected, normal or not, but 53
> > chunks has been allocated on an existing address that was not free'd before.
> >
>
> It's likely chunk was freed by repalloc() and not by pfree() directly.
> Or maybe the whole context got destroyed/reset, in which case we don't
> free individual chunks. But that's unlikely for the ExecutorState.

Well, as all breakpoints were conditional on ExecutorState, I suppose this
might be repalloc then.

Regards,
Hi,

On Wed, 1 Mar 2023 20:29:11 +0100
Tomas Vondra <tomas.vondra@enterprisedb.com> wrote:
> On 3/1/23 18:48, Jehan-Guillaume de Rorthais wrote:
> > On Tue, 28 Feb 2023 20:51:02 +0100
> > Tomas Vondra <tomas.vondra@enterprisedb.com> wrote:
> >> On 2/28/23 19:06, Jehan-Guillaume de Rorthais wrote:
> >>> * HashBatchContext goes up to 1441MB after 240s then stay flat until the
> >>> end (400s as the last record)
> >>
> >> That's interesting. We're using HashBatchContext for very few things, so
> >> what could it consume so much memory? But e.g. the number of buckets
> >> should be limited by work_mem, so how could it get to 1.4GB?
> >>
> >> Can you break at ExecHashIncreaseNumBatches/ExecHashIncreaseNumBuckets
> >> and print how many batches/butches are there?
> >
> > I did this test this morning.
> >
> > Batches and buckets increased really quickly to 1048576/1048576.
>
> OK. I think 1M buckets is mostly expected for work_mem=64MB. It means
> buckets will use 8MB, which leaves ~56B per tuple (we're aiming for
> fillfactor 1.0).
>
> But 1M batches? I guess that could be problematic. It doesn't seem like
> much, but we need 1M files on each side - 1M for the hash table, 1M for
> the outer relation. That's 16MB of pointers, but the files are BufFile
> and we keep 8kB buffer for each of them. That's ~16GB right there :-(
>
> In practice it probably won't be that bad, because not all files will be
> allocated/opened concurrently (especially if this is due to many tuples
> having the same value). Assuming that's what's happening here, ofc.

And I suppose they are close/freed concurrently as well?

> > ExecHashIncreaseNumBatches was really chatty, having hundreds of thousands
> > of calls, always short-cut'ed to 1048576, I guess because of the
> > conditional block «/* safety check to avoid overflow */» appearing early in
> > this function.
>
> Hmmm, that's a bit weird, no? I mean, the check is
>
>   /* safety check to avoid overflow */
>   if (oldnbatch > Min(INT_MAX / 2, MaxAllocSize / (sizeof(void *) * 2)))
>      return;
>
> Why would it stop at 1048576? It certainly is not higher than  INT_MAX/2
> and with MaxAllocSize = ~1GB the second value should be ~33M. So what's
> happening here?

Indeed, not the good suspect. But what about this other short-cut then?

    /* do nothing if we've decided to shut off growth */
    if (!hashtable->growEnabled)
        return;

    [...]

    /*
     * If we dumped out either all or none of the tuples in the table, disable
     * further expansion of nbatch.  This situation implies that we have
     * enough tuples of identical hashvalues to overflow spaceAllowed.
     * Increasing nbatch will not fix it since there's no way to subdivide the
     * group any more finely. We have to just gut it out and hope the server
     * has enough RAM.
     */
    if (nfreed == 0 || nfreed == ninmemory)
    {
        hashtable->growEnabled = false;
  #ifdef HJDEBUG
        printf("Hashjoin %p: disabling further increase of nbatch\n",
               hashtable);
  #endif
    }

If I guess correctly, the function is not able to split the current batch, so
it sits and hopes. This is a much better suspect and I can surely track this
from gdb.

Being able to find what are the fields involved in the join could help as well
to check or gather some stats about them, but I hadn't time to dig this yet...

[...]
> >> Investigating memory leaks is tough, especially for generic memory
> >> contexts like ExecutorState :-( Even more so when you can't reproduce it
> >> on a machine with custom builds.
> >>
> >> What I'd try is this:

[...]
> > I couldn't print "size" as it is optimzed away, that's why I tracked
> > chunk->size... Is there anything wrong with my current run and gdb log?
>
> There's definitely something wrong. The size should not be 0, and
> neither it should be > 1GB. I suspect it's because some of the variables
> get optimized out, and gdb just uses some nonsense :-(
>
> I guess you'll need to debug the individual breakpoints, and see what's
> available. It probably depends on the compiler version, etc. For example
> I don't see the "chunk" for breakpoint 3, but "chunk_size" works and I
> can print the chunk pointer with a bit of arithmetics:
>
>   p (block->freeptr - chunk_size)
>
> I suppose similar gympastics could work for the other breakpoints.

OK, I'll give it a try tomorrow.

Thank you!

NB: the query has been killed by the replication.
On 3/2/23 00:18, Jehan-Guillaume de Rorthais wrote:
> Hi,
>
> On Wed, 1 Mar 2023 20:29:11 +0100
> Tomas Vondra <tomas.vondra@enterprisedb.com> wrote:
>> On 3/1/23 18:48, Jehan-Guillaume de Rorthais wrote:
>>> On Tue, 28 Feb 2023 20:51:02 +0100
>>> Tomas Vondra <tomas.vondra@enterprisedb.com> wrote:
>>>> On 2/28/23 19:06, Jehan-Guillaume de Rorthais wrote:
>>>>> * HashBatchContext goes up to 1441MB after 240s then stay flat until the
>>>>> end (400s as the last record)
>>>>
>>>> That's interesting. We're using HashBatchContext for very few things, so
>>>> what could it consume so much memory? But e.g. the number of buckets
>>>> should be limited by work_mem, so how could it get to 1.4GB?
>>>>
>>>> Can you break at ExecHashIncreaseNumBatches/ExecHashIncreaseNumBuckets
>>>> and print how many batches/butches are there?
>>>
>>> I did this test this morning.
>>>
>>> Batches and buckets increased really quickly to 1048576/1048576.
>>
>> OK. I think 1M buckets is mostly expected for work_mem=64MB. It means
>> buckets will use 8MB, which leaves ~56B per tuple (we're aiming for
>> fillfactor 1.0).
>>
>> But 1M batches? I guess that could be problematic. It doesn't seem like
>> much, but we need 1M files on each side - 1M for the hash table, 1M for
>> the outer relation. That's 16MB of pointers, but the files are BufFile
>> and we keep 8kB buffer for each of them. That's ~16GB right there :-(
>>
>> In practice it probably won't be that bad, because not all files will be
>> allocated/opened concurrently (especially if this is due to many tuples
>> having the same value). Assuming that's what's happening here, ofc.
>
> And I suppose they are close/freed concurrently as well?
>

Yeah. There can be different subsets of the files used, depending on
when the number of batches start to explode, etc.

>>> ExecHashIncreaseNumBatches was really chatty, having hundreds of thousands
>>> of calls, always short-cut'ed to 1048576, I guess because of the
>>> conditional block «/* safety check to avoid overflow */» appearing early in
>>> this function.
>>
>> Hmmm, that's a bit weird, no? I mean, the check is
>>
>>   /* safety check to avoid overflow */
>>   if (oldnbatch > Min(INT_MAX / 2, MaxAllocSize / (sizeof(void *) * 2)))
>>      return;
>>
>> Why would it stop at 1048576? It certainly is not higher than  INT_MAX/2
>> and with MaxAllocSize = ~1GB the second value should be ~33M. So what's
>> happening here?
>
> Indeed, not the good suspect. But what about this other short-cut then?
>
>     /* do nothing if we've decided to shut off growth */
>     if (!hashtable->growEnabled)
>         return;
>
>     [...]
>
>     /*
>      * If we dumped out either all or none of the tuples in the table, disable
>      * further expansion of nbatch.  This situation implies that we have
>      * enough tuples of identical hashvalues to overflow spaceAllowed.
>      * Increasing nbatch will not fix it since there's no way to subdivide the
>      * group any more finely. We have to just gut it out and hope the server
>      * has enough RAM.
>      */
>     if (nfreed == 0 || nfreed == ninmemory)
>     {
>         hashtable->growEnabled = false;
>   #ifdef HJDEBUG
>         printf("Hashjoin %p: disabling further increase of nbatch\n",
>                hashtable);
>   #endif
>     }
>
> If I guess correctly, the function is not able to split the current batch, so
> it sits and hopes. This is a much better suspect and I can surely track this
> from gdb.
>

Yes, this would make much more sense - it'd be consistent with the
hypothesis that this is due to number of batches exploding (it's a
protection exactly against that).

You specifically mentioned the other check earlier, but now I realize
you've been just speculating it might be that.

> Being able to find what are the fields involved in the join could help as well
> to check or gather some stats about them, but I hadn't time to dig this yet...
>

It's going to be tricky, because all parts of the plan may be doing
something, and there may be multiple hash joins. So you won't know if
you're executing the part of the plan that's causing issues :-(


But I have another idea - put a breakpoint on makeBufFile() which is the
bit that allocates the temp files including the 8kB buffer, and print in
what context we allocate that. I have a hunch we may be allocating it in
the ExecutorState. That'd explain all the symptoms.


BTW with how many batches does the hash join start?


regards

--
Tomas Vondra
EnterpriseDB: http://www.enterprisedb.com
The Enterprise PostgreSQL Company
On Thu, 2 Mar 2023 01:30:27 +0100
Tomas Vondra <tomas.vondra@enterprisedb.com> wrote:
> On 3/2/23 00:18, Jehan-Guillaume de Rorthais wrote:
> >>> ExecHashIncreaseNumBatches was really chatty, having hundreds of thousands
> >>> of calls, always short-cut'ed to 1048576, I guess because of the
> >>> conditional block «/* safety check to avoid overflow */» appearing early
> >>> in this function.
> >[...] But what about this other short-cut then?
> >
> >     /* do nothing if we've decided to shut off growth */
> >     if (!hashtable->growEnabled)
> >         return;
> >
> >     [...]
> >
> >     /*
> >      * If we dumped out either all or none of the tuples in the table,
> >      * disable
> >      * further expansion of nbatch.  This situation implies that we have
> >      * enough tuples of identical hashvalues to overflow spaceAllowed.
> >      * Increasing nbatch will not fix it since there's no way to subdivide
> >      * the
> >      * group any more finely. We have to just gut it out and hope the server
> >      * has enough RAM.
> >      */
> >     if (nfreed == 0 || nfreed == ninmemory)
> >     {
> >         hashtable->growEnabled = false;
> >   #ifdef HJDEBUG
> >         printf("Hashjoin %p: disabling further increase of nbatch\n",
> >                hashtable);
> >   #endif
> >     }
> >
> > If I guess correctly, the function is not able to split the current batch,
> > so it sits and hopes. This is a much better suspect and I can surely track
> > this from gdb.
>
> Yes, this would make much more sense - it'd be consistent with the
> hypothesis that this is due to number of batches exploding (it's a
> protection exactly against that).
>
> You specifically mentioned the other check earlier, but now I realize
> you've been just speculating it might be that.

Yes, sorry about that, I jumped on this speculation without actually digging it
much...

[...]
> But I have another idea - put a breakpoint on makeBufFile() which is the
> bit that allocates the temp files including the 8kB buffer, and print in
> what context we allocate that. I have a hunch we may be allocating it in
> the ExecutorState. That'd explain all the symptoms.

That what I was wondering as well yesterday night.

So, on your advice, I set a breakpoint on makeBufFile:

  (gdb) info br
  Num     Type           Disp Enb Address            What
  1       breakpoint     keep y   0x00000000007229df in makeBufFile
          bt 10
          p CurrentMemoryContext.name


Then, I disabled it and ran the query up to this mem usage:

   VIRT    RES    SHR S  %CPU %MEM
  20.1g   7.0g  88504 t   0.0 22.5

Then, I enabled the breakpoint and look at around 600 bt and context name
before getting bored. They **all** looked like that:

  Breakpoint 1, BufFileCreateTemp (...)                at buffile.c:201
  201     in buffile.c
  #0  BufFileCreateTemp (...)                             buffile.c:201
  #1  ExecHashJoinSaveTuple (tuple=0x1952c180, ...)       nodeHashjoin.c:1238
  #2  ExecHashJoinImpl (parallel=false, pstate=0x31a6418) nodeHashjoin.c:398
  #3  ExecHashJoin (pstate=0x31a6418)                     nodeHashjoin.c:584
  #4  ExecProcNodeInstr (node=<optimized out>)            execProcnode.c:462
  #5  ExecProcNode (node=0x31a6418)
  #6  ExecSort (pstate=0x31a6308)
  #7  ExecProcNodeInstr (node=<optimized out>)
  #8  ExecProcNode (node=0x31a6308)
  #9  fetch_input_tuple (aggstate=aggstate@entry=0x31a5ea0)

  $421643 = 0x99d7f7 "ExecutorState"

These 600-ish 8kB buffer were all allocated in "ExecutorState". I could
probably log much more of them if more checks/stats need to be collected, but
it really slow down the query a lot, granting it only 1-5% of CPU time instead
of the usual 100%.

So It's not exactly a leakage, as memory would be released at the end of the
query, but I suppose they should be allocated in a shorter living context,
to avoid this memory bloat, am I right?

> BTW with how many batches does the hash join start?

* batches went from 32 to 1048576 before being growEnabled=false as suspected
* original and current nbuckets were set to 1048576 immediately
* allowed space is set to the work_mem, but current space usage is 1.3GB, as
  measured previously close before system refuse more memory allocation.

Here are the full details about the hash associated with the previous backtrace:

  (gdb) up
  (gdb) up
  (gdb) p *((HashJoinState*)pstate)->hj_HashTable
  $421652 = {
    nbuckets = 1048576,
    log2_nbuckets = 20,
    nbuckets_original = 1048576,
    nbuckets_optimal = 1048576,
    log2_nbuckets_optimal = 20,
    buckets = {unshared = 0x68f12e8, shared = 0x68f12e8},
    keepNulls = true,
    skewEnabled = false,
    skewBucket = 0x0,
    skewBucketLen = 0,
    nSkewBuckets = 0,
    skewBucketNums = 0x0,
    nbatch = 1048576,
    curbatch = 0,
    nbatch_original = 32,
    nbatch_outstart = 1048576,
    growEnabled = false,
    totalTuples = 19541735,
    partialTuples = 19541735,
    skewTuples = 0,
    innerBatchFile = 0xdfcd168,
    outerBatchFile = 0xe7cd1a8,
    outer_hashfunctions = 0x68ed3a0,
    inner_hashfunctions = 0x68ed3f0,
    hashStrict = 0x68ed440,
    spaceUsed = 1302386440,
    spaceAllowed = 67108864,
    spacePeak = 1302386440,
    spaceUsedSkew = 0,
    spaceAllowedSkew = 1342177,
    hashCxt = 0x68ed290,
    batchCxt = 0x68ef2a0,
    chunks = 0x251f28e88,
    current_chunk = 0x0,
    area = 0x0,
    parallel_state = 0x0,
    batches = 0x0,
    current_chunk_shared = 1103827828993
  }

For what it worth, contexts are:

  (gdb) p ((HashJoinState*)pstate)->hj_HashTable->hashCxt.name
  $421657 = 0x99e3c0 "HashTableContext"

  (gdb) p ((HashJoinState*)pstate)->hj_HashTable->batchCxt.name
  $421658 = 0x99e3d1 "HashBatchContext"

Regards,
On 3/2/23 13:08, Jehan-Guillaume de Rorthais wrote:
> ...
> [...]
>> But I have another idea - put a breakpoint on makeBufFile() which is the
>> bit that allocates the temp files including the 8kB buffer, and print in
>> what context we allocate that. I have a hunch we may be allocating it in
>> the ExecutorState. That'd explain all the symptoms.
>
> That what I was wondering as well yesterday night.
>
> So, on your advice, I set a breakpoint on makeBufFile:
>
>   (gdb) info br
>   Num     Type           Disp Enb Address            What
>   1       breakpoint     keep y   0x00000000007229df in makeBufFile
>           bt 10
>           p CurrentMemoryContext.name
>
>
> Then, I disabled it and ran the query up to this mem usage:
>
>    VIRT    RES    SHR S  %CPU %MEM
>   20.1g   7.0g  88504 t   0.0 22.5
>
> Then, I enabled the breakpoint and look at around 600 bt and context name
> before getting bored. They **all** looked like that:
>
>   Breakpoint 1, BufFileCreateTemp (...)                at buffile.c:201
>   201     in buffile.c
>   #0  BufFileCreateTemp (...)                             buffile.c:201
>   #1  ExecHashJoinSaveTuple (tuple=0x1952c180, ...)       nodeHashjoin.c:1238
>   #2  ExecHashJoinImpl (parallel=false, pstate=0x31a6418) nodeHashjoin.c:398
>   #3  ExecHashJoin (pstate=0x31a6418)                     nodeHashjoin.c:584
>   #4  ExecProcNodeInstr (node=<optimized out>)            execProcnode.c:462
>   #5  ExecProcNode (node=0x31a6418)
>   #6  ExecSort (pstate=0x31a6308)
>   #7  ExecProcNodeInstr (node=<optimized out>)
>   #8  ExecProcNode (node=0x31a6308)
>   #9  fetch_input_tuple (aggstate=aggstate@entry=0x31a5ea0)
>
>   $421643 = 0x99d7f7 "ExecutorState"
>
> These 600-ish 8kB buffer were all allocated in "ExecutorState". I could
> probably log much more of them if more checks/stats need to be collected, but
> it really slow down the query a lot, granting it only 1-5% of CPU time instead
> of the usual 100%.
>

Bingo!

> So It's not exactly a leakage, as memory would be released at the end of the
> query, but I suppose they should be allocated in a shorter living context,
> to avoid this memory bloat, am I right?
>

Well, yeah and no.

In principle we could/should have allocated the BufFiles in a different
context (possibly hashCxt). But in practice it probably won't make any
difference, because the query will probably run all the hashjoins at the
same time. Imagine a sequence of joins - we build all the hashes, and
then tuples from the outer side bubble up through the plans. And then
you process the last tuple and release all the hashes.

This would not fix the issue. It'd be helpful for accounting purposes
(we'd know it's the buffiles and perhaps for which hashjoin node). But
we'd still have to allocate the memory etc. (so still OOM).

There's only one thing I think could help - increase the work_mem enough
not to trigger the explosive growth in number of batches. Imagine
there's one very common value, accounting for ~65MB of tuples. With
work_mem=64MB this leads to exactly the explosive growth you're
observing here. With 128MB it'd probably run just fine.

The problem is we don't know how large the work_mem would need to be :-(
So you'll have to try and experiment a bit.

I remembered there was a thread [1] about *exactly* this issue in 2019.

[1]
https://www.postgresql.org/message-id/flat/bc138e9f-c89e-9147-5395-61d51a757b3b%40gusw.net

I even posted a couple patches that try to address this by accounting
for the BufFile memory, and increasing work_mem a bit instead of just
blindly increasing the number of batches (ignoring the fact that means
more memory will be used for the BufFile stuff).

I don't recall why it went nowhere, TBH. But I recall there were
discussions about maybe doing something like "block nestloop" at the
time, or something. Or maybe the thread just went cold.

>> BTW with how many batches does the hash join start?
>
> * batches went from 32 to 1048576 before being growEnabled=false as suspected
> * original and current nbuckets were set to 1048576 immediately
> * allowed space is set to the work_mem, but current space usage is 1.3GB, as
>   measured previously close before system refuse more memory allocation.
>

Yeah, I think this is pretty expected. We start with multiple batches,
so we pick optimal buckets for the whole work_mem (so no growth here).

But then batches explode, in the futile hope to keep this in work_mem.
Once that growth gets disabled, we end up with 1.3GB hash table.


regards

--
Tomas Vondra
EnterpriseDB: http://www.enterprisedb.com
The Enterprise PostgreSQL Company
Hi!

On Thu, 2 Mar 2023 13:44:52 +0100
Tomas Vondra <tomas.vondra@enterprisedb.com> wrote:
> Well, yeah and no.
>
> In principle we could/should have allocated the BufFiles in a different
> context (possibly hashCxt). But in practice it probably won't make any
> difference, because the query will probably run all the hashjoins at the
> same time. Imagine a sequence of joins - we build all the hashes, and
> then tuples from the outer side bubble up through the plans. And then
> you process the last tuple and release all the hashes.
>
> This would not fix the issue. It'd be helpful for accounting purposes
> (we'd know it's the buffiles and perhaps for which hashjoin node). But
> we'd still have to allocate the memory etc. (so still OOM).

Well, accounting things in the correct context would already worth a patch I
suppose. At least, it help to investigate faster. Plus, you already wrote a
patch about that[1]:

https://www.postgresql.org/message-id/20190421114618.z3mpgmimc3rmubi4%40development

Note that I did reference the "Out of Memory errors are frustrating as heck!"
thread in my first email, pointing on a Tom Lane's email explaining that
ExecutorState was not supposed to be so large[2].

[2] https://www.postgresql.org/message-id/flat/12064.1555298699%40sss.pgh.pa.us#eb519865575bbc549007878a5fb7219b

> There's only one thing I think could help - increase the work_mem enough
> not to trigger the explosive growth in number of batches. Imagine
> there's one very common value, accounting for ~65MB of tuples. With
> work_mem=64MB this leads to exactly the explosive growth you're
> observing here. With 128MB it'd probably run just fine.
>
> The problem is we don't know how large the work_mem would need to be :-(
> So you'll have to try and experiment a bit.
>
> I remembered there was a thread [1] about *exactly* this issue in 2019.
>
> [1]
> https://www.postgresql.org/message-id/flat/bc138e9f-c89e-9147-5395-61d51a757b3b%40gusw.net
>
> I even posted a couple patches that try to address this by accounting
> for the BufFile memory, and increasing work_mem a bit instead of just
> blindly increasing the number of batches (ignoring the fact that means
> more memory will be used for the BufFile stuff).
>
> I don't recall why it went nowhere, TBH. But I recall there were
> discussions about maybe doing something like "block nestloop" at the
> time, or something. Or maybe the thread just went cold.

So I read the full thread now. I'm still not sure why we try to avoid hash
collision so hard, and why a similar data subset barely larger than work_mem
makes the number of batchs explode, but I think I have a better understanding of
the discussion and the proposed solutions.

There was some thoughts about how to make a better usage of the memory. As
memory is exploding way beyond work_mem, at least, avoid to waste it with too
many buffers of BufFile. So you expand either the work_mem or the number of
batch, depending on what move is smarter. TJis is explained and tested here:

https://www.postgresql.org/message-id/20190421161434.4hedytsadpbnglgk%40development
https://www.postgresql.org/message-id/20190422030927.3huxq7gghms4kmf4%40development

And then, another patch to overflow each batch to a dedicated temp file and
stay inside work_mem (v4-per-slice-overflow-file.patch):

https://www.postgresql.org/message-id/20190428141901.5dsbge2ka3rxmpk6%40development

Then, nothing more on the discussion about this last patch. So I guess it just
went cold.

For what it worth, these two patches seems really interesting to me. Do you need
any help to revive it?

Regards,
On Thu, 2 Mar 2023 19:15:30 +0100
Jehan-Guillaume de Rorthais <jgdr@dalibo.com> wrote:
[...]
> For what it worth, these two patches seems really interesting to me. Do you
> need any help to revive it?

To avoid confusion, the two patches I meant were:

* 0001-move-BufFile-stuff-into-separate-context.patch
* v4-per-slice-overflow-file.patch

Regards,
On 3/2/23 19:15, Jehan-Guillaume de Rorthais wrote:
> Hi!
>
> On Thu, 2 Mar 2023 13:44:52 +0100
> Tomas Vondra <tomas.vondra@enterprisedb.com> wrote:
>> Well, yeah and no.
>>
>> In principle we could/should have allocated the BufFiles in a different
>> context (possibly hashCxt). But in practice it probably won't make any
>> difference, because the query will probably run all the hashjoins at the
>> same time. Imagine a sequence of joins - we build all the hashes, and
>> then tuples from the outer side bubble up through the plans. And then
>> you process the last tuple and release all the hashes.
>>
>> This would not fix the issue. It'd be helpful for accounting purposes
>> (we'd know it's the buffiles and perhaps for which hashjoin node). But
>> we'd still have to allocate the memory etc. (so still OOM).
>
> Well, accounting things in the correct context would already worth a patch I
> suppose. At least, it help to investigate faster. Plus, you already wrote a
> patch about that[1]:
>
> https://www.postgresql.org/message-id/20190421114618.z3mpgmimc3rmubi4%40development
>
> Note that I did reference the "Out of Memory errors are frustrating as heck!"
> thread in my first email, pointing on a Tom Lane's email explaining that
> ExecutorState was not supposed to be so large[2].
>
> [2] https://www.postgresql.org/message-id/flat/12064.1555298699%40sss.pgh.pa.us#eb519865575bbc549007878a5fb7219b
>

Ah, right, I didn't realize it's the same thread. There are far too many
threads about this sort of things, and I probably submitted half-baked
patches to most of them :-/

>> There's only one thing I think could help - increase the work_mem enough
>> not to trigger the explosive growth in number of batches. Imagine
>> there's one very common value, accounting for ~65MB of tuples. With
>> work_mem=64MB this leads to exactly the explosive growth you're
>> observing here. With 128MB it'd probably run just fine.
>>
>> The problem is we don't know how large the work_mem would need to be :-(
>> So you'll have to try and experiment a bit.
>>
>> I remembered there was a thread [1] about *exactly* this issue in 2019.
>>
>> [1]
>> https://www.postgresql.org/message-id/flat/bc138e9f-c89e-9147-5395-61d51a757b3b%40gusw.net
>>
>> I even posted a couple patches that try to address this by accounting
>> for the BufFile memory, and increasing work_mem a bit instead of just
>> blindly increasing the number of batches (ignoring the fact that means
>> more memory will be used for the BufFile stuff).
>>
>> I don't recall why it went nowhere, TBH. But I recall there were
>> discussions about maybe doing something like "block nestloop" at the
>> time, or something. Or maybe the thread just went cold.
>
> So I read the full thread now. I'm still not sure why we try to avoid hash
> collision so hard, and why a similar data subset barely larger than work_mem
> makes the number of batchs explode, but I think I have a better understanding of
> the discussion and the proposed solutions.
>

I don't think this is about hash collisions (i.e. the same hash value
being computed for different values). You can construct cases like this,
of course, particularly if you only look at a subset of the bits (for 1M
batches we only look at the first 20 bits), but I'd say it's fairly
unlikely to happen unless you do that intentionally.

(I'm assuming regular data types with reasonable hash functions. If the
query joins on custom data types with some silly hash function, it may
be more likely to have conflicts.)

IMHO a much more likely explanation is there actually is a very common
value in the data. For example there might be a value repeated 1M times,
and that'd be enough to break this.

We do build a special "skew" buckets for values from an MCV, but maybe
the stats are not updated yet, or maybe there are too many such values
to fit into MCV?

I now realize there's probably another way to get into this - oversized
rows. Could there be a huge row (e.g. with a large text/bytea value)?
Imagine a row that's 65MB - that'd be game over with work_mem=64MB. Or
there might be smaller rows, but a couple hash collisions would suffice.

> There was some thoughts about how to make a better usage of the memory. As
> memory is exploding way beyond work_mem, at least, avoid to waste it with too
> many buffers of BufFile. So you expand either the work_mem or the number of
> batch, depending on what move is smarter. TJis is explained and tested here:
>
> https://www.postgresql.org/message-id/20190421161434.4hedytsadpbnglgk%40development
> https://www.postgresql.org/message-id/20190422030927.3huxq7gghms4kmf4%40development
>
> And then, another patch to overflow each batch to a dedicated temp file and
> stay inside work_mem (v4-per-slice-overflow-file.patch):
>
> https://www.postgresql.org/message-id/20190428141901.5dsbge2ka3rxmpk6%40development
>
> Then, nothing more on the discussion about this last patch. So I guess it just
> went cold.
>

I think a contributing factor was that the OP did not respond for a
couple months, so the thread went cold.

> For what it worth, these two patches seems really interesting to me. Do you need
> any help to revive it?
>

I think another reason why that thread went nowhere were some that we've
been exploring a different (and likely better) approach to fix this by
falling back to a nested loop for the "problematic" batches.

As proposed in this thread:

 https://www.postgresql.org/message-id/20190421161434.4hedytsadpbnglgk%40development

So I guess the best thing would be to go through these threads, see what
the status is, restart the discussion and propose what to do. If you do
that, I'm happy to rebase the patches, and maybe see if I could improve
them in some way.

I was hoping we'd solve this by the BNL, but if we didn't get that in 4
years, maybe we shouldn't stall and get at least an imperfect stop-gap
solution ...

regards

--
Tomas Vondra
EnterpriseDB: http://www.enterprisedb.com
The Enterprise PostgreSQL Company
On Thu, 2 Mar 2023 19:53:14 +0100
Tomas Vondra <tomas.vondra@enterprisedb.com> wrote:
> On 3/2/23 19:15, Jehan-Guillaume de Rorthais wrote:
...

> > There was some thoughts about how to make a better usage of the memory. As
> > memory is exploding way beyond work_mem, at least, avoid to waste it with
> > too many buffers of BufFile. So you expand either the work_mem or the
> > number of batch, depending on what move is smarter. TJis is explained and
> > tested here:
> >
> > https://www.postgresql.org/message-id/20190421161434.4hedytsadpbnglgk%40development
> > https://www.postgresql.org/message-id/20190422030927.3huxq7gghms4kmf4%40development
> >
> > And then, another patch to overflow each batch to a dedicated temp file and
> > stay inside work_mem (v4-per-slice-overflow-file.patch):
> >
> > https://www.postgresql.org/message-id/20190428141901.5dsbge2ka3rxmpk6%40development
> >
> > Then, nothing more on the discussion about this last patch. So I guess it
> > just went cold.
>
> I think a contributing factor was that the OP did not respond for a
> couple months, so the thread went cold.
>
> > For what it worth, these two patches seems really interesting to me. Do you
> > need any help to revive it?
>
> I think another reason why that thread went nowhere were some that we've
> been exploring a different (and likely better) approach to fix this by
> falling back to a nested loop for the "problematic" batches.
>
> As proposed in this thread:
>
>  https://www.postgresql.org/message-id/20190421161434.4hedytsadpbnglgk%40development

Unless I'm wrong, you are linking to the same «frustrated as heck!» discussion,
for your patch v2-0001-account-for-size-of-BatchFile-structure-in-hashJo.patch
(balancing between increasing batches *and* work_mem).

No sign of turning "problematic" batches to nested loop. Did I miss something?

Do you have a link close to your hand about such algo/patch test by any chance?

> I was hoping we'd solve this by the BNL, but if we didn't get that in 4
> years, maybe we shouldn't stall and get at least an imperfect stop-gap
> solution ...

I'll keep searching tomorrow about existing BLN discussions (is it block level
nested loops?).

Regards,
On 3/2/23 23:57, Jehan-Guillaume de Rorthais wrote:
> On Thu, 2 Mar 2023 19:53:14 +0100
> Tomas Vondra <tomas.vondra@enterprisedb.com> wrote:
>> On 3/2/23 19:15, Jehan-Guillaume de Rorthais wrote:
> ...
>
>>> There was some thoughts about how to make a better usage of the memory. As
>>> memory is exploding way beyond work_mem, at least, avoid to waste it with
>>> too many buffers of BufFile. So you expand either the work_mem or the
>>> number of batch, depending on what move is smarter. TJis is explained and
>>> tested here:
>>>
>>> https://www.postgresql.org/message-id/20190421161434.4hedytsadpbnglgk%40development
>>> https://www.postgresql.org/message-id/20190422030927.3huxq7gghms4kmf4%40development
>>>
>>> And then, another patch to overflow each batch to a dedicated temp file and
>>> stay inside work_mem (v4-per-slice-overflow-file.patch):
>>>
>>> https://www.postgresql.org/message-id/20190428141901.5dsbge2ka3rxmpk6%40development
>>>
>>> Then, nothing more on the discussion about this last patch. So I guess it
>>> just went cold.
>>
>> I think a contributing factor was that the OP did not respond for a
>> couple months, so the thread went cold.
>>
>>> For what it worth, these two patches seems really interesting to me. Do you
>>> need any help to revive it?
>>
>> I think another reason why that thread went nowhere were some that we've
>> been exploring a different (and likely better) approach to fix this by
>> falling back to a nested loop for the "problematic" batches.
>>
>> As proposed in this thread:
>>
>>  https://www.postgresql.org/message-id/20190421161434.4hedytsadpbnglgk%40development
>
> Unless I'm wrong, you are linking to the same «frustrated as heck!» discussion,
> for your patch v2-0001-account-for-size-of-BatchFile-structure-in-hashJo.patch
> (balancing between increasing batches *and* work_mem).
>
> No sign of turning "problematic" batches to nested loop. Did I miss something?
>
> Do you have a link close to your hand about such algo/patch test by any chance?
>

Gah! My apologies, I meant to post a link to this thread:

https://www.postgresql.org/message-id/CAAKRu_b6+jC93WP+pWxqK5KAZJC5Rmxm8uquKtEf-KQ++1Li6Q@mail.gmail.com

which then points to this BNL patch

https://www.postgresql.org/message-id/CAAKRu_YsWm7gc_b2nBGWFPE6wuhdOLfc1LBZ786DUzaCPUDXCA%40mail.gmail.com

That discussion apparently stalled in August 2020, so maybe that's where
we should pick up and see in what shape that patch is.

regards


--
Tomas Vondra
EnterpriseDB: http://www.enterprisedb.com
The Enterprise PostgreSQL Company
Hi,

> So I guess the best thing would be to go through these threads, see what
> the status is, restart the discussion and propose what to do. If you do
> that, I'm happy to rebase the patches, and maybe see if I could improve
> them in some way.

OK! It took me some time, but I did it. I'll try to sum up the situation as
simply as possible.

I reviewed the following threads:

* Out of Memory errors are frustrating as heck!
  2019-04-14 -> 2019-04-28
  https://www.postgresql.org/message-id/flat/bc138e9f-c89e-9147-5395-61d51a757b3b%40gusw.net

  This discussion stalled, waiting for OP, but ideas there ignited all other
  discussions.

* accounting for memory used for BufFile during hash joins
  2019-05-04 -> 2019-09-10
  https://www.postgresql.org/message-id/flat/20190504003414.bulcbnge3rhwhcsh%40development

  This was suppose to push forward a patch discussed on previous thread, but
  it actually took over it and more ideas pops from there.

* Replace hashtable growEnable flag
  2019-05-15 -> 2019-05-16
  https://www.postgresql.org/message-id/flat/CAB0yrekv%3D6_T_eUe2kOEvWUMwufcvfd15SFmCABtYFOkxCFdfA%40mail.gmail.com

  This one quickly merged to the next one.

* Avoiding hash join batch explosions with extreme skew and weird stats
  2019-05-16 -> 2020-09-24
  https://www.postgresql.org/message-id/flat/CA%2BhUKGKWWmf%3DWELLG%3DaUGbcugRaSQbtm0tKYiBut-B2rVKX63g%40mail.gmail.com

  Another thread discussing another facet of the problem, but eventually end up
  discussing / reviewing the BNLJ implementation.

Five possible fixes/ideas were discussed all over these threads:


1. "move BufFile stuff into separate context"
   last found patch: 2019-04-21
   https://www.postgresql.org/message-id/20190421114618.z3mpgmimc3rmubi4%40development
   https://www.postgresql.org/message-id/attachment/100822/0001-move-BufFile-stuff-into-separate-context.patch

   This patch helps with observability/debug by allocating the bufFiles in the
   appropriate context instead of the "ExecutorState" one.

   I suppose this simple one has been forgotten in the fog of all other
   discussions. Also, this probably worth to be backpatched.

2. "account for size of BatchFile structure in hashJoin"
   last found patch: 2019-04-22
   https://www.postgresql.org/message-id/20190428141901.5dsbge2ka3rxmpk6%40development
   https://www.postgresql.org/message-id/attachment/100951/v2-simple-rebalance.patch

   This patch seems like a good first step:

   * it definitely helps older versions where other patches discussed are way
     too invasive to be backpatched
   * it doesn't step on the way of other discussed patches

   While looking at the discussions around this patch, I was wondering if the
   planner considers the memory allocation of bufFiles. But of course, Melanie
   already noticed that long before I was aware of this problem and discussion:

   2019-07-10: «I do think that accounting for Buffile overhead when estimating
   the size of the hashtable during ExecChooseHashTableSize() so it can be
     used during planning is a worthwhile patch by itself (though I know it
     is not even part of this patch).»
   https://www.postgresql.org/message-id/CAAKRu_Yiam-%3D06L%2BR8FR%2BVaceb-ozQzzMqRiY2pDYku1VdZ%3DEw%40mail.gmail.com

   Tomas Vondra agreed with this in his answer, but no new version of the patch
   where produced.

   Finally, Melanie was pushing the idea to commit this patch no matter other
   pending patches/ideas:

   2019-09-05: «If Tomas or someone else has time to pick up and modify BufFile
     accounting patch, committing that still seems like the nest logical
     step.»
   https://www.postgresql.org/message-id/CAAKRu_b6%2BjC93WP%2BpWxqK5KAZJC5Rmxm8uquKtEf-KQ%2B%2B1Li6Q%40mail.gmail.com

   Unless I'm wrong, no one down voted this.

3. "per slice overflow file"
   last found patch: 2019-05-08
   https://www.postgresql.org/message-id/20190508150844.rij36rtuk4lhvztw%40development
   https://www.postgresql.org/message-id/attachment/101080/v4-per-slice-overflow-file-20190508.patch

   This patch has been withdraw after an off-list discussion with Thomas Munro
   because of a missing parallel hashJoin implementation. Plus, before any
   effort started on the parallel implementation, the BNLJ idea appeared and
   seemed more appealing.

   See:
   https://www.postgresql.org/message-id/20190529145517.sj2poqmb3cr4cg6w%40development

   By the time, it still seems to have some interest despite the BNLJ patch:

   2019-07-10: «If slicing is made to work for parallel-aware hashjoin and the
   code is in a committable state (and probably has the threshold I mentioned
     above), then I think that this patch should go in.»
   https://www.postgresql.org/message-id/CAAKRu_Yiam-%3D06L%2BR8FR%2BVaceb-ozQzzMqRiY2pDYku1VdZ%3DEw%40mail.gmail.com

   But this might have been disapproved later by Tomas:

   2019-09-10: «I have to admit I kinda lost track [...] My feeling is that we
     should get the BNLJ committed first, and then maybe use some of those
     additional strategies as fallbacks (depending on which issues are still
     unsolved by the BNLJ).»
   https://www.postgresql.org/message-id/20190910134751.x64idfqj6qgt37om%40development

4. "Block Nested Loop Join"
   last found patch: 2020-08-31
   https://www.postgresql.org/message-id/CAAKRu_aLMRHX6_y%3DK5i5wBMTMQvoPMO8DT3eyCziTHjsY11cVA%40mail.gmail.com
   https://www.postgresql.org/message-id/attachment/113608/v11-0001-Implement-Adaptive-Hashjoin.patch

   Most of the discussion was consideration about the BNLJ parallel and
   semi-join implementation. Melanie put a lot of work on this. This looks like
   the most advanced patch so far and add a fair amount of complexity.

   There were some open TODOs, but Melanie was waiting for some more review and
   feedback on v11 first.

5. Only split the skewed batches
   Discussion: 2019-07-11
   https://www.postgresql.org/message-id/CA%2BTgmoYqpbzC1g%2By0bxDFkpM60Kr2fnn0hVvT-RfVWonRY2dMA%40mail.gmail.com
   https://www.postgresql.org/message-id/CAB0yremvswRAT86Afb9MZ_PaLHyY9BT313-adCHbhMJ%3Dx_GEcg%40mail.gmail.com

   Robert Haas pointed out that current implementation and discussion were not
   really responding to the skew in a very effective way. He's considering
   splitting batches unevenly. Hubert Zhang stepped in, detailed some more and
   volunteer to work on such a patch.

   No one reacted.

   It seems to me this is an interesting track to explore. This looks like a
   good complement of 2. ("account for size of BatchFile structure in hashJoin"
   patch). However, this idea probably couldn't be backpatched.

   Note that it could help with 3. as well by slicing only the remaining skewed
   values.

   Also, this could have some impact on the "Block Nested Loop Join" patch if
   the later is kept to deal with the remaining skewed batches.

> I was hoping we'd solve this by the BNL, but if we didn't get that in 4
> years, maybe we shouldn't stall and get at least an imperfect stop-gap
> solution ...

Indeed. So, to sum-up:

* Patch 1 could be rebased/applied/backpatched
* Patch 2 is worth considering to backpatch
* Patch 3 seemed withdrawn in favor of BNLJ
* Patch 4 is waiting for some more review and has some TODO
* discussion 5 worth few minutes to discuss before jumping on previous topics

1 & 2 are imperfect solution but doesn't weight much and could be backpatched.
4 & 5 are long-term solutions for a futur major version needing some more
discussions, test and reviews.
3 is not 100% buried, but a last round in the arena might settle its destiny for
good.

Hopefully this sum-up is exhaustive and will help clarify this 3-years-old
topic.

Regards,
Hi there,

On Fri, 10 Mar 2023 19:51:14 +0100
Jehan-Guillaume de Rorthais <jgdr@dalibo.com> wrote:

> > So I guess the best thing would be to go through these threads, see what
> > the status is, restart the discussion and propose what to do. If you do
> > that, I'm happy to rebase the patches, and maybe see if I could improve
> > them in some way.
>
> [...]
>
> > I was hoping we'd solve this by the BNL, but if we didn't get that in 4
> > years, maybe we shouldn't stall and get at least an imperfect stop-gap
> > solution ...
>
> Indeed. So, to sum-up:
>
> * Patch 1 could be rebased/applied/backpatched

Would it help if I rebase Patch 1 ("move BufFile stuff into separate context")?

> * Patch 2 is worth considering to backpatch

Same question.

> * Patch 3 seemed withdrawn in favor of BNLJ
> * Patch 4 is waiting for some more review and has some TODO
> * discussion 5 worth few minutes to discuss before jumping on previous topics

These other patches needs more discussions and hacking. They have a low
priority compare to other discussions and running commitfest. However, how can
avoid losing them in limbo again?

Regards,
On 3/17/23 09:18, Jehan-Guillaume de Rorthais wrote:
> Hi there,
>
> On Fri, 10 Mar 2023 19:51:14 +0100
> Jehan-Guillaume de Rorthais <jgdr@dalibo.com> wrote:
>
>>> So I guess the best thing would be to go through these threads, see what
>>> the status is, restart the discussion and propose what to do. If you do
>>> that, I'm happy to rebase the patches, and maybe see if I could improve
>>> them in some way.
>>
>> [...]
>>
>>> I was hoping we'd solve this by the BNL, but if we didn't get that in 4
>>> years, maybe we shouldn't stall and get at least an imperfect stop-gap
>>> solution ...
>>
>> Indeed. So, to sum-up:
>>
>> * Patch 1 could be rebased/applied/backpatched
>
> Would it help if I rebase Patch 1 ("move BufFile stuff into separate context")?
>

Yeah, I think this is something we'd want to do. It doesn't change the
behavior, but it makes it easier to track the memory consumption etc.

>> * Patch 2 is worth considering to backpatch
>

I'm not quite sure what exactly are the numbered patches, as some of the
threads had a number of different patch ideas, and I'm not sure which
one was/is the most promising one.

IIRC there were two directions:

a) "balancing" i.e. increasing work_mem to minimize the total memory
consumption (best effort, but allowing exceeding work_mem)

b) limiting the number of BufFiles, and combining data from "future"
batches into a single file

I think the spilling is "nicer" in that it actually enforces work_mem
more strictly than (a), but we should probably spend a bit more time on
the exact spilling strategy. I only really tried two trivial ideas, but
maybe we can be smarter about allocating / sizing the files? Maybe
instead of slices of constant size we could/should make them larger,
similarly to what log-structured storage does.

For example we might double the number of batches a file represents, so
the first file would be for batch 1, the next one for batches 2+3, then
4+5+6+7, then 8-15, then 16-31, ...

We should have some model calculating (i) amount of disk space we would
need for the spilled files, and (ii) the amount of I/O we do when
writing the data between temp files.

> Same question.
>
>> * Patch 3 seemed withdrawn in favor of BNLJ
>> * Patch 4 is waiting for some more review and has some TODO
>> * discussion 5 worth few minutes to discuss before jumping on previous topics
>
> These other patches needs more discussions and hacking. They have a low
> priority compare to other discussions and running commitfest. However, how can
> avoid losing them in limbo again?
>

I think focusing on the backpatchability is not particularly good
approach. It's probably be better to fist check if there's any hope of
restarting the work on BNLJ, which seems like a "proper" solution for
the future.

It getting that soon (in PG17) is unlikely, let's revive the rebalance
and/or spilling patches. Imperfect but better than nothing.

And then in the end we can talk about if/what can be backpatched.


FWIW I don't think there's a lot of rush, considering this is clearly a
matter for PG17. So the summer CF at the earliest, people are going to
be busy until then.


regards

--
Tomas Vondra
EnterpriseDB: http://www.enterprisedb.com
The Enterprise PostgreSQL Company
On Fri, Mar 17, 2023 at 05:41:11PM +0100, Tomas Vondra wrote:
> >> * Patch 2 is worth considering to backpatch
>
> I'm not quite sure what exactly are the numbered patches, as some of the
> threads had a number of different patch ideas, and I'm not sure which
> one was/is the most promising one.

patch 2 is referring to the list of patches that was compiled
https://www.postgresql.org/message-id/20230310195114.6d0c5406%40karst
On 3/19/23 20:31, Justin Pryzby wrote:
> On Fri, Mar 17, 2023 at 05:41:11PM +0100, Tomas Vondra wrote:
>>>> * Patch 2 is worth considering to backpatch
>>
>> I'm not quite sure what exactly are the numbered patches, as some of the
>> threads had a number of different patch ideas, and I'm not sure which
>> one was/is the most promising one.
>
> patch 2 is referring to the list of patches that was compiled
> https://www.postgresql.org/message-id/20230310195114.6d0c5406%40karst

Ah, I see - it's just the "rebalancing" patch which minimizes the total
amount of memory used (i.e. grow work_mem a bit, so that we don't
allocate too many files).

Yeah, I think that's the best we can do without reworking how we spill
data (slicing or whatever).


regards

--
Tomas Vondra
EnterpriseDB: http://www.enterprisedb.com
The Enterprise PostgreSQL Company
On Mon, 20 Mar 2023 09:32:17 +0100
Tomas Vondra <tomas.vondra@enterprisedb.com> wrote:

> >> * Patch 1 could be rebased/applied/backpatched
> >
> > Would it help if I rebase Patch 1 ("move BufFile stuff into separate
> > context")?
>
> Yeah, I think this is something we'd want to do. It doesn't change the
> behavior, but it makes it easier to track the memory consumption etc.

Will do this week.

> I think focusing on the backpatchability is not particularly good
> approach. It's probably be better to fist check if there's any hope of
> restarting the work on BNLJ, which seems like a "proper" solution for
> the future.

Backpatching worth some consideration. Balancing is almost there and could help
in 16. As time is flying, it might well miss release 16, but maybe it could be
backpacthed in 16.1 or a later minor release? But what if it is not eligible for
backpatching? We would stall another year without having at least an imperfect
stop-gap solution (sorry for picking your words ;)).

BNJL and/or other considerations are for 17 or even after. In the meantime,
Melanie, who authored BNLJ, +1 the balancing patch as it can coexists with other
discussed solutions. No one down vote since then. Melanie, what is your
opinion today on this patch? Did you change your mind as you worked for many
months on BNLJ since then?

> On 3/19/23 20:31, Justin Pryzby wrote:
> > On Fri, Mar 17, 2023 at 05:41:11PM +0100, Tomas Vondra wrote:
> >>>> * Patch 2 is worth considering to backpatch
> >>
> >> I'm not quite sure what exactly are the numbered patches, as some of the
> >> threads had a number of different patch ideas, and I'm not sure which
> >> one was/is the most promising one.
> >
> > patch 2 is referring to the list of patches that was compiled
> > https://www.postgresql.org/message-id/20230310195114.6d0c5406%40karst
>
> Ah, I see - it's just the "rebalancing" patch which minimizes the total
> amount of memory used (i.e. grow work_mem a bit, so that we don't
> allocate too many files).
>
> Yeah, I think that's the best we can do without reworking how we spill
> data (slicing or whatever).

Indeed, that's why I was speaking about backpatching for this one:

* it surely helps 16 (and maybe previous release) in such skewed situation
* it's constrained
* it's not too invasive, it doesn't shake to whole algorithm all over the place
* Melanie was +1 for it, no one down vote.

What need to be discussed/worked:

* any regressions for existing queries running fine or without OOM?
* add the bufFile memory consumption in the planner considerations?

> I think the spilling is "nicer" in that it actually enforces work_mem
> more strictly than (a),

Sure it enforces work_mem more strictly, but this is a discussion for 17 or
later in my humble opinion.

> but we should probably spend a bit more time on
> the exact spilling strategy. I only really tried two trivial ideas, but
> maybe we can be smarter about allocating / sizing the files? Maybe
> instead of slices of constant size we could/should make them larger,
> similarly to what log-structured storage does.
>
> For example we might double the number of batches a file represents, so
> the first file would be for batch 1, the next one for batches 2+3, then
> 4+5+6+7, then 8-15, then 16-31, ...
>
> We should have some model calculating (i) amount of disk space we would
> need for the spilled files, and (ii) the amount of I/O we do when
> writing the data between temp files.

And:

* what about Robert's discussion on uneven batch distribution? Why is it
  ignored? Maybe there was some IRL or off-list discussions? Or did I missed
  some mails?
* what about dealing with all normal batch first, then revamp in
  freshly emptied batches the skewed ones, spliting them if needed, then rince &
  repeat? At some point, we would probably still need something like slicing
  and/or BNLJ though...

> let's revive the rebalance and/or spilling patches. Imperfect but better than
> nothing.

+1 for rebalance. I'm not even sure it could make it to 16 as we are running
out time, but it worth to try as it's the closest one that could be
reviewed and ready'd-for-commiter.

I might lack of ambition, but spilling patches seems too much to make it for
16. It seems to belongs with other larger patches/ideas (patches 4 a 5 in my sum
up). But this is just my humble feeling.

> And then in the end we can talk about if/what can be backpatched.
>
> FWIW I don't think there's a lot of rush, considering this is clearly a
> matter for PG17. So the summer CF at the earliest, people are going to
> be busy until then.

100% agree, there's no rush for patches 3, 4 ... and 5.

Thanks!
On Fri, Mar 10, 2023 at 1:51 PM Jehan-Guillaume de Rorthais
<jgdr@dalibo.com> wrote:
> > So I guess the best thing would be to go through these threads, see what
> > the status is, restart the discussion and propose what to do. If you do
> > that, I'm happy to rebase the patches, and maybe see if I could improve
> > them in some way.
>
> OK! It took me some time, but I did it. I'll try to sum up the situation as
> simply as possible.

Wow, so many memories!

I'm excited that someone looked at this old work (though it is sad that
a customer faced this issue). And, Jehan, I really appreciate your great
summarization of all these threads. This will be a useful reference.

> 1. "move BufFile stuff into separate context"
>    last found patch: 2019-04-21
>    https://www.postgresql.org/message-id/20190421114618.z3mpgmimc3rmubi4%40development
>    https://www.postgresql.org/message-id/attachment/100822/0001-move-BufFile-stuff-into-separate-context.patch
>
>    This patch helps with observability/debug by allocating the bufFiles in the
>    appropriate context instead of the "ExecutorState" one.
>
>    I suppose this simple one has been forgotten in the fog of all other
>    discussions. Also, this probably worth to be backpatched.

I agree with Jehan-Guillaume and Tomas that this seems fine to commit
alone.

Tomas:
> Yeah, I think this is something we'd want to do. It doesn't change the
> behavior, but it makes it easier to track the memory consumption etc.

> 2. "account for size of BatchFile structure in hashJoin"
>    last found patch: 2019-04-22
>    https://www.postgresql.org/message-id/20190428141901.5dsbge2ka3rxmpk6%40development
>    https://www.postgresql.org/message-id/attachment/100951/v2-simple-rebalance.patch
>
>    This patch seems like a good first step:
>
>    * it definitely helps older versions where other patches discussed are way
>      too invasive to be backpatched
>    * it doesn't step on the way of other discussed patches
>
>    While looking at the discussions around this patch, I was wondering if the
>    planner considers the memory allocation of bufFiles. But of course, Melanie
>    already noticed that long before I was aware of this problem and discussion:
>
>    2019-07-10: «I do think that accounting for Buffile overhead when estimating
>    the size of the hashtable during ExecChooseHashTableSize() so it can be
>      used during planning is a worthwhile patch by itself (though I know it
>      is not even part of this patch).»
>    https://www.postgresql.org/message-id/CAAKRu_Yiam-%3D06L%2BR8FR%2BVaceb-ozQzzMqRiY2pDYku1VdZ%3DEw%40mail.gmail.com
>
>    Tomas Vondra agreed with this in his answer, but no new version of the patch
>    where produced.
>
>    Finally, Melanie was pushing the idea to commit this patch no matter other
>    pending patches/ideas:
>
>    2019-09-05: «If Tomas or someone else has time to pick up and modify BufFile
>      accounting patch, committing that still seems like the nest logical
>      step.»
>    https://www.postgresql.org/message-id/CAAKRu_b6%2BjC93WP%2BpWxqK5KAZJC5Rmxm8uquKtEf-KQ%2B%2B1Li6Q%40mail.gmail.com

I think I would have to see a modern version of a patch which does this
to assess if it makes sense. But, I probably still agree with 2019
Melanie :)
Overall, I think anything that makes it faster to identify customer
cases of this bug is good (which, I would think granular memory contexts
and accounting would do). Even if it doesn't fix it, we can determine
more easily how often customers are hitting this issue, which helps
justify an admittedly large design change to hash join.

On Mon, Mar 20, 2023 at 10:12 AM Jehan-Guillaume de Rorthais
<jgdr@dalibo.com> wrote:
> BNJL and/or other considerations are for 17 or even after. In the meantime,
> Melanie, who authored BNLJ, +1 the balancing patch as it can coexists with other
> discussed solutions. No one down vote since then. Melanie, what is your
> opinion today on this patch? Did you change your mind as you worked for many
> months on BNLJ since then?

So, in order to avoid deadlock, my design of adaptive hash join/block
nested loop hash join required a new parallelism concept not yet in
Postgres at the time -- the idea of a lone worker remaining around to do
work when others have left.

See: BarrierArriveAndDetachExceptLast()
introduced in 7888b09994

Thomas Munro had suggested we needed to battle test this concept in a
more straightforward feature first, so I implemented parallel full outer
hash join and parallel right outer hash join with it.

https://commitfest.postgresql.org/42/2903/

This has been stalled ready-for-committer for two years. It happened to
change timing such that it made an existing rarely hit parallel hash
join bug more likely to be hit. Thomas recently committed our fix for
this in 8d578b9b2e37a4d (last week). It is my great hope that parallel
full outer hash join goes in before the 16 feature freeze.

If it does, I think it could make sense to try and find committable
smaller pieces of the adaptive hash join work. As it is today, parallel
hash join does not respect work_mem, and, in some sense, is a bit broken.

I would be happy to work on this feature again, or, if you were
interested in picking it up, to provide review and any help I can if for
you to work on it.

- Melanie
On 3/23/23 13:07, Melanie Plageman wrote:
> On Fri, Mar 10, 2023 at 1:51 PM Jehan-Guillaume de Rorthais
> <jgdr@dalibo.com> wrote:
>>> So I guess the best thing would be to go through these threads, see what
>>> the status is, restart the discussion and propose what to do. If you do
>>> that, I'm happy to rebase the patches, and maybe see if I could improve
>>> them in some way.
>>
>> OK! It took me some time, but I did it. I'll try to sum up the situation as
>> simply as possible.
>
> Wow, so many memories!
>
> I'm excited that someone looked at this old work (though it is sad that
> a customer faced this issue). And, Jehan, I really appreciate your great
> summarization of all these threads. This will be a useful reference.
> >> 1. "move BufFile stuff into separate context"
>>    last found patch: 2019-04-21
>>    https://www.postgresql.org/message-id/20190421114618.z3mpgmimc3rmubi4%40development
>>    https://www.postgresql.org/message-id/attachment/100822/0001-move-BufFile-stuff-into-separate-context.patch
>>
>>    This patch helps with observability/debug by allocating the bufFiles in the
>>    appropriate context instead of the "ExecutorState" one.
>>
>>    I suppose this simple one has been forgotten in the fog of all other
>>    discussions. Also, this probably worth to be backpatched.
>
> I agree with Jehan-Guillaume and Tomas that this seems fine to commit
> alone.
>

+1 to that. I think the separate memory contexts would be
non-controversial for backpatching too.

> Tomas:
>> Yeah, I think this is something we'd want to do. It doesn't change the
>> behavior, but it makes it easier to track the memory consumption etc.
>
>> 2. "account for size of BatchFile structure in hashJoin"
>>    last found patch: 2019-04-22
>>    https://www.postgresql.org/message-id/20190428141901.5dsbge2ka3rxmpk6%40development
>>    https://www.postgresql.org/message-id/attachment/100951/v2-simple-rebalance.patch
>>
>>    This patch seems like a good first step:
>>
>>    * it definitely helps older versions where other patches discussed are way
>>      too invasive to be backpatched
>>    * it doesn't step on the way of other discussed patches
>>
>>    While looking at the discussions around this patch, I was wondering if the
>>    planner considers the memory allocation of bufFiles. But of course, Melanie
>>    already noticed that long before I was aware of this problem and discussion:
>>
>>    2019-07-10: «I do think that accounting for Buffile overhead when estimating
>>    the size of the hashtable during ExecChooseHashTableSize() so it can be
>>      used during planning is a worthwhile patch by itself (though I know it
>>      is not even part of this patch).»
>>
https://www.postgresql.org/message-id/CAAKRu_Yiam-%3D06L%2BR8FR%2BVaceb-ozQzzMqRiY2pDYku1VdZ%3DEw%40mail.gmail.com
>>
>>    Tomas Vondra agreed with this in his answer, but no new version of the patch
>>    where produced.
>>
>>    Finally, Melanie was pushing the idea to commit this patch no matter other
>>    pending patches/ideas:
>>
>>    2019-09-05: «If Tomas or someone else has time to pick up and modify BufFile
>>      accounting patch, committing that still seems like the nest logical
>>      step.»
>>
https://www.postgresql.org/message-id/CAAKRu_b6%2BjC93WP%2BpWxqK5KAZJC5Rmxm8uquKtEf-KQ%2B%2B1Li6Q%40mail.gmail.com
>
> I think I would have to see a modern version of a patch which does this
> to assess if it makes sense. But, I probably still agree with 2019
> Melanie :)
> Overall, I think anything that makes it faster to identify customer
> cases of this bug is good (which, I would think granular memory contexts
> and accounting would do). Even if it doesn't fix it, we can determine
> more easily how often customers are hitting this issue, which helps
> justify an admittedly large design change to hash join.
>

Agreed. This issue is quite rare (we only get a report once a year or
two), just enough to forget about it and have to rediscover it's there.
So having something that clearly identifies it would be good.

A separate BufFile memory context helps, although people won't see it
unless they attach a debugger, I think. Better than nothing, but I was
wondering if we could maybe print some warnings when the number of batch
files gets too high ...

> On Mon, Mar 20, 2023 at 10:12 AM Jehan-Guillaume de Rorthais
> <jgdr@dalibo.com> wrote:
>> BNJL and/or other considerations are for 17 or even after. In the meantime,
>> Melanie, who authored BNLJ, +1 the balancing patch as it can coexists with other
>> discussed solutions. No one down vote since then. Melanie, what is your
>> opinion today on this patch? Did you change your mind as you worked for many
>> months on BNLJ since then?
>
> So, in order to avoid deadlock, my design of adaptive hash join/block
> nested loop hash join required a new parallelism concept not yet in
> Postgres at the time -- the idea of a lone worker remaining around to do
> work when others have left.
>
> See: BarrierArriveAndDetachExceptLast()
> introduced in 7888b09994
>
> Thomas Munro had suggested we needed to battle test this concept in a
> more straightforward feature first, so I implemented parallel full outer
> hash join and parallel right outer hash join with it.
>
> https://commitfest.postgresql.org/42/2903/
>
> This has been stalled ready-for-committer for two years. It happened to
> change timing such that it made an existing rarely hit parallel hash
> join bug more likely to be hit. Thomas recently committed our fix for
> this in 8d578b9b2e37a4d (last week). It is my great hope that parallel
> full outer hash join goes in before the 16 feature freeze.
>

Good to hear this is moving forward.

> If it does, I think it could make sense to try and find committable
> smaller pieces of the adaptive hash join work. As it is today, parallel
> hash join does not respect work_mem, and, in some sense, is a bit broken.
>
> I would be happy to work on this feature again, or, if you were
> interested in picking it up, to provide review and any help I can if for
> you to work on it.
>

I'm no expert in parallel hashjoin expert, but I'm willing to take a
look a rebased patch. I'd however recommend breaking the patch into
smaller pieces - the last version I see in the thread is ~250kB, which
is rather daunting, and difficult to review without interruption. (I
don't remember the details of the patch, so maybe that's not possible
for some reason.)


regards

--
Tomas Vondra
EnterpriseDB: http://www.enterprisedb.com
The Enterprise PostgreSQL Company
On Thu, Mar 23, 2023 at 2:49 PM Tomas Vondra
<tomas.vondra@enterprisedb.com> wrote:
> > On Mon, Mar 20, 2023 at 10:12 AM Jehan-Guillaume de Rorthais
> > <jgdr@dalibo.com> wrote:
> >> BNJL and/or other considerations are for 17 or even after. In the meantime,
> >> Melanie, who authored BNLJ, +1 the balancing patch as it can coexists with other
> >> discussed solutions. No one down vote since then. Melanie, what is your
> >> opinion today on this patch? Did you change your mind as you worked for many
> >> months on BNLJ since then?
> >
> > So, in order to avoid deadlock, my design of adaptive hash join/block
> > nested loop hash join required a new parallelism concept not yet in
> > Postgres at the time -- the idea of a lone worker remaining around to do
> > work when others have left.
> >
> > See: BarrierArriveAndDetachExceptLast()
> > introduced in 7888b09994
> >
> > Thomas Munro had suggested we needed to battle test this concept in a
> > more straightforward feature first, so I implemented parallel full outer
> > hash join and parallel right outer hash join with it.
> >
> > https://commitfest.postgresql.org/42/2903/
> >
> > This has been stalled ready-for-committer for two years. It happened to
> > change timing such that it made an existing rarely hit parallel hash
> > join bug more likely to be hit. Thomas recently committed our fix for
> > this in 8d578b9b2e37a4d (last week). It is my great hope that parallel
> > full outer hash join goes in before the 16 feature freeze.
> >
>
> Good to hear this is moving forward.
>
> > If it does, I think it could make sense to try and find committable
> > smaller pieces of the adaptive hash join work. As it is today, parallel
> > hash join does not respect work_mem, and, in some sense, is a bit broken.
> >
> > I would be happy to work on this feature again, or, if you were
> > interested in picking it up, to provide review and any help I can if for
> > you to work on it.
> >
>
> I'm no expert in parallel hashjoin expert, but I'm willing to take a
> look a rebased patch. I'd however recommend breaking the patch into
> smaller pieces - the last version I see in the thread is ~250kB, which
> is rather daunting, and difficult to review without interruption. (I
> don't remember the details of the patch, so maybe that's not possible
> for some reason.)

Great! I will rebase and take a stab at splitting up the patch into
smaller commits, with a focus on finding pieces that may have standalone
benefits, in the 17 dev cycle.

- Melanie
Hi,

On Mon, 20 Mar 2023 15:12:34 +0100
Jehan-Guillaume de Rorthais <jgdr@dalibo.com> wrote:

> On Mon, 20 Mar 2023 09:32:17 +0100
> Tomas Vondra <tomas.vondra@enterprisedb.com> wrote:
>
> > >> * Patch 1 could be rebased/applied/backpatched
> > >
> > > Would it help if I rebase Patch 1 ("move BufFile stuff into separate
> > > context")?
> >
> > Yeah, I think this is something we'd want to do. It doesn't change the
> > behavior, but it makes it easier to track the memory consumption etc.
>
> Will do this week.

Please, find in attachment a patch to allocate bufFiles in a dedicated context.
I picked up your patch, backpatch'd it, went through it and did some minor
changes to it. I have some comment/questions thought.

  1. I'm not sure why we must allocate the "HashBatchFiles" new context
  under ExecutorState and not under hashtable->hashCxt?

  The only references I could find was in hashjoin.h:30:

   /* [...]
    * [...] (Exception: data associated with the temp files lives in the
    * per-query context too, since we always call buffile.c in that context.)

  And in nodeHashjoin.c:1243:ExecHashJoinSaveTuple() (I reworded this
  original comment in the patch):

   /* [...]
    * Note: it is important always to call this in the regular executor
    * context, not in a shorter-lived context; else the temp file buffers
    * will get messed up.


  But these are not explanation of why BufFile related allocations must be under
  a per-query context.


  2. Wrapping each call of ExecHashJoinSaveTuple() with a memory context switch
  seems fragile as it could be forgotten in futur code path/changes. So I
  added an Assert() in the function to make sure the current memory context is
  "HashBatchFiles" as expected.
  Another way to tie this up might be to pass the memory context as argument to
  the function.
  ... Or maybe I'm over precautionary.


  3. You wrote:

>> A separate BufFile memory context helps, although people won't see it
>> unless they attach a debugger, I think. Better than nothing, but I was
>> wondering if we could maybe print some warnings when the number of batch
>> files gets too high ...

  So I added a WARNING when batches memory are exhausting the memory size
  allowed.

   +   if (hashtable->fileCxt->mem_allocated > hashtable->spaceAllowed)
   +       elog(WARNING, "Growing number of hash batch is exhausting memory");

  This is repeated on each call of ExecHashIncreaseNumBatches when BufFile
  overflows the memory budget. I realize now I should probably add the memory
  limit, the number of current batch and their memory consumption.
  The message is probably too cryptic for a user. It could probably be
  reworded, but some doc or additionnal hint around this message might help.

  4. I left the debug messages for some more review rounds

Regards,
Attachment
On 3/27/23 23:13, Jehan-Guillaume de Rorthais wrote:
> Hi,
>
> On Mon, 20 Mar 2023 15:12:34 +0100
> Jehan-Guillaume de Rorthais <jgdr@dalibo.com> wrote:
>
>> On Mon, 20 Mar 2023 09:32:17 +0100
>> Tomas Vondra <tomas.vondra@enterprisedb.com> wrote:
>>
>>>>> * Patch 1 could be rebased/applied/backpatched
>>>>
>>>> Would it help if I rebase Patch 1 ("move BufFile stuff into separate
>>>> context")?
>>>
>>> Yeah, I think this is something we'd want to do. It doesn't change the
>>> behavior, but it makes it easier to track the memory consumption etc.
>>
>> Will do this week.
>
> Please, find in attachment a patch to allocate bufFiles in a dedicated context.
> I picked up your patch, backpatch'd it, went through it and did some minor
> changes to it. I have some comment/questions thought.
>
>   1. I'm not sure why we must allocate the "HashBatchFiles" new context
>   under ExecutorState and not under hashtable->hashCxt?
>
>   The only references I could find was in hashjoin.h:30:
>
>    /* [...]
>     * [...] (Exception: data associated with the temp files lives in the
>     * per-query context too, since we always call buffile.c in that context.)
>
>   And in nodeHashjoin.c:1243:ExecHashJoinSaveTuple() (I reworded this
>   original comment in the patch):
>
>    /* [...]
>     * Note: it is important always to call this in the regular executor
>     * context, not in a shorter-lived context; else the temp file buffers
>     * will get messed up.
>
>
>   But these are not explanation of why BufFile related allocations must be under
>   a per-query context.
>

Doesn't that simply describe the current (unpatched) behavior where
BufFile is allocated in the per-query context? I mean, the current code
calls BufFileCreateTemp() without switching the context, so it's in the
ExecutorState. But with the patch it very clearly is not.

And I'm pretty sure the patch should do

    hashtable->fileCxt = AllocSetContextCreate(hashtable->hashCxt,
                                         "HashBatchFiles",
                                         ALLOCSET_DEFAULT_SIZES);

and it'd still work. Or why do you think we *must* allocate it under
ExecutorState?

FWIW The comment in hashjoin.h needs updating to reflect the change.

>
>   2. Wrapping each call of ExecHashJoinSaveTuple() with a memory context switch
>   seems fragile as it could be forgotten in futur code path/changes. So I
>   added an Assert() in the function to make sure the current memory context is
>   "HashBatchFiles" as expected.
>   Another way to tie this up might be to pass the memory context as argument to
>   the function.
>   ... Or maybe I'm over precautionary.
>

I'm not sure I'd call that fragile, we have plenty other code that
expects the memory context to be set correctly. Not sure about the
assert, but we don't have similar asserts anywhere else.

But I think it's just ugly and overly verbose - it'd be much nicer to
e.g. pass the memory context as a parameter, and do the switch inside.

>
>   3. You wrote:
>
>>> A separate BufFile memory context helps, although people won't see it
>>> unless they attach a debugger, I think. Better than nothing, but I was
>>> wondering if we could maybe print some warnings when the number of batch
>>> files gets too high ...
>
>   So I added a WARNING when batches memory are exhausting the memory size
>   allowed.
>
>    +   if (hashtable->fileCxt->mem_allocated > hashtable->spaceAllowed)
>    +       elog(WARNING, "Growing number of hash batch is exhausting memory");
>
>   This is repeated on each call of ExecHashIncreaseNumBatches when BufFile
>   overflows the memory budget. I realize now I should probably add the memory
>   limit, the number of current batch and their memory consumption.
>   The message is probably too cryptic for a user. It could probably be
>   reworded, but some doc or additionnal hint around this message might help.
>

Hmmm, not sure is WARNING is a good approach, but I don't have a better
idea at the moment.

>   4. I left the debug messages for some more review rounds
>

OK


regards

--
Tomas Vondra
EnterpriseDB: http://www.enterprisedb.com
The Enterprise PostgreSQL Company
On Tue, 28 Mar 2023 00:43:34 +0200
Tomas Vondra <tomas.vondra@enterprisedb.com> wrote:

> On 3/27/23 23:13, Jehan-Guillaume de Rorthais wrote:
> > Please, find in attachment a patch to allocate bufFiles in a dedicated
> > context. I picked up your patch, backpatch'd it, went through it and did
> > some minor changes to it. I have some comment/questions thought.
> >
> >   1. I'm not sure why we must allocate the "HashBatchFiles" new context
> >   under ExecutorState and not under hashtable->hashCxt?
> >
> >   The only references I could find was in hashjoin.h:30:
> >
> >    /* [...]
> >     * [...] (Exception: data associated with the temp files lives in the
> >     * per-query context too, since we always call buffile.c in that
> > context.)
> >
> >   And in nodeHashjoin.c:1243:ExecHashJoinSaveTuple() (I reworded this
> >   original comment in the patch):
> >
> >    /* [...]
> >     * Note: it is important always to call this in the regular executor
> >     * context, not in a shorter-lived context; else the temp file buffers
> >     * will get messed up.
> >
> >
> >   But these are not explanation of why BufFile related allocations must be
> > under a per-query context.
> >
>
> Doesn't that simply describe the current (unpatched) behavior where
> BufFile is allocated in the per-query context?

I wasn't sure. The first quote from hashjoin.h seems to describe a stronger
rule about «**always** call buffile.c in per-query context». But maybe it ought
to be «always call buffile.c from one of the sub-query context»? I assume the
aim is to enforce the tmp files removal on query end/error?

> I mean, the current code calls BufFileCreateTemp() without switching the
> context, so it's in the ExecutorState. But with the patch it very clearly is
> not.
>
> And I'm pretty sure the patch should do
>
>     hashtable->fileCxt = AllocSetContextCreate(hashtable->hashCxt,
>                                          "HashBatchFiles",
>                                          ALLOCSET_DEFAULT_SIZES);
>
> and it'd still work. Or why do you think we *must* allocate it under
> ExecutorState?

That was actually my very first patch and it indeed worked. But I was confused
about the previous quoted code comments. That's why I kept your original code
and decided to rise the discussion here.

Fixed in new patch in attachment.

> FWIW The comment in hashjoin.h needs updating to reflect the change.

Done in the last patch. Is my rewording accurate?

> >   2. Wrapping each call of ExecHashJoinSaveTuple() with a memory context
> > switch seems fragile as it could be forgotten in futur code path/changes.
> > So I added an Assert() in the function to make sure the current memory
> > context is "HashBatchFiles" as expected.
> >   Another way to tie this up might be to pass the memory context as
> > argument to the function.
> >   ... Or maybe I'm over precautionary.
> >
>
> I'm not sure I'd call that fragile, we have plenty other code that
> expects the memory context to be set correctly. Not sure about the
> assert, but we don't have similar asserts anywhere else.

I mostly sticked it there to stimulate the discussion around this as I needed
to scratch that itch.

> But I think it's just ugly and overly verbose

+1

Your patch was just a demo/debug patch by the time. It needed some cleanup now
:)

> it'd be much nicer to e.g. pass the memory context as a parameter, and do
> the switch inside.

That was a proposition in my previous mail, so I did it in the new patch. Let's
see what other reviewers think.

> >   3. You wrote:
> >
> >>> A separate BufFile memory context helps, although people won't see it
> >>> unless they attach a debugger, I think. Better than nothing, but I was
> >>> wondering if we could maybe print some warnings when the number of batch
> >>> files gets too high ...
> >
> >   So I added a WARNING when batches memory are exhausting the memory size
> >   allowed.
> >
> >    +   if (hashtable->fileCxt->mem_allocated > hashtable->spaceAllowed)
> >    +       elog(WARNING, "Growing number of hash batch is exhausting
> > memory");
> >
> >   This is repeated on each call of ExecHashIncreaseNumBatches when BufFile
> >   overflows the memory budget. I realize now I should probably add the
> > memory limit, the number of current batch and their memory consumption.
> >   The message is probably too cryptic for a user. It could probably be
> >   reworded, but some doc or additionnal hint around this message might help.
> >
>
> Hmmm, not sure is WARNING is a good approach, but I don't have a better
> idea at the moment.

I stepped it down to NOTICE and added some more infos.

Here is the output of the last patch with a 1MB work_mem:

  =# explain analyze select * from small join large using (id);
  WARNING:  increasing number of batches from 1 to 2
  WARNING:  increasing number of batches from 2 to 4
  WARNING:  increasing number of batches from 4 to 8
  WARNING:  increasing number of batches from 8 to 16
  WARNING:  increasing number of batches from 16 to 32
  WARNING:  increasing number of batches from 32 to 64
  WARNING:  increasing number of batches from 64 to 128
  WARNING:  increasing number of batches from 128 to 256
  WARNING:  increasing number of batches from 256 to 512
  NOTICE:  Growing number of hash batch to 512 is exhausting allowed memory
           (2164736 > 2097152)
  WARNING:  increasing number of batches from 512 to 1024
  NOTICE:  Growing number of hash batch to 1024 is exhausting allowed memory
           (4329472 > 2097152)
  WARNING:  increasing number of batches from 1024 to 2048
  NOTICE:  Growing number of hash batch to 2048 is exhausting allowed memory
           (8626304 > 2097152)
  WARNING:  increasing number of batches from 2048 to 4096
  NOTICE:  Growing number of hash batch to 4096 is exhausting allowed memory
           (17252480 > 2097152)
  WARNING:  increasing number of batches from 4096 to 8192
  NOTICE:  Growing number of hash batch to 8192 is exhausting allowed memory
           (34504832 > 2097152)
  WARNING:  increasing number of batches from 8192 to 16384
  NOTICE:  Growing number of hash batch to 16384 is exhausting allowed memory
           (68747392 > 2097152)
  WARNING:  increasing number of batches from 16384 to 32768
  NOTICE:  Growing number of hash batch to 32768 is exhausting allowed memory
           (137494656 > 2097152)

                                QUERY PLAN
  --------------------------------------------------------------------------
  Hash Join  (cost=6542057.16..7834651.23 rows=7 width=74)
             (actual time=558502.127..724007.708 rows=7040 loops=1)
             Hash Cond: (small.id = large.id)
  ->  Seq Scan on small (cost=0.00..940094.00 rows=94000000 width=41)
                        (actual time=0.035..3.666 rows=10000 loops=1)
  ->  Hash (cost=6542057.07..6542057.07 rows=7 width=41)
           (actual time=558184.152..558184.153 rows=700000000 loops=1)
           Buckets: 32768 (originally 1024)
           Batches: 32768 (originally 1)
           Memory Usage: 1921kB
    -> Seq Scan on large (cost=0.00..6542057.07 rows=7 width=41)
                         (actual time=0.324..193750.567 rows=700000000 loops=1)
  Planning Time: 1.588 ms
  Execution Time: 724011.074 ms (8 rows)

Regards,
Attachment
Hi,

Sorry for the late answer, I was reviewing the first patch and it took me some
time to study and dig around.

On Thu, 23 Mar 2023 08:07:04 -0400
Melanie Plageman <melanieplageman@gmail.com> wrote:

> On Fri, Mar 10, 2023 at 1:51 PM Jehan-Guillaume de Rorthais
> <jgdr@dalibo.com> wrote:
> > > So I guess the best thing would be to go through these threads, see what
> > > the status is, restart the discussion and propose what to do. If you do
> > > that, I'm happy to rebase the patches, and maybe see if I could improve
> > > them in some way.
> >
> > OK! It took me some time, but I did it. I'll try to sum up the situation as
> > simply as possible.
>
> Wow, so many memories!
>
> I'm excited that someone looked at this old work (though it is sad that
> a customer faced this issue). And, Jehan, I really appreciate your great
> summarization of all these threads. This will be a useful reference.

Thank you!

> > 1. "move BufFile stuff into separate context"
> > [...]
> >    I suppose this simple one has been forgotten in the fog of all other
> >    discussions. Also, this probably worth to be backpatched.
>
> I agree with Jehan-Guillaume and Tomas that this seems fine to commit
> alone.

This is a WIP.

> > 2. "account for size of BatchFile structure in hashJoin"
> > [...]
>
> I think I would have to see a modern version of a patch which does this
> to assess if it makes sense. But, I probably still agree with 2019
> Melanie :)

I volunteer to work on this after the memory context patch, unless someone grab
it in the meantime.

> [...]
> On Mon, Mar 20, 2023 at 10:12 AM Jehan-Guillaume de Rorthais
> <jgdr@dalibo.com> wrote:
> > BNJL and/or other considerations are for 17 or even after. In the meantime,
> > Melanie, who authored BNLJ, +1 the balancing patch as it can coexists with
> > other discussed solutions. No one down vote since then. Melanie, what is
> > your opinion today on this patch? Did you change your mind as you worked
> > for many months on BNLJ since then?
>
> So, in order to avoid deadlock, my design of adaptive hash join/block
> nested loop hash join required a new parallelism concept not yet in
> Postgres at the time -- the idea of a lone worker remaining around to do
> work when others have left.
>
> See: BarrierArriveAndDetachExceptLast()
> introduced in 7888b09994
>
> Thomas Munro had suggested we needed to battle test this concept in a
> more straightforward feature first, so I implemented parallel full outer
> hash join and parallel right outer hash join with it.
>
> https://commitfest.postgresql.org/42/2903/
>
> This has been stalled ready-for-committer for two years. It happened to
> change timing such that it made an existing rarely hit parallel hash
> join bug more likely to be hit. Thomas recently committed our fix for
> this in 8d578b9b2e37a4d (last week). It is my great hope that parallel
> full outer hash join goes in before the 16 feature freeze.

This is really interesting to follow. I kinda feel/remember how this could
be useful for your BNLJ patch. It's good to see things are moving, step by
step.

Thanks for the pointers.

> If it does, I think it could make sense to try and find committable
> smaller pieces of the adaptive hash join work. As it is today, parallel
> hash join does not respect work_mem, and, in some sense, is a bit broken.
>
> I would be happy to work on this feature again, or, if you were
> interested in picking it up, to provide review and any help I can if for
> you to work on it.

I don't think I would be able to pick up such a large and complex patch. But I'm
interested to help, test and review, as far as I can!

Regards,
On 3/28/23 15:17, Jehan-Guillaume de Rorthais wrote:
> On Tue, 28 Mar 2023 00:43:34 +0200
> Tomas Vondra <tomas.vondra@enterprisedb.com> wrote:
>
>> On 3/27/23 23:13, Jehan-Guillaume de Rorthais wrote:
>>> Please, find in attachment a patch to allocate bufFiles in a dedicated
>>> context. I picked up your patch, backpatch'd it, went through it and did
>>> some minor changes to it. I have some comment/questions thought.
>>>
>>>   1. I'm not sure why we must allocate the "HashBatchFiles" new context
>>>   under ExecutorState and not under hashtable->hashCxt?
>>>
>>>   The only references I could find was in hashjoin.h:30:
>>>
>>>    /* [...]
>>>     * [...] (Exception: data associated with the temp files lives in the
>>>     * per-query context too, since we always call buffile.c in that
>>> context.)
>>>
>>>   And in nodeHashjoin.c:1243:ExecHashJoinSaveTuple() (I reworded this
>>>   original comment in the patch):
>>>
>>>    /* [...]
>>>     * Note: it is important always to call this in the regular executor
>>>     * context, not in a shorter-lived context; else the temp file buffers
>>>     * will get messed up.
>>>
>>>
>>>   But these are not explanation of why BufFile related allocations must be
>>> under a per-query context.
>>>
>>
>> Doesn't that simply describe the current (unpatched) behavior where
>> BufFile is allocated in the per-query context?
>
> I wasn't sure. The first quote from hashjoin.h seems to describe a stronger
> rule about «**always** call buffile.c in per-query context». But maybe it ought
> to be «always call buffile.c from one of the sub-query context»? I assume the
> aim is to enforce the tmp files removal on query end/error?
>

I don't think we need this info for tempfile cleanup - CleanupTempFiles
relies on the VfdCache, which does malloc/realloc (so it's not using
memory contexts at all).

I'm not very familiar with this part of the code, so I might be missing
something. But you can try that - just stick an elog(ERROR) somewhere
into the hashjoin code, and see if that breaks the cleanup.

Not an explicit proof, but if there was some hard-wired requirement in
which memory context to allocate BufFile stuff, I'd expect it to be
documented in buffile.c. But that actually says this:

 * Note that BufFile structs are allocated with palloc(), and therefore
 * will go away automatically at query/transaction end.  Since the
underlying
 * virtual Files are made with OpenTemporaryFile, all resources for
 * the file are certain to be cleaned up even if processing is aborted
 * by ereport(ERROR).  The data structures required are made in the
 * palloc context that was current when the BufFile was created, and
 * any external resources such as temp files are owned by the ResourceOwner
 * that was current at that time.

which I take as confirmation that it's legal to allocate BufFile in any
memory context, and that cleanup is handled by the cache in fd.c.


>> I mean, the current code calls BufFileCreateTemp() without switching the
>> context, so it's in the ExecutorState. But with the patch it very clearly is
>> not.
>>
>> And I'm pretty sure the patch should do
>>
>>     hashtable->fileCxt = AllocSetContextCreate(hashtable->hashCxt,
>>                                          "HashBatchFiles",
>>                                          ALLOCSET_DEFAULT_SIZES);
>>
>> and it'd still work. Or why do you think we *must* allocate it under
>> ExecutorState?
>
> That was actually my very first patch and it indeed worked. But I was confused
> about the previous quoted code comments. That's why I kept your original code
> and decided to rise the discussion here.
>

IIRC I was just lazy when writing the experimental patch, there was not
much thought about stuff like this.

> Fixed in new patch in attachment.
>
>> FWIW The comment in hashjoin.h needs updating to reflect the change.
>
> Done in the last patch. Is my rewording accurate?
>
>>>   2. Wrapping each call of ExecHashJoinSaveTuple() with a memory context
>>> switch seems fragile as it could be forgotten in futur code path/changes.
>>> So I added an Assert() in the function to make sure the current memory
>>> context is "HashBatchFiles" as expected.
>>>   Another way to tie this up might be to pass the memory context as
>>> argument to the function.
>>>   ... Or maybe I'm over precautionary.
>>>
>>
>> I'm not sure I'd call that fragile, we have plenty other code that
>> expects the memory context to be set correctly. Not sure about the
>> assert, but we don't have similar asserts anywhere else.
>
> I mostly sticked it there to stimulate the discussion around this as I needed
> to scratch that itch.
>
>> But I think it's just ugly and overly verbose
>
> +1
>
> Your patch was just a demo/debug patch by the time. It needed some cleanup now
> :)
>
>> it'd be much nicer to e.g. pass the memory context as a parameter, and do
>> the switch inside.
>
> That was a proposition in my previous mail, so I did it in the new patch. Let's
> see what other reviewers think.
>

+1

>>>   3. You wrote:
>>>
>>>>> A separate BufFile memory context helps, although people won't see it
>>>>> unless they attach a debugger, I think. Better than nothing, but I was
>>>>> wondering if we could maybe print some warnings when the number of batch
>>>>> files gets too high ...
>>>
>>>   So I added a WARNING when batches memory are exhausting the memory size
>>>   allowed.
>>>
>>>    +   if (hashtable->fileCxt->mem_allocated > hashtable->spaceAllowed)
>>>    +       elog(WARNING, "Growing number of hash batch is exhausting
>>> memory");
>>>
>>>   This is repeated on each call of ExecHashIncreaseNumBatches when BufFile
>>>   overflows the memory budget. I realize now I should probably add the
>>> memory limit, the number of current batch and their memory consumption.
>>>   The message is probably too cryptic for a user. It could probably be
>>>   reworded, but some doc or additionnal hint around this message might help.
>>>
>>
>> Hmmm, not sure is WARNING is a good approach, but I don't have a better
>> idea at the moment.
>
> I stepped it down to NOTICE and added some more infos.
>
> Here is the output of the last patch with a 1MB work_mem:
>
>   =# explain analyze select * from small join large using (id);
>   WARNING:  increasing number of batches from 1 to 2
>   WARNING:  increasing number of batches from 2 to 4
>   WARNING:  increasing number of batches from 4 to 8
>   WARNING:  increasing number of batches from 8 to 16
>   WARNING:  increasing number of batches from 16 to 32
>   WARNING:  increasing number of batches from 32 to 64
>   WARNING:  increasing number of batches from 64 to 128
>   WARNING:  increasing number of batches from 128 to 256
>   WARNING:  increasing number of batches from 256 to 512
>   NOTICE:  Growing number of hash batch to 512 is exhausting allowed memory
>            (2164736 > 2097152)
>   WARNING:  increasing number of batches from 512 to 1024
>   NOTICE:  Growing number of hash batch to 1024 is exhausting allowed memory
>            (4329472 > 2097152)
>   WARNING:  increasing number of batches from 1024 to 2048
>   NOTICE:  Growing number of hash batch to 2048 is exhausting allowed memory
>            (8626304 > 2097152)
>   WARNING:  increasing number of batches from 2048 to 4096
>   NOTICE:  Growing number of hash batch to 4096 is exhausting allowed memory
>            (17252480 > 2097152)
>   WARNING:  increasing number of batches from 4096 to 8192
>   NOTICE:  Growing number of hash batch to 8192 is exhausting allowed memory
>            (34504832 > 2097152)
>   WARNING:  increasing number of batches from 8192 to 16384
>   NOTICE:  Growing number of hash batch to 16384 is exhausting allowed memory
>            (68747392 > 2097152)
>   WARNING:  increasing number of batches from 16384 to 32768
>   NOTICE:  Growing number of hash batch to 32768 is exhausting allowed memory
>            (137494656 > 2097152)
>
>                                 QUERY PLAN
>   --------------------------------------------------------------------------
>   Hash Join  (cost=6542057.16..7834651.23 rows=7 width=74)
>              (actual time=558502.127..724007.708 rows=7040 loops=1)
>              Hash Cond: (small.id = large.id)
>   ->  Seq Scan on small (cost=0.00..940094.00 rows=94000000 width=41)
>                         (actual time=0.035..3.666 rows=10000 loops=1)
>   ->  Hash (cost=6542057.07..6542057.07 rows=7 width=41)
>            (actual time=558184.152..558184.153 rows=700000000 loops=1)
>            Buckets: 32768 (originally 1024)
>            Batches: 32768 (originally 1)
>            Memory Usage: 1921kB
>     -> Seq Scan on large (cost=0.00..6542057.07 rows=7 width=41)
>                          (actual time=0.324..193750.567 rows=700000000 loops=1)
>   Planning Time: 1.588 ms
>   Execution Time: 724011.074 ms (8 rows)
>
> Regards,

OK, although NOTICE that may actually make it less useful - the default
level is WARNING, and regular users are unable to change the level. So
very few people will actually see these messages.


thanks

--
Tomas Vondra
EnterpriseDB: http://www.enterprisedb.com
The Enterprise PostgreSQL Company
On Tue, 28 Mar 2023 17:25:49 +0200
Tomas Vondra <tomas.vondra@enterprisedb.com> wrote:
...
>  * Note that BufFile structs are allocated with palloc(), and therefore
>  * will go away automatically at query/transaction end.  Since the
> underlying
>  * virtual Files are made with OpenTemporaryFile, all resources for
>  * the file are certain to be cleaned up even if processing is aborted
>  * by ereport(ERROR).  The data structures required are made in the
>  * palloc context that was current when the BufFile was created, and
>  * any external resources such as temp files are owned by the ResourceOwner
>  * that was current at that time.
>
> which I take as confirmation that it's legal to allocate BufFile in any
> memory context, and that cleanup is handled by the cache in fd.c.

OK. I just over interpreted comments and been over prudent.

> [...]
> >> Hmmm, not sure is WARNING is a good approach, but I don't have a better
> >> idea at the moment.
> >
> > I stepped it down to NOTICE and added some more infos.
> >
> > [...]
> >   NOTICE:  Growing number of hash batch to 32768 is exhausting allowed
> > memory (137494656 > 2097152)
> [...]
>
> OK, although NOTICE that may actually make it less useful - the default
> level is WARNING, and regular users are unable to change the level. So
> very few people will actually see these messages.

The main purpose of NOTICE was to notice user/dev, as client_min_messages=notice
by default.

But while playing with it, I wonder if the message is in the good place anyway.
It is probably pessimistic as it shows memory consumption when increasing the
number of batch, but before actual buffile are (lazily) allocated. The message
should probably pop a bit sooner with better numbers.

Anyway, maybe this should be added in the light of next patch, balancing
between increasing batches and allowed memory. The WARNING/LOG/NOTICE message
could appears when we actually break memory rules because of some bad HJ
situation.

Another way to expose the bad memory consumption would be to add memory infos to
the HJ node in the explain output, or maybe collect some min/max/mean for
pg_stat_statement, but I suspect tracking memory spikes by query is another
challenge altogether...

In the meantime, find in attachment v3 of the patch with debug and NOTICE
messages removed. Given the same plan from my previous email, here is the
memory contexts close to the query end:

 ExecutorState: 32768 total in 3 blocks; 15512 free (6 chunks); 17256 used
   HashTableContext: 8192 total in 1 blocks; 7720 free (0 chunks); 472 used
    HashBatchFiles: 28605680 total in 3256 blocks; 970128 free (38180 chunks);
                    27635552 used
    HashBatchContext: 960544 total in 23 blocks; 7928 free (0 chunks); 952616 used


Regards,
Attachment
On Fri, 31 Mar 2023 14:06:11 +0200
Jehan-Guillaume de Rorthais <jgdr@dalibo.com> wrote:

> > [...]
> > >> Hmmm, not sure is WARNING is a good approach, but I don't have a better
> > >> idea at the moment.
> > >
> > > I stepped it down to NOTICE and added some more infos.
> > >
> > > [...]
> > >   NOTICE:  Growing number of hash batch to 32768 is exhausting allowed
> > > memory (137494656 > 2097152)
> > [...]
> >
> > OK, although NOTICE that may actually make it less useful - the default
> > level is WARNING, and regular users are unable to change the level. So
> > very few people will actually see these messages.
[...]
> Anyway, maybe this should be added in the light of next patch, balancing
> between increasing batches and allowed memory. The WARNING/LOG/NOTICE message
> could appears when we actually break memory rules because of some bad HJ
> situation.

So I did some more minor editions to the memory context patch and start working
on the balancing memory patch. Please, find in attachment the v4 patch set:

* 0001-v4-Describe-hybrid-hash-join-implementation.patch:
  Adds documentation written by Melanie few years ago
* 0002-v4-Allocate-hash-batches-related-BufFile-in-a-dedicated.patch:
  The batches' BufFile dedicated memory context patch
* 0003-v4-Add-some-debug-and-metrics.patch:
  A pure debug patch I use to track memory in my various tests
* 0004-v4-Limit-BufFile-memory-explosion-with-bad-HashJoin.patch
  A new and somewhat different version of the balancing memory patch, inspired
  from Tomas work.

After rebasing Tomas' memory balancing patch, I did some memory measures
to answer some of my questions. Please, find in attachment the resulting charts
"HJ-HEAD.png" and "balancing-v3.png" to compare memory consumption between HEAD
and Tomas' patch. They shows an alternance of numbers before/after calling
ExecHashIncreaseNumBatches (see the debug patch). I didn't try to find the
exact last total peak of memory consumption during the join phase and before
all the BufFiles are destroyed. So the last number might be underestimated.

Looking at Tomas' patch, I was quite surprised to find that data+bufFile
actually didn't fill memory up to spaceAllowed before splitting the batches and
rising the memory limit. This is because the patch assume the building phase
consume inner and outer BufFiles equally, where only the inner side is really
allocated. That's why the peakMB value is wrong compared to actual bufFileMB
measured.

So I worked on the v4 patch were BufFile are accounted in spaceUsed. Moreover,
instead of rising the limit and splitting the batches in the same step, the
patch first rise the memory limit if needed, then split in a later call if we
have enough room. The "balancing-v4.png" chart shows the resulting memory
activity. We might need to discuss the proper balancing between memory
consumption and batches.

Note that the patch now log a message when breaking the work_mem. Eg.:

  WARNING:  Hash Join node must grow outside of work_mem
  DETAIL:  Rising memory limit from 4194304 to 6291456
  HINT:  You might need to ANALYZE your table or tune its statistics collection.

Regards,
Attachment
- balancing-v3.png
- balancing-v3.data
- balancing-v4.png
- balancing-v4.data
- HJ-HEAD.png
- HJ-HEAD.data
- test.sql
- 0001-v4-Describe-hybrid-hash-join-implementation.patch
- 0002-v4-Allocate-hash-batches-related-BufFile-in-a-dedicated.patch
- 0003-v4-Add-some-debug-and-metrics.patch
- 0004-v4-Limit-BufFile-memory-explosion-with-bad-HashJoin.patch
On Sat, 8 Apr 2023 02:01:19 +0200
Jehan-Guillaume de Rorthais <jgdr@dalibo.com> wrote:

> On Fri, 31 Mar 2023 14:06:11 +0200
> Jehan-Guillaume de Rorthais <jgdr@dalibo.com> wrote:
>
>  [...]
>
> After rebasing Tomas' memory balancing patch, I did some memory measures
> to answer some of my questions. Please, find in attachment the resulting
> charts "HJ-HEAD.png" and "balancing-v3.png" to compare memory consumption
> between HEAD and Tomas' patch. They shows an alternance of numbers
> before/after calling ExecHashIncreaseNumBatches (see the debug patch). I
> didn't try to find the exact last total peak of memory consumption during the
> join phase and before all the BufFiles are destroyed. So the last number
> might be underestimated.

I did some more analysis about the total memory consumption in filecxt of HEAD,
v3 and v4 patches. My previous debug numbers only prints memory metrics during
batch increments or hash table destruction. That means:

* for HEAD: we miss the batches consumed during the outer scan
* for v3: adds twice nbatch in spaceUsed, which is a rough estimation
* for v4: batches are tracked in spaceUsed, so they are reflected in spacePeak

Using a breakpoint in ExecHashJoinSaveTuple to print "filecxt->mem_allocated"
from there, here are the maximum allocated memory for bufFile context for each
branch:

        batches   max bufFiles   total  spaceAllowed rise
  HEAD    16384      199966960  ~194MB
  v3       4096       65419456   ~78MB
  v4(*3)   2048       34273280    48MB  nbatch*sizeof(PGAlignedBlock)*3
  v4(*4)   1024       17170160  60.6MB  nbatch*sizeof(PGAlignedBlock)*4
  v4(*5)   2048       34273280  42.5MB  nbatch*sizeof(PGAlignedBlock)*5

It seems account for bufFile in spaceUsed allows a better memory balancing and
management. The precise factor to rise spaceAllowed is yet to be defined. *3 or
*4 looks good, but this is based on a single artificial test case.

Also, note that HEAD is currently reporting ~4MB of memory usage. This is by
far wrong with the reality. So even if we don't commit the balancing memory
patch in v16, maybe we could account for filecxt in spaceUsed as a bugfix?

Regards,
On 11.04.2023 8:14 PM, Jehan-Guillaume de Rorthais wrote:
> On Sat, 8 Apr 2023 02:01:19 +0200
> Jehan-Guillaume de Rorthais <jgdr@dalibo.com> wrote:
>
>> On Fri, 31 Mar 2023 14:06:11 +0200
>> Jehan-Guillaume de Rorthais <jgdr@dalibo.com> wrote:
>>
>>   [...]
>>
>> After rebasing Tomas' memory balancing patch, I did some memory measures
>> to answer some of my questions. Please, find in attachment the resulting
>> charts "HJ-HEAD.png" and "balancing-v3.png" to compare memory consumption
>> between HEAD and Tomas' patch. They shows an alternance of numbers
>> before/after calling ExecHashIncreaseNumBatches (see the debug patch). I
>> didn't try to find the exact last total peak of memory consumption during the
>> join phase and before all the BufFiles are destroyed. So the last number
>> might be underestimated.
> I did some more analysis about the total memory consumption in filecxt of HEAD,
> v3 and v4 patches. My previous debug numbers only prints memory metrics during
> batch increments or hash table destruction. That means:
>
> * for HEAD: we miss the batches consumed during the outer scan
> * for v3: adds twice nbatch in spaceUsed, which is a rough estimation
> * for v4: batches are tracked in spaceUsed, so they are reflected in spacePeak
>
> Using a breakpoint in ExecHashJoinSaveTuple to print "filecxt->mem_allocated"
> from there, here are the maximum allocated memory for bufFile context for each
> branch:
>
>          batches   max bufFiles   total  spaceAllowed rise
>    HEAD    16384      199966960  ~194MB
>    v3       4096       65419456   ~78MB
>    v4(*3)   2048       34273280    48MB  nbatch*sizeof(PGAlignedBlock)*3
>    v4(*4)   1024       17170160  60.6MB  nbatch*sizeof(PGAlignedBlock)*4
>    v4(*5)   2048       34273280  42.5MB  nbatch*sizeof(PGAlignedBlock)*5
>
> It seems account for bufFile in spaceUsed allows a better memory balancing and
> management. The precise factor to rise spaceAllowed is yet to be defined. *3 or
> *4 looks good, but this is based on a single artificial test case.
>
> Also, note that HEAD is currently reporting ~4MB of memory usage. This is by
> far wrong with the reality. So even if we don't commit the balancing memory
> patch in v16, maybe we could account for filecxt in spaceUsed as a bugfix?
>
> Regards,

Thank you for the patch.
I  faced with the same problem (OOM caused by hash join).
I tried to create simplest test reproducing the problem:

create table t(pk int, val int);
insert into t values (generate_series(1,100000000),0);
set work_mem='64kB';
explain (analyze,buffers) select count(*) from t t1 join t t2 on
(t1.pk=t2.pk);


There are three workers and size of each exceeds 1.3Gb.

Plan is the following:

  Finalize Aggregate  (cost=355905977972.87..355905977972.88 rows=1
width=8) (actual time=2
12961.033..226097.513 rows=1 loops=1)
    Buffers: shared hit=32644 read=852474 dirtied=437947 written=426374,
temp read=944407 w
ritten=1130380
    ->  Gather  (cost=355905977972.65..355905977972.86 rows=2 width=8)
(actual time=212943.
505..226097.497 rows=3 loops=1)
          Workers Planned: 2
          Workers Launched: 2
          Buffers: shared hit=32644 read=852474 dirtied=437947
written=426374, temp read=94
4407 written=1130380
          ->  Partial Aggregate (cost=355905976972.65..355905976972.66
rows=1 width=8) (ac
tual time=212938.410..212940.035 rows=1 loops=3)
                Buffers: shared hit=32644 read=852474 dirtied=437947
written=426374, temp r
ead=944407 written=1130380
                ->  Parallel Hash Join (cost=1542739.26..303822614472.65
rows=20833345000002 width=0) (actual time=163268.274..207829.524
rows=33333333 loops=3)
                      Hash Cond: (t1.pk = t2.pk)
                      Buffers: shared hit=32644 read=852474
dirtied=437947 written=426374, temp read=944407 written=1130380
                      ->  Parallel Seq Scan on t t1
(cost=0.00..859144.78 rows=41666678 width=4) (actual
time=0.045..30828.051 rows=33333333 loops=3)
                            Buffers: shared hit=16389 read=426089 written=87
                      ->  Parallel Hash (cost=859144.78..859144.78
rows=41666678 width=4) (actual time=82202.445..82202.447 rows=33333333
loops=3)
                            Buckets: 4096 (originally 4096)  Batches:
32768 (originally 8192)  Memory Usage: 192kB
                            Buffers: shared hit=16095 read=426383
dirtied=437947 written=426287, temp read=267898 written=737164
                            ->  Parallel Seq Scan on t t2
(cost=0.00..859144.78 rows=41666678 width=4) (actual
time=0.054..12647.534 rows=33333333 loops=3)
                                  Buffers: shared hit=16095 read=426383
dirtied=437947 writ
ten=426287
  Planning:
    Buffers: shared hit=69 read=38
  Planning Time: 2.819 ms
  Execution Time: 226113.292 ms
(22 rows)


-----------------------------

So we have increased number of batches to 32k.
I applied your patches 0001-0004 but unfortunately them have not reduced
memory consumption - still size of each backend is more than 1.3Gb.

I wonder what can be the prefered solution of the problem?
We have to limit size of hash table which we can hold in memory.
And number of batches is calculate as inner relation size divided by
hash table size.
So for arbitrary large inner relation we can get arbitrary large numer
of batches which may consume arbitrary larger amount of memory.
We should either prohibit further increase of number of batches - it
will not solve the problem completely but at least in the test above prevent
increase of number of batches from 8k to 32k, either prohibit use of
hash join in this case at all (assign very high cost to this path).

Also I winder why do we crete so larger number of files for each batch?
Can it be reduced?
On Thu, Apr 20, 2023 at 12:42 PM Konstantin Knizhnik <knizhnik@garret.ru> wrote:
> On 11.04.2023 8:14 PM, Jehan-Guillaume de Rorthais wrote:
> > On Sat, 8 Apr 2023 02:01:19 +0200
> > Jehan-Guillaume de Rorthais <jgdr@dalibo.com> wrote:
> >
> >> On Fri, 31 Mar 2023 14:06:11 +0200
> >> Jehan-Guillaume de Rorthais <jgdr@dalibo.com> wrote:
> >>
> >>   [...]
> >>
> >> After rebasing Tomas' memory balancing patch, I did some memory measures
> >> to answer some of my questions. Please, find in attachment the resulting
> >> charts "HJ-HEAD.png" and "balancing-v3.png" to compare memory consumption
> >> between HEAD and Tomas' patch. They shows an alternance of numbers
> >> before/after calling ExecHashIncreaseNumBatches (see the debug patch). I
> >> didn't try to find the exact last total peak of memory consumption during the
> >> join phase and before all the BufFiles are destroyed. So the last number
> >> might be underestimated.
> > I did some more analysis about the total memory consumption in filecxt of HEAD,
> > v3 and v4 patches. My previous debug numbers only prints memory metrics during
> > batch increments or hash table destruction. That means:
> >
> > * for HEAD: we miss the batches consumed during the outer scan
> > * for v3: adds twice nbatch in spaceUsed, which is a rough estimation
> > * for v4: batches are tracked in spaceUsed, so they are reflected in spacePeak
> >
> > Using a breakpoint in ExecHashJoinSaveTuple to print "filecxt->mem_allocated"
> > from there, here are the maximum allocated memory for bufFile context for each
> > branch:
> >
> >          batches   max bufFiles   total  spaceAllowed rise
> >    HEAD    16384      199966960  ~194MB
> >    v3       4096       65419456   ~78MB
> >    v4(*3)   2048       34273280    48MB  nbatch*sizeof(PGAlignedBlock)*3
> >    v4(*4)   1024       17170160  60.6MB  nbatch*sizeof(PGAlignedBlock)*4
> >    v4(*5)   2048       34273280  42.5MB  nbatch*sizeof(PGAlignedBlock)*5
> >
> > It seems account for bufFile in spaceUsed allows a better memory balancing and
> > management. The precise factor to rise spaceAllowed is yet to be defined. *3 or
> > *4 looks good, but this is based on a single artificial test case.
> >
> > Also, note that HEAD is currently reporting ~4MB of memory usage. This is by
> > far wrong with the reality. So even if we don't commit the balancing memory
> > patch in v16, maybe we could account for filecxt in spaceUsed as a bugfix?
> >
> > Regards,
>
> Thank you for the patch.
> I  faced with the same problem (OOM caused by hash join).
> I tried to create simplest test reproducing the problem:
>
> create table t(pk int, val int);
> insert into t values (generate_series(1,100000000),0);
> set work_mem='64kB';
> explain (analyze,buffers) select count(*) from t t1 join t t2 on
> (t1.pk=t2.pk);
>
>
> There are three workers and size of each exceeds 1.3Gb.
>
> Plan is the following:
>
>   Finalize Aggregate  (cost=355905977972.87..355905977972.88 rows=1
> width=8) (actual time=2
> 12961.033..226097.513 rows=1 loops=1)
>     Buffers: shared hit=32644 read=852474 dirtied=437947 written=426374,
> temp read=944407 w
> ritten=1130380
>     ->  Gather  (cost=355905977972.65..355905977972.86 rows=2 width=8)
> (actual time=212943.
> 505..226097.497 rows=3 loops=1)
>           Workers Planned: 2
>           Workers Launched: 2
>           Buffers: shared hit=32644 read=852474 dirtied=437947
> written=426374, temp read=94
> 4407 written=1130380
>           ->  Partial Aggregate (cost=355905976972.65..355905976972.66
> rows=1 width=8) (ac
> tual time=212938.410..212940.035 rows=1 loops=3)
>                 Buffers: shared hit=32644 read=852474 dirtied=437947
> written=426374, temp r
> ead=944407 written=1130380
>                 ->  Parallel Hash Join (cost=1542739.26..303822614472.65
> rows=20833345000002 width=0) (actual time=163268.274..207829.524
> rows=33333333 loops=3)
>                       Hash Cond: (t1.pk = t2.pk)
>                       Buffers: shared hit=32644 read=852474
> dirtied=437947 written=426374, temp read=944407 written=1130380
>                       ->  Parallel Seq Scan on t t1
> (cost=0.00..859144.78 rows=41666678 width=4) (actual
> time=0.045..30828.051 rows=33333333 loops=3)
>                             Buffers: shared hit=16389 read=426089 written=87
>                       ->  Parallel Hash (cost=859144.78..859144.78
> rows=41666678 width=4) (actual time=82202.445..82202.447 rows=33333333
> loops=3)
>                             Buckets: 4096 (originally 4096)  Batches:
> 32768 (originally 8192)  Memory Usage: 192kB
>                             Buffers: shared hit=16095 read=426383
> dirtied=437947 written=426287, temp read=267898 written=737164
>                             ->  Parallel Seq Scan on t t2
> (cost=0.00..859144.78 rows=41666678 width=4) (actual
> time=0.054..12647.534 rows=33333333 loops=3)
>                                   Buffers: shared hit=16095 read=426383
> dirtied=437947 writ
> ten=426287
>   Planning:
>     Buffers: shared hit=69 read=38
>   Planning Time: 2.819 ms
>   Execution Time: 226113.292 ms
> (22 rows)
>
>
>
> -----------------------------
>
> So we have increased number of batches to 32k.
> I applied your patches 0001-0004 but unfortunately them have not reduced
> memory consumption - still size of each backend is more than 1.3Gb.

Is this EXPLAIN ANALYZE run on an instance with Jehan-Guillaume's
patchset applied or without?

I'm asking because the fourth patch in the series updates spaceUsed with
the size of the BufFile->buffer, but I notice in your EXPLAIN ANALZYE,
Memory Usage for the hashtable is reported as 192 kB, which, while
larger than the 64kB work_mem you set, isn't as large as I might expect.

- Melanie
On 21.04.2023 1:51 AM, Melanie Plageman wrote:
> On Thu, Apr 20, 2023 at 12:42 PM Konstantin Knizhnik <knizhnik@garret.ru> wrote:
>> On 11.04.2023 8:14 PM, Jehan-Guillaume de Rorthais wrote:
>>> On Sat, 8 Apr 2023 02:01:19 +0200
>>> Jehan-Guillaume de Rorthais <jgdr@dalibo.com> wrote:
>>>
>>>> On Fri, 31 Mar 2023 14:06:11 +0200
>>>> Jehan-Guillaume de Rorthais <jgdr@dalibo.com> wrote:
>>>>
>>>>    [...]
>>>>
>>>> After rebasing Tomas' memory balancing patch, I did some memory measures
>>>> to answer some of my questions. Please, find in attachment the resulting
>>>> charts "HJ-HEAD.png" and "balancing-v3.png" to compare memory consumption
>>>> between HEAD and Tomas' patch. They shows an alternance of numbers
>>>> before/after calling ExecHashIncreaseNumBatches (see the debug patch). I
>>>> didn't try to find the exact last total peak of memory consumption during the
>>>> join phase and before all the BufFiles are destroyed. So the last number
>>>> might be underestimated.
>>> I did some more analysis about the total memory consumption in filecxt of HEAD,
>>> v3 and v4 patches. My previous debug numbers only prints memory metrics during
>>> batch increments or hash table destruction. That means:
>>>
>>> * for HEAD: we miss the batches consumed during the outer scan
>>> * for v3: adds twice nbatch in spaceUsed, which is a rough estimation
>>> * for v4: batches are tracked in spaceUsed, so they are reflected in spacePeak
>>>
>>> Using a breakpoint in ExecHashJoinSaveTuple to print "filecxt->mem_allocated"
>>> from there, here are the maximum allocated memory for bufFile context for each
>>> branch:
>>>
>>>           batches   max bufFiles   total  spaceAllowed rise
>>>     HEAD    16384      199966960  ~194MB
>>>     v3       4096       65419456   ~78MB
>>>     v4(*3)   2048       34273280    48MB  nbatch*sizeof(PGAlignedBlock)*3
>>>     v4(*4)   1024       17170160  60.6MB  nbatch*sizeof(PGAlignedBlock)*4
>>>     v4(*5)   2048       34273280  42.5MB  nbatch*sizeof(PGAlignedBlock)*5
>>>
>>> It seems account for bufFile in spaceUsed allows a better memory balancing and
>>> management. The precise factor to rise spaceAllowed is yet to be defined. *3 or
>>> *4 looks good, but this is based on a single artificial test case.
>>>
>>> Also, note that HEAD is currently reporting ~4MB of memory usage. This is by
>>> far wrong with the reality. So even if we don't commit the balancing memory
>>> patch in v16, maybe we could account for filecxt in spaceUsed as a bugfix?
>>>
>>> Regards,
>> Thank you for the patch.
>> I  faced with the same problem (OOM caused by hash join).
>> I tried to create simplest test reproducing the problem:
>>
>> create table t(pk int, val int);
>> insert into t values (generate_series(1,100000000),0);
>> set work_mem='64kB';
>> explain (analyze,buffers) select count(*) from t t1 join t t2 on
>> (t1.pk=t2.pk);
>>
>>
>> There are three workers and size of each exceeds 1.3Gb.
>>
>> Plan is the following:
>>
>>    Finalize Aggregate  (cost=355905977972.87..355905977972.88 rows=1
>> width=8) (actual time=2
>> 12961.033..226097.513 rows=1 loops=1)
>>      Buffers: shared hit=32644 read=852474 dirtied=437947 written=426374,
>> temp read=944407 w
>> ritten=1130380
>>      ->  Gather  (cost=355905977972.65..355905977972.86 rows=2 width=8)
>> (actual time=212943.
>> 505..226097.497 rows=3 loops=1)
>>            Workers Planned: 2
>>            Workers Launched: 2
>>            Buffers: shared hit=32644 read=852474 dirtied=437947
>> written=426374, temp read=94
>> 4407 written=1130380
>>            ->  Partial Aggregate (cost=355905976972.65..355905976972.66
>> rows=1 width=8) (ac
>> tual time=212938.410..212940.035 rows=1 loops=3)
>>                  Buffers: shared hit=32644 read=852474 dirtied=437947
>> written=426374, temp r
>> ead=944407 written=1130380
>>                  ->  Parallel Hash Join (cost=1542739.26..303822614472.65
>> rows=20833345000002 width=0) (actual time=163268.274..207829.524
>> rows=33333333 loops=3)
>>                        Hash Cond: (t1.pk = t2.pk)
>>                        Buffers: shared hit=32644 read=852474
>> dirtied=437947 written=426374, temp read=944407 written=1130380
>>                        ->  Parallel Seq Scan on t t1
>> (cost=0.00..859144.78 rows=41666678 width=4) (actual
>> time=0.045..30828.051 rows=33333333 loops=3)
>>                              Buffers: shared hit=16389 read=426089 written=87
>>                        ->  Parallel Hash (cost=859144.78..859144.78
>> rows=41666678 width=4) (actual time=82202.445..82202.447 rows=33333333
>> loops=3)
>>                              Buckets: 4096 (originally 4096)  Batches:
>> 32768 (originally 8192)  Memory Usage: 192kB
>>                              Buffers: shared hit=16095 read=426383
>> dirtied=437947 written=426287, temp read=267898 written=737164
>>                              ->  Parallel Seq Scan on t t2
>> (cost=0.00..859144.78 rows=41666678 width=4) (actual
>> time=0.054..12647.534 rows=33333333 loops=3)
>>                                    Buffers: shared hit=16095 read=426383
>> dirtied=437947 writ
>> ten=426287
>>    Planning:
>>      Buffers: shared hit=69 read=38
>>    Planning Time: 2.819 ms
>>    Execution Time: 226113.292 ms
>> (22 rows)
>>
>>
>>
>> -----------------------------
>>
>> So we have increased number of batches to 32k.
>> I applied your patches 0001-0004 but unfortunately them have not reduced
>> memory consumption - still size of each backend is more than 1.3Gb.
> Is this EXPLAIN ANALYZE run on an instance with Jehan-Guillaume's
> patchset applied or without?
>
> I'm asking because the fourth patch in the series updates spaceUsed with
> the size of the BufFile->buffer, but I notice in your EXPLAIN ANALZYE,
> Memory Usage for the hashtable is reported as 192 kB, which, while
> larger than the 64kB work_mem you set, isn't as large as I might expect.
>
> - Melanie
Yes, this is explain analyze for the Postgres version with applied 4
patches:

0001-v4-Describe-hybrid-hash-join-implementation.patch
0002-v4-Allocate-hash-batches-related-BufFile-in-a-dedicated.patch
0003-v4-Add-some-debug-and-metrics.patch
0004-v4-Limit-BufFile-memory-explosion-with-bad-HashJoin.patch

Just as workaround I tried the attached patch - it prevents backups
memory footprint growth
by limiting number of created batches. I am not sure that it is right
solution, because in any case we allocate more memory than specified by
work_mem. The alternative is to prohibit hash join plan in this case.
But it is also not so good solution, because merge join is used to be
much slower.
Attachment
On Fri, Apr 7, 2023 at 8:01 PM Jehan-Guillaume de Rorthais
<jgdr@dalibo.com> wrote:
>
> On Fri, 31 Mar 2023 14:06:11 +0200
> Jehan-Guillaume de Rorthais <jgdr@dalibo.com> wrote:
>
> > > [...]
> > > >> Hmmm, not sure is WARNING is a good approach, but I don't have a better
> > > >> idea at the moment.
> > > >
> > > > I stepped it down to NOTICE and added some more infos.
> > > >
> > > > [...]
> > > >   NOTICE:  Growing number of hash batch to 32768 is exhausting allowed
> > > > memory (137494656 > 2097152)
> > > [...]
> > >
> > > OK, although NOTICE that may actually make it less useful - the default
> > > level is WARNING, and regular users are unable to change the level. So
> > > very few people will actually see these messages.
> [...]
> > Anyway, maybe this should be added in the light of next patch, balancing
> > between increasing batches and allowed memory. The WARNING/LOG/NOTICE message
> > could appears when we actually break memory rules because of some bad HJ
> > situation.
>
> So I did some more minor editions to the memory context patch and start working
> on the balancing memory patch. Please, find in attachment the v4 patch set:
>
> * 0001-v4-Describe-hybrid-hash-join-implementation.patch:
>   Adds documentation written by Melanie few years ago
> * 0002-v4-Allocate-hash-batches-related-BufFile-in-a-dedicated.patch:
>   The batches' BufFile dedicated memory context patch

This is only a review of the code in patch 0002 (the patch to use a more
granular memory context for multi-batch hash join batch files). I have
not reviewed the changes to comments in detail either.

I think the biggest change that is needed is to implement this memory
context usage for parallel hash join.

To implement a file buffer memory context for multi-patch parallel hash
join we would need, at a minimum, to switch into the proposed fileCxt
memory context in sts_puttuple() before BufFileCreateFileSet().

We should also consider changing the SharedTuplestoreAccessor->context
from HashTableContext to the proposed fileCxt.

In parallel hash join code, the SharedTuplestoreAccessor->context is
only used when allocating the SharedTuplestoreAccessor->write_chunk and
read_chunk. Those are the buffers for writing out and reading from the
SharedTuplestore and are part of the memory overhead of file buffers for
a multi-batch hash join. Note that we will allocate STS_CHUNK_PAGES *
BLCKSZ size buffer for every batch -- this is on top of the BufFile
buffer per batch.

sts_initialize() and sts_attach() set the
SharedTuplestoreAccessor->context to the CurrentMemoryContext. We could
change into the fileCxt before calling those functions from the hash
join code. That would mean that the SharedTuplestoreAccessor data
structure would also be counted in the fileCxt (and probably
hashtable->batches). This is probably what we want anyway.

As for this patch's current implementation and use of the fileCxt , I
think you are going to need to switch into the fileCxt before calling
BufFileClose() with the batch files throughout the hash join code (e.g.
in ExecHashJoinNewBatch()) if you want the mem_allocated to be accurate
(since it frees the BufFile buffer). Once you figure out if that makes
sense and implement it, I think we will have to revisit if it still
makes sense to pass the fileCxt as an argument to
ExecHashJoinSaveTuple().

- Melanie
Hi,

On Fri, 21 Apr 2023 16:44:48 -0400
Melanie Plageman <melanieplageman@gmail.com> wrote:

> On Fri, Apr 7, 2023 at 8:01 PM Jehan-Guillaume de Rorthais
> <jgdr@dalibo.com> wrote:
> >
> > On Fri, 31 Mar 2023 14:06:11 +0200
> > Jehan-Guillaume de Rorthais <jgdr@dalibo.com> wrote:
> >
> > > > [...]
> > > > >> Hmmm, not sure is WARNING is a good approach, but I don't have a
> > > > >> better idea at the moment.
> > > > >
> > > > > I stepped it down to NOTICE and added some more infos.
> > > > >
> > > > > [...]
> > > > >   NOTICE:  Growing number of hash batch to 32768 is exhausting allowed
> > > > > memory (137494656 > 2097152)
> > > > [...]
> > > >
> > > > OK, although NOTICE that may actually make it less useful - the default
> > > > level is WARNING, and regular users are unable to change the level. So
> > > > very few people will actually see these messages.
> > [...]
> > > Anyway, maybe this should be added in the light of next patch, balancing
> > > between increasing batches and allowed memory. The WARNING/LOG/NOTICE
> > > message could appears when we actually break memory rules because of some
> > > bad HJ situation.
> >
> > So I did some more minor editions to the memory context patch and start
> > working on the balancing memory patch. Please, find in attachment the v4
> > patch set:
> >
> > * 0001-v4-Describe-hybrid-hash-join-implementation.patch:
> >   Adds documentation written by Melanie few years ago
> > * 0002-v4-Allocate-hash-batches-related-BufFile-in-a-dedicated.patch:
> >   The batches' BufFile dedicated memory context patch
>
> This is only a review of the code in patch 0002 (the patch to use a more
> granular memory context for multi-batch hash join batch files). I have
> not reviewed the changes to comments in detail either.

Ok.

> I think the biggest change that is needed is to implement this memory
> context usage for parallel hash join.

Indeed.

> To implement a file buffer memory context for multi-patch parallel hash
> join [...]

Thank you for your review and pointers!

After (some days off and then) studying the parallel code, I end up with this:

1. As explained by Melanie, the v5 patch sets accessor->context to fileCxt.

2. BufFile buffers were wrongly allocated in ExecutorState context for
   accessor->read|write_file, from sts_puttuple and sts_parallel_scan_next when
   they first need to work with the accessor FileSet.

   The v5 patch now allocate them in accessor->context, directly in
   sts_puttuple and sts_parallel_scan_next. This avoids to wrap each single
   call of these functions inside MemoryContextSwitchTo calls. I suppose this
   is correct as the comment about accessor->context says
   "/* Memory context for **buffers**. */" in struct SharedTuplestoreAccessor.

3. accessor->write_chunk is currently already allocated in accessor->context.

   In consequence, this buffer is now allocated in the fileCxt instead
   of hashCxt context.

   This is a bit far fetched, but I suppose this is ok as it act as a second
   level buffer, on top of the BufFile.

4. accessor->read_buffer is currently allocated in accessor->context as well.

   This buffer holds tuple read from the fileset. This is still a buffer, but
   not related to any file anymore...

Because of 3 and 4, and the gross context granularity of SharedTuplestore
related-code, I'm now wondering if "fileCxt" shouldn't be renamed "bufCxt".

Regards,
Attachment
Thanks for continuing to work on this!

On Thu, May 04, 2023 at 07:30:06PM +0200, Jehan-Guillaume de Rorthais wrote:
> On Fri, 21 Apr 2023 16:44:48 -0400 Melanie Plageman <melanieplageman@gmail.com> wrote:
...
> > I think the biggest change that is needed is to implement this memory
> > context usage for parallel hash join.
>
> Indeed.

...

> 4. accessor->read_buffer is currently allocated in accessor->context as well.
>
>    This buffer holds tuple read from the fileset. This is still a buffer, but
>    not related to any file anymore...
>
> Because of 3 and 4, and the gross context granularity of SharedTuplestore
> related-code, I'm now wondering if "fileCxt" shouldn't be renamed "bufCxt".

I think bufCxt is a potentially confusing name. The context contains
pointers to the batch files and saying those are related to buffers is
confusing. It also sounds like it could include any kind of buffer
related to the hashtable or hash join.

Perhaps we could call this memory context the "spillCxt"--indicating it
is for the memory required for spilling to permanent storage while
executing hash joins.

I discuss this more in my code review below.

> From c5ed2ae2c2749af4f5058b012dc5e8a9e1529127 Mon Sep 17 00:00:00 2001
> From: Jehan-Guillaume de Rorthais <jgdr@dalibo.com>
> Date: Mon, 27 Mar 2023 15:54:39 +0200
> Subject: [PATCH 2/3] Allocate hash batches related BufFile in a dedicated
>  context

> diff --git a/src/backend/executor/nodeHash.c b/src/backend/executor/nodeHash.c
> index 5fd1c5553b..a4fbf29301 100644
> --- a/src/backend/executor/nodeHash.c
> +++ b/src/backend/executor/nodeHash.c
> @@ -570,15 +574,21 @@ ExecHashTableCreate(HashState *state, List *hashOperators, List *hashCollations,
>
>      if (nbatch > 1 && hashtable->parallel_state == NULL)
>      {
> +        MemoryContext oldctx;
> +
>          /*
>           * allocate and initialize the file arrays in hashCxt (not needed for
>           * parallel case which uses shared tuplestores instead of raw files)
>           */
> +        oldctx = MemoryContextSwitchTo(hashtable->fileCxt);
> +
>          hashtable->innerBatchFile = palloc0_array(BufFile *, nbatch);
>          hashtable->outerBatchFile = palloc0_array(BufFile *, nbatch);
>          /* The files will not be opened until needed... */
>          /* ... but make sure we have temp tablespaces established for them */

I haven't studied it closely, but I wonder if we shouldn't switch back
into the oldctx before calling PrepareTempTablespaces().
PrepareTempTablespaces() is explicit about what memory context it is
allocating in, however, I'm not sure it makes sense to call it in the
fileCxt. If you have a reason, you should add a comment and do the same
in ExecHashIncreaseNumBatches().

>          PrepareTempTablespaces();
> +
> +        MemoryContextSwitchTo(oldctx);
>      }

> @@ -934,13 +943,16 @@ ExecHashIncreaseNumBatches(HashJoinTable hashtable)
>             hashtable, nbatch, hashtable->spaceUsed);
>  #endif
>
> -    oldcxt = MemoryContextSwitchTo(hashtable->hashCxt);
> -
>      if (hashtable->innerBatchFile == NULL)
>      {
> +        MemoryContext oldcxt = MemoryContextSwitchTo(hashtable->fileCxt);
> +
>          /* we had no file arrays before */
>          hashtable->innerBatchFile = palloc0_array(BufFile *, nbatch);
>          hashtable->outerBatchFile = palloc0_array(BufFile *, nbatch);
> +

As mentioned above, you should likely make ExecHashTableCreate()
consistent with this.

> +        MemoryContextSwitchTo(oldcxt);
> +
>          /* time to establish the temp tablespaces, too */
>          PrepareTempTablespaces();
>      }
> @@ -951,8 +963,6 @@ ExecHashIncreaseNumBatches(HashJoinTable hashtable)

I don't see a reason to call repalloc0_array() in a different context
than the initial palloc0_array().

>          hashtable->outerBatchFile = repalloc0_array(hashtable->outerBatchFile, BufFile *, oldnbatch, nbatch);
>      }
>
> -    MemoryContextSwitchTo(oldcxt);
> -
>      hashtable->nbatch = nbatch;
>
>      /*

> diff --git a/src/backend/executor/nodeHashjoin.c b/src/backend/executor/nodeHashjoin.c
> index 920d1831c2..ac72fbfbb6 100644
> --- a/src/backend/executor/nodeHashjoin.c
> +++ b/src/backend/executor/nodeHashjoin.c
> @@ -485,8 +485,10 @@ ExecHashJoinImpl(PlanState *pstate, bool parallel)
>                       */
>                      Assert(parallel_state == NULL);
>                      Assert(batchno > hashtable->curbatch);
> +
>                      ExecHashJoinSaveTuple(mintuple, hashvalue,
> -                                          &hashtable->outerBatchFile[batchno]);
> +                                          &hashtable->outerBatchFile[batchno],
> +                                          hashtable->fileCxt);
>
>                      if (shouldFree)
>                          heap_free_minimal_tuple(mintuple);
> @@ -1308,21 +1310,27 @@ ExecParallelHashJoinNewBatch(HashJoinState *hjstate)
>   * The data recorded in the file for each tuple is its hash value,

It doesn't sound accurate to me to say that it should be called *in* the
HashBatchFiles context. We now switch into that context, so you can
probably remove this comment and add a comment above the switch into the
filecxt which explains that the temp file buffers should be allocated in
the filecxt (both because they need to be allocated in a sufficiently
long-lived context and to increase visibility of their memory overhead).

>   * then the tuple in MinimalTuple format.
>   *
> - * Note: it is important always to call this in the regular executor
> - * context, not in a shorter-lived context; else the temp file buffers
> - * will get messed up.
> + * Note: it is important always to call this in the HashBatchFiles context,
> + * not in a shorter-lived context; else the temp file buffers will get messed
> + * up.
>   */
>  void
>  ExecHashJoinSaveTuple(MinimalTuple tuple, uint32 hashvalue,
> -                      BufFile **fileptr)
> +                      BufFile **fileptr, MemoryContext filecxt)
>  {
>      BufFile    *file = *fileptr;
>
>      if (file == NULL)
>      {
> +        MemoryContext oldctx;
> +
> +        oldctx = MemoryContextSwitchTo(filecxt);
> +
>          /* First write to this batch file, so open it. */
>          file = BufFileCreateTemp(false);
>          *fileptr = file;
> +
> +        MemoryContextSwitchTo(oldctx);
>      }

> diff --git a/src/include/executor/hashjoin.h b/src/include/executor/hashjoin.h
> index 8ee59d2c71..74867c3e40 100644
> --- a/src/include/executor/hashjoin.h
> +++ b/src/include/executor/hashjoin.h
> @@ -25,10 +25,14 @@
>   *
>   * Each active hashjoin has a HashJoinTable control block, which is
>   * palloc'd in the executor's per-query context.  All other storage needed
> - * for the hashjoin is kept in private memory contexts, two for each hashjoin.
> + * for the hashjoin is kept in private memory contexts, three for each
> + * hashjoin:

Maybe "hash table control block". I know the phrase "control block" is
used elsewhere in the comments, but it is a bit confusing. Also, I wish
there was a way to make it clear this is for the hashtable but relevant
to all batches.

> + * - HashTableContext (hashCxt): the control block associated to the hash table

I might say "per-batch storage for serial hash join".

> + * - HashBatchContext (batchCxt): storages for batches

So, if we are going to allocate the array of pointers to the spill files
in the fileCxt, we should revise this comment. As I mentioned above, I
agree with you that if the SharedTupleStore-related buffers are also
allocated in this context, perhaps it shouldn't be called the fileCxt.

One idea I had is calling it the spillCxt. Almost all memory allocated in this
context is related to needing to spill to permanent storage during execution.

The one potential confusing part of this is batch 0 for parallel hash
join. I would have to dig back into it again, but from a cursory look at
ExecParallelHashJoinSetUpBatches() it seems like batch 0 also gets a
shared tuplestore with associated accessors and files even if it is a
single batch parallel hashjoin.

Are the parallel hash join read_buffer and write_chunk also used for a
single batch parallel hash join?

Though, perhaps spillCxt still makes sense? It doesn't specify
multi-batch...

> --- a/src/include/executor/nodeHashjoin.h
> +++ b/src/include/executor/nodeHashjoin.h
> @@ -29,6 +29,6 @@ extern void ExecHashJoinInitializeWorker(HashJoinState *state,
>                                           ParallelWorkerContext *pwcxt);
>

I would add a comment explaining why ExecHashJoinSaveTuple() is passed
with the fileCxt as a parameter.

>  extern void ExecHashJoinSaveTuple(MinimalTuple tuple, uint32 hashvalue,
> -                                  BufFile **fileptr);
> +                                  BufFile **fileptr, MemoryContext filecxt);

- Melanie
Thank you for your review!

On Mon, 8 May 2023 11:56:48 -0400
Melanie Plageman <melanieplageman@gmail.com> wrote:

> ...
> > 4. accessor->read_buffer is currently allocated in accessor->context as
> > well.
> >
> >    This buffer holds tuple read from the fileset. This is still a buffer,
> > but not related to any file anymore...
> >
> > Because of 3 and 4, and the gross context granularity of SharedTuplestore
> > related-code, I'm now wondering if "fileCxt" shouldn't be renamed "bufCxt".
>
> I think bufCxt is a potentially confusing name. The context contains
> pointers to the batch files and saying those are related to buffers is
> confusing. It also sounds like it could include any kind of buffer
> related to the hashtable or hash join.
>
> Perhaps we could call this memory context the "spillCxt"--indicating it
> is for the memory required for spilling to permanent storage while
> executing hash joins.

"Spilling" seems fair and a large enough net to grab everything around temp
files and accessing them.

> I discuss this more in my code review below.
>
> > From c5ed2ae2c2749af4f5058b012dc5e8a9e1529127 Mon Sep 17 00:00:00 2001
> > From: Jehan-Guillaume de Rorthais <jgdr@dalibo.com>
> > Date: Mon, 27 Mar 2023 15:54:39 +0200
> > Subject: [PATCH 2/3] Allocate hash batches related BufFile in a dedicated
> >  context
>
> > diff --git a/src/backend/executor/nodeHash.c
> > b/src/backend/executor/nodeHash.c index 5fd1c5553b..a4fbf29301 100644
> > --- a/src/backend/executor/nodeHash.c
> > +++ b/src/backend/executor/nodeHash.c
> > @@ -570,15 +574,21 @@ ExecHashTableCreate(HashState *state, List
> > *hashOperators, List *hashCollations,
> >      if (nbatch > 1 && hashtable->parallel_state == NULL)
> >      {
> > +        MemoryContext oldctx;
> > +
> >          /*
> >           * allocate and initialize the file arrays in hashCxt (not
> > needed for
> >           * parallel case which uses shared tuplestores instead of
> > raw files) */
> > +        oldctx = MemoryContextSwitchTo(hashtable->fileCxt);
> > +
> >          hashtable->innerBatchFile = palloc0_array(BufFile *,
> > nbatch); hashtable->outerBatchFile = palloc0_array(BufFile *, nbatch);
> >          /* The files will not be opened until needed... */
> >          /* ... but make sure we have temp tablespaces established
> > for them */
>
> I haven't studied it closely, but I wonder if we shouldn't switch back
> into the oldctx before calling PrepareTempTablespaces().
> PrepareTempTablespaces() is explicit about what memory context it is
> allocating in, however, I'm not sure it makes sense to call it in the
> fileCxt. If you have a reason, you should add a comment and do the same
> in ExecHashIncreaseNumBatches().

I had no reason. I catched it in ExecHashIncreaseNumBatches() while reviewing
myself, but not here.

Line moved in v6.

> > @@ -934,13 +943,16 @@ ExecHashIncreaseNumBatches(HashJoinTable hashtable)
> >             hashtable, nbatch, hashtable->spaceUsed);
> >  #endif
> >
> > -    oldcxt = MemoryContextSwitchTo(hashtable->hashCxt);
> > -
> >      if (hashtable->innerBatchFile == NULL)
> >      {
> > +        MemoryContext oldcxt =
> > MemoryContextSwitchTo(hashtable->fileCxt); +
> >          /* we had no file arrays before */
> >          hashtable->innerBatchFile = palloc0_array(BufFile *,
> > nbatch); hashtable->outerBatchFile = palloc0_array(BufFile *, nbatch);
> > +
> > +        MemoryContextSwitchTo(oldcxt);
> > +
> >          /* time to establish the temp tablespaces, too */
> >          PrepareTempTablespaces();
> >      }
> > @@ -951,8 +963,6 @@ ExecHashIncreaseNumBatches(HashJoinTable hashtable)
>
> I don't see a reason to call repalloc0_array() in a different context
> than the initial palloc0_array().

Unless I'm wrong, wrapping the whole if/else blocks in memory context
hashtable->fileCxt seemed useless as repalloc() actually realloc in the context
the original allocation occurred. So I only wrapped the palloc() calls.

> > diff --git a/src/backend/executor/nodeHashjoin.c
> > ...
> > @@ -1308,21 +1310,27 @@ ExecParallelHashJoinNewBatch(HashJoinState
> > *hjstate)
> >   * The data recorded in the file for each tuple is its hash value,
>
> It doesn't sound accurate to me to say that it should be called *in* the
> HashBatchFiles context. We now switch into that context, so you can
> probably remove this comment and add a comment above the switch into the
> filecxt which explains that the temp file buffers should be allocated in
> the filecxt (both because they need to be allocated in a sufficiently
> long-lived context and to increase visibility of their memory overhead).

Indeed. Comment moved and reworded in v6.

> > diff --git a/src/include/executor/hashjoin.h
> > b/src/include/executor/hashjoin.h index 8ee59d2c71..74867c3e40 100644
> > --- a/src/include/executor/hashjoin.h
> > +++ b/src/include/executor/hashjoin.h
> > @@ -25,10 +25,14 @@
> >   *
> >   * Each active hashjoin has a HashJoinTable control block, which is
> >   * palloc'd in the executor's per-query context.  All other storage needed
> > - * for the hashjoin is kept in private memory contexts, two for each
> > hashjoin.
> > + * for the hashjoin is kept in private memory contexts, three for each
> > + * hashjoin:
>
> Maybe "hash table control block". I know the phrase "control block" is
> used elsewhere in the comments, but it is a bit confusing. Also, I wish
> there was a way to make it clear this is for the hashtable but relevant
> to all batches.

I tried to reword the comment with this additional info in mind in v6. Does it
match what you had in mind?

> ...
> So, if we are going to allocate the array of pointers to the spill files
> in the fileCxt, we should revise this comment. As I mentioned above, I
> agree with you that if the SharedTupleStore-related buffers are also
> allocated in this context, perhaps it shouldn't be called the fileCxt.
>
> One idea I had is calling it the spillCxt. Almost all memory allocated in this
> context is related to needing to spill to permanent storage during execution.

Agree

> The one potential confusing part of this is batch 0 for parallel hash
> join. I would have to dig back into it again, but from a cursory look at
> ExecParallelHashJoinSetUpBatches() it seems like batch 0 also gets a
> shared tuplestore with associated accessors and files even if it is a
> single batch parallel hashjoin.
>
> Are the parallel hash join read_buffer and write_chunk also used for a
> single batch parallel hash join?

I don't think so.

For the inner side, there's various Assert() around the batchno==0 special
case. Plus, it always has his own block when inserting in a batch, to directly
write in shared memory calling ExecParallelHashPushTuple().

The outer side of the join actually creates all batches using shared tuple
storage mechanism, including batch 0, **only** if the number of batch is
greater than 1. See in ExecParallelHashJoinOuterGetTuple:

  /*
   * In the Parallel Hash case we only run the outer plan directly for
   * single-batch hash joins. Otherwise we have to go to batch files, even
   * for batch 0.
   */
  if (curbatch == 0 && hashtable->nbatch == 1)
  {
      slot = ExecProcNode(outerNode);

So, for a single batch PHJ, it seems there's no temp files involved.

> Though, perhaps spillCxt still makes sense? It doesn't specify
> multi-batch...

I'm not sure the see where would be the confusing part here? Is it that some
STS mechanism are allocated but never used? When the number of batch is 1, it
doesn't really matter much I suppose, as the context consumption stays
really low. Plus, there's some other useless STS/context around there (ie. inner
batch 0 and batch context in PHJ). I'm not sure it worth trying optimizing this
compare to the cost of the added code complexity.

Or am I off-topic and missing something obvious?

> > --- a/src/include/executor/nodeHashjoin.h
> > +++ b/src/include/executor/nodeHashjoin.h
> > @@ -29,6 +29,6 @@ extern void ExecHashJoinInitializeWorker(HashJoinState
> > *state, ParallelWorkerContext *pwcxt);
> >
>
> I would add a comment explaining why ExecHashJoinSaveTuple() is passed
> with the fileCxt as a parameter.
>
> >  extern void ExecHashJoinSaveTuple(MinimalTuple tuple, uint32 hashvalue,

Isn't the comment added in the function itself, in v6, enough? It seems
uncommon to comment on function parameters in headers.

Last, about your TODO in 0001 patch, do you mean that we should document
that after splitting a batch N, its rows can only redispatch in N0 or N1 ?

Regards,
Attachment
Thanks for continuing to work on this.

Are you planning to modify what is displayed for memory usage in
EXPLAIN ANALYZE?

Also, since that won't help a user who OOMs, I wondered if the spillCxt
is helpful on its own or if we need some kind of logging message for
users to discover that this is what led them to running out of memory.

On Wed, May 10, 2023 at 02:24:19PM +0200, Jehan-Guillaume de Rorthais wrote:
> On Mon, 8 May 2023 11:56:48 -0400 Melanie Plageman <melanieplageman@gmail.com> wrote:
>
> > > @@ -934,13 +943,16 @@ ExecHashIncreaseNumBatches(HashJoinTable hashtable)
> > >             hashtable, nbatch, hashtable->spaceUsed);
> > >  #endif
> > >
> > > -    oldcxt = MemoryContextSwitchTo(hashtable->hashCxt);
> > > -
> > >      if (hashtable->innerBatchFile == NULL)
> > >      {
> > > +        MemoryContext oldcxt =
> > > MemoryContextSwitchTo(hashtable->fileCxt); +
> > >          /* we had no file arrays before */
> > >          hashtable->innerBatchFile = palloc0_array(BufFile *,
> > > nbatch); hashtable->outerBatchFile = palloc0_array(BufFile *, nbatch);
> > > +
> > > +        MemoryContextSwitchTo(oldcxt);
> > > +
> > >          /* time to establish the temp tablespaces, too */
> > >          PrepareTempTablespaces();
> > >      }
> > > @@ -951,8 +963,6 @@ ExecHashIncreaseNumBatches(HashJoinTable hashtable)
> >
> > I don't see a reason to call repalloc0_array() in a different context
> > than the initial palloc0_array().
>
> Unless I'm wrong, wrapping the whole if/else blocks in memory context
> hashtable->fileCxt seemed useless as repalloc() actually realloc in the context
> the original allocation occurred. So I only wrapped the palloc() calls.

My objection is less about correctness and more about the diff. The
existing memory context switch is around the whole if/else block. If you
want to move it to only wrap the if statement, I would do that in a
separate commit with a message describing the rationale. It doesn't seem
to save us much and it makes the diff a bit more confusing. I don't feel
strongly enough about this to protest much more, though.

> > > diff --git a/src/include/executor/hashjoin.h
> > > b/src/include/executor/hashjoin.h index 8ee59d2c71..74867c3e40 100644
> > > --- a/src/include/executor/hashjoin.h
> > > +++ b/src/include/executor/hashjoin.h
> > > @@ -25,10 +25,14 @@
> > >   *
> > >   * Each active hashjoin has a HashJoinTable control block, which is
> > >   * palloc'd in the executor's per-query context.  All other storage needed
> > > - * for the hashjoin is kept in private memory contexts, two for each
> > > hashjoin.
> > > + * for the hashjoin is kept in private memory contexts, three for each
> > > + * hashjoin:
> >
> > Maybe "hash table control block". I know the phrase "control block" is
> > used elsewhere in the comments, but it is a bit confusing. Also, I wish
> > there was a way to make it clear this is for the hashtable but relevant
> > to all batches.
>
> I tried to reword the comment with this additional info in mind in v6. Does it
> match what you had in mind?

Review of that below.

> > So, if we are going to allocate the array of pointers to the spill files
> > in the fileCxt, we should revise this comment. As I mentioned above, I
> > agree with you that if the SharedTupleStore-related buffers are also
> > allocated in this context, perhaps it shouldn't be called the fileCxt.
> >
> > One idea I had is calling it the spillCxt. Almost all memory allocated in this
> > context is related to needing to spill to permanent storage during execution.
>
> Agree
>
> > The one potential confusing part of this is batch 0 for parallel hash
> > join. I would have to dig back into it again, but from a cursory look at
> > ExecParallelHashJoinSetUpBatches() it seems like batch 0 also gets a
> > shared tuplestore with associated accessors and files even if it is a
> > single batch parallel hashjoin.
> >
> > Are the parallel hash join read_buffer and write_chunk also used for a
> > single batch parallel hash join?
>
> I don't think so.
>
> For the inner side, there's various Assert() around the batchno==0 special
> case. Plus, it always has his own block when inserting in a batch, to directly
> write in shared memory calling ExecParallelHashPushTuple().
>
> The outer side of the join actually creates all batches using shared tuple
> storage mechanism, including batch 0, **only** if the number of batch is
> greater than 1. See in ExecParallelHashJoinOuterGetTuple:
>
>   /*
>    * In the Parallel Hash case we only run the outer plan directly for
>    * single-batch hash joins. Otherwise we have to go to batch files, even
>    * for batch 0.
>    */
>   if (curbatch == 0 && hashtable->nbatch == 1)
>   {
>       slot = ExecProcNode(outerNode);
>
> So, for a single batch PHJ, it seems there's no temp files involved.

spill context seems appropriate, then.

>
> > Though, perhaps spillCxt still makes sense? It doesn't specify
> > multi-batch...
>
> I'm not sure the see where would be the confusing part here? Is it that some
> STS mechanism are allocated but never used? When the number of batch is 1, it
> doesn't really matter much I suppose, as the context consumption stays
> really low. Plus, there's some other useless STS/context around there (ie. inner
> batch 0 and batch context in PHJ). I'm not sure it worth trying optimizing this
> compare to the cost of the added code complexity.
>
> Or am I off-topic and missing something obvious?

My concern was that, because the shared tuplestore is used for single
batch parallel hashjoins, if memory allocated for the shared tuplestore
was allocated in the spill context (like the accessors or some buffers)
but no temp files were used because it is a single batch hash join, that
it would be confusing (more for the developer than the user) to see
memory allocated in a "spill" context (which implies spilling). But, I
think there is no point in belaboring this any further.

> > > --- a/src/include/executor/nodeHashjoin.h
> > > +++ b/src/include/executor/nodeHashjoin.h
> > > @@ -29,6 +29,6 @@ extern void ExecHashJoinInitializeWorker(HashJoinState
> > > *state, ParallelWorkerContext *pwcxt);
> > >
> >
> > I would add a comment explaining why ExecHashJoinSaveTuple() is passed
> > with the fileCxt as a parameter.
> >
> > >  extern void ExecHashJoinSaveTuple(MinimalTuple tuple, uint32 hashvalue,
>
> Isn't the comment added in the function itself, in v6, enough? It seems
> uncommon to comment on function parameters in headers.

The comment seems good to me.

> Last, about your TODO in 0001 patch, do you mean that we should document
> that after splitting a batch N, its rows can only redispatch in N0 or N1 ?

I mean that if we split batch 5 during execution, tuples can only be
spilled to batches 6+ (since we will have already processed batches
0-4). I think this is how it works, though I haven't reviewed this part
of the code in some time.

> From 6c9056979eb4d638f0555a05453686e01b1d1d11 Mon Sep 17 00:00:00 2001
> From: Jehan-Guillaume de Rorthais <jgdr@dalibo.com>
> Date: Mon, 27 Mar 2023 15:54:39 +0200
> Subject: [PATCH 2/3] Allocate hash batches related BufFile in a dedicated
>  context

This patch mainly looks good now. I had some suggested rewording below.

> diff --git a/src/include/executor/hashjoin.h b/src/include/executor/hashjoin.h

I've suggested a few edits to your block comment in hashjoin.h below:

>  /* ----------------------------------------------------------------
>   *                hash-join hash table structures
>   *

[...]
 * Each active hashjoin has a HashJoinTable structure, which is
 * palloc'd in the executor's per-query context.  Other storage needed for
 * each hashjoin is split amongst three child contexts:
 *   - HashTableContext (hashCxt): the top hash table storage context
 *     - HashSpillContext (spillCxt): storage for temp files buffers
 *     - HashBatchContext (batchCxt): storage for a batch in serial hash join
 *
 [...]
 *
 * Data is allocated in the "hashCxt" when it should live throughout the
 * lifetime of the join. This mainly consists of hashtable metadata.
 *
 * Data associated with temporary files needed when the hash join must
 * spill to disk is allocated in the "spillCxt" context. This context
 * lives lives for the duration of the join, as spill files concerning
 * multiple batches coexist. These files are explicitly destroyed by
 * calling BufFileClose() when the hash join has finished executing the
 * batch. done with them. The aim of this context is to help account for
 * the memory dedicated to temp files and their buffers.
 *
 * Finally, storage that is only wanted for the current batch is
 * allocated in the "batchCxt".  By resetting the batchCxt at the end of
 * each batch, we free all the per-batch storage reliably and without
 * tedium.
 *
 [...]


- Melanie
Hi,

Thanks for the patches. A couple mostly minor comments, to complement
Melanie's review:

0001

I'm not really sure about calling this "hybrid hash-join". What does it
even mean? The new comments simply describe the existing batching, and
how we increment number of batches, etc.

When someone says "hybrid" it usually means a combination of two very
different approaches. Say, a join switching between NL and HJ would be
hybrid. But this is not it.

I'm not against describing the behavior, but the comment either needs to
explain why it's hybrid or it should not be called that.


0002

I wouldn't call the new ExecHashJoinSaveTuple parameter spillcxt but
just something generic (e.g. cxt). Yes, we're passing spillCxt, but from
the function's POV it's just a pointer.

I also wouldn't move the ExecHashJoinSaveTuple comment inside - it just
needs to be reworded that we're expecting the context to be with the
right lifespan. The function comment is the right place to document such
expectations, people are less likely to read the function body.

The modified comment in hashjoin.h has a some alignment issues.


regards

--
Tomas Vondra
EnterpriseDB: http://www.enterprisedb.com
The Enterprise PostgreSQL Company
On 5/12/23 23:36, Melanie Plageman wrote:
> Thanks for continuing to work on this.
>
> Are you planning to modify what is displayed for memory usage in
> EXPLAIN ANALYZE?
>

We could do that, but we can do that separately - it's a separate and
independent improvement, I think.

Also, do you have a proposal how to change the explain output? In
principle we already have the number of batches, so people can calculate
the "peak" amount of memory (assuming they realize what it means).

I think the main problem with adding this info to EXPLAIN is that I'm
not sure it's very useful in practice. I've only really heard about this
memory explosion issue when the query dies with OOM or takes forever,
but EXPLAIN ANALYZE requires the query to complete.

A separate memory context (which  pg_log_backend_memory_contexts can
dump to server log) is more valuable, I think.

> Also, since that won't help a user who OOMs, I wondered if the spillCxt
> is helpful on its own or if we need some kind of logging message for
> users to discover that this is what led them to running out of memory.
>

I think the separate memory context is definitely an improvement,
helpful on it's own it makes it clear *what* allocated the memory. It
requires having the memory context stats, but we may already dump them
into the server log if malloc returns NULL. Granted, it depends on how
the system is configured and it won't help when OOM killer hits :-(

I wouldn't object to having some sort of log message, but when exactly
would we emit it? Presumably after exceeding some amount of memory, but
what would it be? It can't be too low (not to trigger it too often) or
too high (failing to report the issue). Also, do you think it should go
to the user or just to the server log?


regards

--
Tomas Vondra
EnterpriseDB: http://www.enterprisedb.com
The Enterprise PostgreSQL Company
On Sun, 14 May 2023 00:10:00 +0200
Tomas Vondra <tomas.vondra@enterprisedb.com> wrote:

> On 5/12/23 23:36, Melanie Plageman wrote:
> > Thanks for continuing to work on this.
> >
> > Are you planning to modify what is displayed for memory usage in
> > EXPLAIN ANALYZE?

Yes, I already start to work on this. Tracking spilling memory in
spaceUsed/spacePeak change the current behavior of the serialized HJ because it
will increase the number of batch much faster, so this is a no go for v16.

I'll try to accumulate the total allocated (used+not used) spill context memory
in instrumentation. This is gross, but it avoids to track the spilling memory
in its own structure entry.

> We could do that, but we can do that separately - it's a separate and
> independent improvement, I think.

+1

> Also, do you have a proposal how to change the explain output? In
> principle we already have the number of batches, so people can calculate
> the "peak" amount of memory (assuming they realize what it means).

We could add the batch memory consumption with the number of batches. Eg.:

  Buckets: 4096 (originally 4096)
  Batches: 32768 (originally 8192) using 256MB
  Memory Usage: 192kB

> I think the main problem with adding this info to EXPLAIN is that I'm
> not sure it's very useful in practice. I've only really heard about this
> memory explosion issue when the query dies with OOM or takes forever,
> but EXPLAIN ANALYZE requires the query to complete.

It could be useful to help admins tuning their queries realize that the current
number of batches is consuming much more memory than the join itself.

This could help them fix the issue before OOM happen.

Regards,
Hi,

Thanks for your review!

On Sat, 13 May 2023 23:47:53 +0200
Tomas Vondra <tomas.vondra@enterprisedb.com> wrote:

> Thanks for the patches. A couple mostly minor comments, to complement
> Melanie's review:
>
> 0001
>
> I'm not really sure about calling this "hybrid hash-join". What does it
> even mean? The new comments simply describe the existing batching, and
> how we increment number of batches, etc.

Unless I'm wrong, I believed it comes from the "Hybrid hash join algorithm" as
described here (+ see pdf in this page ref):

  https://en.wikipedia.org/wiki/Hash_join#Hybrid_hash_join

I added the ref in the v7 documentation to avoid futur confusion, is it ok?

> 0002
>
> I wouldn't call the new ExecHashJoinSaveTuple parameter spillcxt but
> just something generic (e.g. cxt). Yes, we're passing spillCxt, but from
> the function's POV it's just a pointer.

changed in v7.

> I also wouldn't move the ExecHashJoinSaveTuple comment inside - it just
> needs to be reworded that we're expecting the context to be with the
> right lifespan. The function comment is the right place to document such
> expectations, people are less likely to read the function body.

moved and reworded in v7.

> The modified comment in hashjoin.h has a some alignment issues.

I see no alignment issue. I suppose what bother you might be the spaces
before spillCxt and batchCxt to show they are childs of hashCxt? Should I
remove them?

Regards,
Attachment
On 5/16/23 00:15, Jehan-Guillaume de Rorthais wrote:
> Hi,
>
> Thanks for your review!
>
> On Sat, 13 May 2023 23:47:53 +0200
> Tomas Vondra <tomas.vondra@enterprisedb.com> wrote:
>
>> Thanks for the patches. A couple mostly minor comments, to complement
>> Melanie's review:
>>
>> 0001
>>
>> I'm not really sure about calling this "hybrid hash-join". What does it
>> even mean? The new comments simply describe the existing batching, and
>> how we increment number of batches, etc.
>
> Unless I'm wrong, I believed it comes from the "Hybrid hash join algorithm" as
> described here (+ see pdf in this page ref):
>
>   https://en.wikipedia.org/wiki/Hash_join#Hybrid_hash_join
>
> I added the ref in the v7 documentation to avoid futur confusion, is it ok?
>

Ah, I see. I'd just leave out the "hybrid" entirely. We've lived without
it until now, we know what the implementation does ...

>> 0002
>>
>> I wouldn't call the new ExecHashJoinSaveTuple parameter spillcxt but
>> just something generic (e.g. cxt). Yes, we're passing spillCxt, but from
>> the function's POV it's just a pointer.
>
> changed in v7.
>
>> I also wouldn't move the ExecHashJoinSaveTuple comment inside - it just
>> needs to be reworded that we're expecting the context to be with the
>> right lifespan. The function comment is the right place to document such
>> expectations, people are less likely to read the function body.
>
> moved and reworded in v7.
>
>> The modified comment in hashjoin.h has a some alignment issues.
>
> I see no alignment issue. I suppose what bother you might be the spaces
> before spillCxt and batchCxt to show they are childs of hashCxt? Should I
> remove them?
>

It didn't occur to me this is intentional to show the contexts are
children of hashCxt, so maybe it's not a good way to document that. I'd
remove it, and if you think it's something worth mentioning, I'd add an
explicit comment.


regards

--
Tomas Vondra
EnterpriseDB: http://www.enterprisedb.com
The Enterprise PostgreSQL Company
Hi,

On Tue, 16 May 2023 12:01:51 +0200 Tomas Vondra <tomas.vondra@enterprisedb.com>
wrote:

> On 5/16/23 00:15, Jehan-Guillaume de Rorthais wrote:
> > On Sat, 13 May 2023 23:47:53 +0200
> > Tomas Vondra <tomas.vondra@enterprisedb.com> wrote:
> ...
> >> I'm not really sure about calling this "hybrid hash-join". What does it
> >> even mean? The new comments simply describe the existing batching, and
> >> how we increment number of batches, etc.
> >
> > Unless I'm wrong, I believed it comes from the "Hybrid hash join algorithm"
> > as described here (+ see pdf in this page ref):
> >
> >   https://en.wikipedia.org/wiki/Hash_join#Hybrid_hash_join
> >
> > I added the ref in the v7 documentation to avoid futur confusion, is it ok?
>
> Ah, I see. I'd just leave out the "hybrid" entirely. We've lived without
> it until now, we know what the implementation does ...

I changed the title, but kept the reference. There's still two other uses
of "hybrid hash join algorithm" in function and code comments. Keeping the ref
in this header doesn't cost much and help new comers.

> >> 0002
> >> ...
> >> The modified comment in hashjoin.h has a some alignment issues.
> >
> > I see no alignment issue. I suppose what bother you might be the spaces
> > before spillCxt and batchCxt to show they are childs of hashCxt? Should I
> > remove them?
>
> It didn't occur to me this is intentional to show the contexts are
> children of hashCxt, so maybe it's not a good way to document that. I'd
> remove it, and if you think it's something worth mentioning, I'd add an
> explicit comment.

Changed.

Thanks,
Attachment
On Tue, May 16, 2023 at 04:00:51PM +0200, Jehan-Guillaume de Rorthais wrote:

> From e5ecd466172b7bae2f1be294c1a5e70ce2b43ed8 Mon Sep 17 00:00:00 2001
> From: Melanie Plageman <melanieplageman@gmail.com>
> Date: Thu, 30 Apr 2020 07:16:28 -0700
> Subject: [PATCH v8 1/3] Describe hash join implementation
>
> This is just a draft to spark conversation on what a good comment might
> be like in this file on how the hybrid hash join algorithm is
> implemented in Postgres. I'm pretty sure this is the accepted term for
> this algorithm https://en.wikipedia.org/wiki/Hash_join#Hybrid_hash_join

I recommend changing the commit message to something like this:

    Describe hash join implementation

    Add details to the block comment in nodeHashjoin.c describing the
    hybrid hash join algorithm at a high level.

    Author: Melanie Plageman <melanieplageman@gmail.com>
    Author: Jehan-Guillaume de Rorthais <jgdr@dalibo.com>
    Reviewed-by: Tomas Vondra <tomas.vondra@enterprisedb.com>
    Discussion: https://postgr.es/m/20230516160051.4267a800%40karst

> diff --git a/src/backend/executor/nodeHashjoin.c b/src/backend/executor/nodeHashjoin.c
> index 0a3f32f731..93a78f6f74 100644
> --- a/src/backend/executor/nodeHashjoin.c
> +++ b/src/backend/executor/nodeHashjoin.c
> @@ -10,6 +10,47 @@
>   * IDENTIFICATION
>   *      src/backend/executor/nodeHashjoin.c
>   *
> + * HASH JOIN
> + *
> + * This is based on the "hybrid hash join" algorithm described shortly in the
> + * following page, and in length in the pdf in page's notes:
> + *
> + *   https://en.wikipedia.org/wiki/Hash_join#Hybrid_hash_join
> + *
> + * If the inner side tuples of a hash join do not fit in memory, the hash join
> + * can be executed in multiple batches.
> + *
> + * If the statistics on the inner side relation are accurate, planner chooses a
> + * multi-batch strategy and estimates the number of batches.
> + *
> + * The query executor measures the real size of the hashtable and increases the
> + * number of batches if the hashtable grows too large.
> + *
> + * The number of batches is always a power of two, so an increase in the number
> + * of batches doubles it.
> + *
> + * Serial hash join measures batch size lazily -- waiting until it is loading a
> + * batch to determine if it will fit in memory. While inserting tuples into the
> + * hashtable, serial hash join will, if that tuple were to exceed work_mem,
> + * dump out the hashtable and reassign them either to other batch files or the
> + * current batch resident in the hashtable.
> + *
> + * Parallel hash join, on the other hand, completes all changes to the number
> + * of batches during the build phase. If it increases the number of batches, it
> + * dumps out all the tuples from all batches and reassigns them to entirely new
> + * batch files. Then it checks every batch to ensure it will fit in the space
> + * budget for the query.
> + *
> + * In both parallel and serial hash join, the executor currently makes a best
> + * effort. If a particular batch will not fit in memory, it tries doubling the
> + * number of batches. If after a batch increase, there is a batch which
> + * retained all or none of its tuples, the executor disables growth in the
> + * number of batches globally. After growth is disabled, all batches that would
> + * have previously triggered an increase in the number of batches instead
> + * exceed the space allowed.
> + *
> + * TODO: should we discuss that tuples can only spill forward?

I would just cut this for now since we haven't started on an agreed-upon
wording.

> From 309ad354b7a9e4dfa01b2985bd883829f5e0eba0 Mon Sep 17 00:00:00 2001
> From: Jehan-Guillaume de Rorthais <jgdr@dalibo.com>
> Date: Tue, 16 May 2023 15:42:14 +0200
> Subject: [PATCH v8 2/3] Allocate hash batches related BufFile in a dedicated
>  context

Here is a draft commit message for the second patch:

    Dedicated memory context for hash join spill metadata

    A hash join's hashtable may be split up into multiple batches if it
    would otherwise exceed work_mem. The number of batches is doubled each
    time a given batch is determined not to fit in memory. Each batch file
    is allocated with a block-sized buffer for buffering tuples (parallel
    hash join has additional sharedtuplestore accessor buffers).

    In some cases, often with skewed data, bad stats, or very large
    datasets, users can run out-of-memory while attempting to fit an
    oversized batch in memory solely from the memory overhead of all the
    batch files' buffers.

    Batch files were allocated in the ExecutorState memory context, making
    it very hard to identify when this batch explosion was the source of an
    OOM. By allocating the batch files in a dedicated memory context, it
    should be easier for users to identify the cause of an OOM and work to
    avoid it.

I recommend editing and adding links to the various discussions on this
topic from your research.

As for the patch itself, I noticed that there are few things needing
pgindenting.

I usually do the following to run pgindent (in case you haven't done
this recently).

Change the pg_bsd_indent meson file "install" value to true (like this
diff):

diff --git a/src/tools/pg_bsd_indent/meson.build b/src/tools/pg_bsd_indent/meson.build
index 5545c097bf..85bedf13f6 100644
--- a/src/tools/pg_bsd_indent/meson.build
+++ b/src/tools/pg_bsd_indent/meson.build
@@ -21,7 +21,7 @@ pg_bsd_indent = executable('pg_bsd_indent',
   dependencies: [frontend_code],
   include_directories: include_directories('.'),
   kwargs: default_bin_args + {
-    'install': false,
+    'install': true,
 # possibly at some point do this:
 #   'install_dir': dir_pgxs / 'src/tools/pg_bsd_indent',
   },

Install pg_bsd_indent.
Run pg_indent.
I do the following to run pgindent:

src/tools/pgindent/pgindent --indent \
$INSTALL_PATH/pg_bsd_indent --typedef \
src/tools/pgindent/typedefs.list -- $(git diff origin/master --name-only '*.c' '*.h')

There are some existing indentation issues in these files, but you can
leave those or put them in a separate commit.

> @@ -3093,8 +3107,11 @@ ExecParallelHashJoinSetUpBatches(HashJoinTable hashtable, int nbatch)
>      pstate->nbatch = nbatch;
>      batches = dsa_get_address(hashtable->area, pstate->batches);
>
> -    /* Use hash join memory context. */
> -    oldcxt = MemoryContextSwitchTo(hashtable->hashCxt);

Add a period at the end of this comment.

> +    /*
> +     * Use hash join spill memory context to allocate accessors and their
> +     * buffers
> +     */
> +    oldcxt = MemoryContextSwitchTo(hashtable->spillCxt);
>
>      /* Allocate this backend's accessor array. */
>      hashtable->nbatch = nbatch;
> @@ -3196,8 +3213,8 @@ ExecParallelHashEnsureBatchAccessors(HashJoinTable hashtable)
>       */
>      Assert(DsaPointerIsValid(pstate->batches));
>
> -    /* Use hash join memory context. */
> -    oldcxt = MemoryContextSwitchTo(hashtable->hashCxt);

Add a period at the end of this comment.

> +    /* Use hash join spill memory context to allocate accessors */
> +    oldcxt = MemoryContextSwitchTo(hashtable->spillCxt);
>
>      /* Allocate this backend's accessor array. */
>      hashtable->nbatch = pstate->nbatch;

> diff --git a/src/backend/executor/nodeHashjoin.c b/src/backend/executor/nodeHashjoin.c
> @@ -1313,21 +1314,30 @@ ExecParallelHashJoinNewBatch(HashJoinState *hjstate)
>   * The data recorded in the file for each tuple is its hash value,
>   * then the tuple in MinimalTuple format.
>   *
> - * Note: it is important always to call this in the regular executor
> - * context, not in a shorter-lived context; else the temp file buffers
> - * will get messed up.
> + * If this is the first write to the batch file, this function first
> + * create it.  The associated BufFile buffer is allocated in the given
> + * context.  It is important to always give the HashSpillContext
> + * context.  First to avoid a shorter-lived context, else the temp file
> + * buffers will get messed up.  Second, for a better accounting of the
> + * spilling memory consumption.
> + *
>   */

Here is my suggested wording fot this block comment:

The batch file is lazily created. If this is the first tuple written to
this batch, the batch file is created and its buffer is allocated in the
given context. It is important to pass in a memory context which will
live for the entirety of the lifespan of the batch.

Since we went to the trouble of naming the context something generic,
perhaps move the comment about accounting for the memory consumption to
the call site.

>  void
>  ExecHashJoinSaveTuple(MinimalTuple tuple, uint32 hashvalue,
> -                      BufFile **fileptr)
> +                      BufFile **fileptr, MemoryContext cxt)
>  {

> diff --git a/src/include/executor/hashjoin.h b/src/include/executor/hashjoin.h
> index 8ee59d2c71..ac27222d18 100644
> --- a/src/include/executor/hashjoin.h
> +++ b/src/include/executor/hashjoin.h
> @@ -23,12 +23,12 @@
>  /* ----------------------------------------------------------------
>   *                hash-join hash table structures
>   *
> - * Each active hashjoin has a HashJoinTable control block, which is
> - * palloc'd in the executor's per-query context.  All other storage needed
> - * for the hashjoin is kept in private memory contexts, two for each hashjoin.
> - * This makes it easy and fast to release the storage when we don't need it
> - * anymore.  (Exception: data associated with the temp files lives in the
> - * per-query context too, since we always call buffile.c in that context.)
> + * Each active hashjoin has a HashJoinTable structure, which is

"Other storages" should be "Other storage"

> + * palloc'd in the executor's per-query context.  Other storages needed for
> + * each hashjoin is kept in child contexts, three for each hashjoin:
> + *   - HashTableContext (hashCxt): the parent hash table storage context
> + *   - HashSpillContext (spillCxt): storage for temp files buffers
> + *   - HashBatchContext (batchCxt): storage for a batch in serial hash join
>   *
>   * The hashtable contexts are made children of the per-query context, ensuring
>   * that they will be discarded at end of statement even if the join is
> @@ -36,9 +36,19 @@
>   * be cleaned up by the virtual file manager in event of an error.)
>   *
>   * Storage that should live through the entire join is allocated from the
> - * "hashCxt", while storage that is only wanted for the current batch is
> - * allocated in the "batchCxt".  By resetting the batchCxt at the end of
> - * each batch, we free all the per-batch storage reliably and without tedium.

"mainly hash's meta datas" -> "mainly the hashtable's metadata"

> + * "hashCxt" (mainly hash's meta datas). Also, the "hashCxt" context is the
> + * parent of "spillCxt" and "batchCxt". It makes it easy and fast to release
> + * the storage when we don't need it anymore.
> + *

Suggested alternative wording for the below:

* Data associated with temp files is allocated in the "spillCxt" context
* which lives for the duration of the entire join as batch files'
* creation and usage may span batch execution. These files are
* explicitly destroyed by calling BufFileClose() when the code is done
* with them. The aim of this context is to help accounting for the
* memory allocated for temp files and their buffers.

> + * Data associated with temp files lives in the "spillCxt" context which lives
> + * during the entire join as temp files might need to survives batches. These
> + * files are explicitly destroyed by calling BufFileClose() when the code is
> + * done with them. The aim of this context is to help accounting the memory
> + * allocations dedicated to temp files and their buffers.
> + *

Suggested alternative wording for the below:

* Finally, data used only during a single batch's execution is allocated
* in the "batchCxt". By resetting the batchCxt at the end of each batch,
* we free all the per-batch storage reliably and without tedium.

> + * Finaly, storage that is only wanted for the current batch is allocated in
> + * the "batchCxt".  By resetting the batchCxt at the end of each batch, we free
> + * all the per-batch storage reliably and without tedium.

- Melanie
On Sun, May 14, 2023 at 12:10:00AM +0200, Tomas Vondra wrote:
> On 5/12/23 23:36, Melanie Plageman wrote:
> > Thanks for continuing to work on this.
> >
> > Are you planning to modify what is displayed for memory usage in
> > EXPLAIN ANALYZE?
> >
>
> We could do that, but we can do that separately - it's a separate and
> independent improvement, I think.
>
> Also, do you have a proposal how to change the explain output? In
> principle we already have the number of batches, so people can calculate
> the "peak" amount of memory (assuming they realize what it means).

I don't know that we can expect people looking at the EXPLAIN output to
know how much space the different file buffers are taking up. Not to
mention that it is different for parallel hash join.

I like Jean-Guillaume's idea in his email responding to this point:

> We could add the batch memory consumption with the number of batches. Eg.:

>  Buckets: 4096 (originally 4096)
>  Batches: 32768 (originally 8192) using 256MB
>  Memory Usage: 192kB

However, I think we can discuss this for 17.

> I think the main problem with adding this info to EXPLAIN is that I'm
> not sure it's very useful in practice. I've only really heard about this
> memory explosion issue when the query dies with OOM or takes forever,
> but EXPLAIN ANALYZE requires the query to complete.
>
> A separate memory context (which  pg_log_backend_memory_contexts can
> dump to server log) is more valuable, I think.

Yes, I'm satisfied with scoping this to only the patch with the
dedicated memory context for now.

> > Also, since that won't help a user who OOMs, I wondered if the spillCxt
> > is helpful on its own or if we need some kind of logging message for
> > users to discover that this is what led them to running out of memory.
> >
>
> I think the separate memory context is definitely an improvement,
> helpful on it's own it makes it clear *what* allocated the memory. It
> requires having the memory context stats, but we may already dump them
> into the server log if malloc returns NULL. Granted, it depends on how
> the system is configured and it won't help when OOM killer hits :-(

Right. I suppose if someone had an OOM and the OOM killer ran, they may
be motivated to disable vm overcommit and then perhaps the memory
context name will show up somewhere in an error message or log?

> I wouldn't object to having some sort of log message, but when exactly
> would we emit it? Presumably after exceeding some amount of memory, but
> what would it be? It can't be too low (not to trigger it too often) or
> too high (failing to report the issue). Also, do you think it should go
> to the user or just to the server log?

I think where the log is delivered is dependent on under what conditions
we log -- if it is fairly preemptive, then doing so in the server log is
enough.

However, I think we can discuss this in the future. You are right that
the dedicated memory context by itself is an improvement.
Determining when to emit the log message seems like it will be too
difficult to accomplish in a day or so.

- Melanie
On Tue, 16 May 2023 16:00:52 -0400
Melanie Plageman <melanieplageman@gmail.com> wrote:

> On Tue, May 16, 2023 at 04:00:51PM +0200, Jehan-Guillaume de Rorthais wrote:
>
> > From e5ecd466172b7bae2f1be294c1a5e70ce2b43ed8 Mon Sep 17 00:00:00 2001
> > From: Melanie Plageman <melanieplageman@gmail.com>
> > Date: Thu, 30 Apr 2020 07:16:28 -0700
> > Subject: [PATCH v8 1/3] Describe hash join implementation
> >
> > This is just a draft to spark conversation on what a good comment might
> > be like in this file on how the hybrid hash join algorithm is
> > implemented in Postgres. I'm pretty sure this is the accepted term for
> > this algorithm https://en.wikipedia.org/wiki/Hash_join#Hybrid_hash_join
>
> I recommend changing the commit message to something like this:
>
>     Describe hash join implementation
>
>     Add details to the block comment in nodeHashjoin.c describing the
>     hybrid hash join algorithm at a high level.
>
>     Author: Melanie Plageman <melanieplageman@gmail.com>
>     Author: Jehan-Guillaume de Rorthais <jgdr@dalibo.com>
>     Reviewed-by: Tomas Vondra <tomas.vondra@enterprisedb.com>
>     Discussion: https://postgr.es/m/20230516160051.4267a800%40karst

Done, but assigning myself as a reviewer as I don't remember having authored
anything in this but the reference to the Hybrid hash page, which is
questionable according to Tomas :)

> > diff --git a/src/backend/executor/nodeHashjoin.c
> > b/src/backend/executor/nodeHashjoin.c index 0a3f32f731..93a78f6f74 100644
> > --- a/src/backend/executor/nodeHashjoin.c
> > ...
> > + * TODO: should we discuss that tuples can only spill forward?
>
> I would just cut this for now since we haven't started on an agreed-upon
> wording.

Removed in v9.

> > From 309ad354b7a9e4dfa01b2985bd883829f5e0eba0 Mon Sep 17 00:00:00 2001
> > From: Jehan-Guillaume de Rorthais <jgdr@dalibo.com>
> > Date: Tue, 16 May 2023 15:42:14 +0200
> > Subject: [PATCH v8 2/3] Allocate hash batches related BufFile in a dedicated
> >  context
>
> Here is a draft commit message for the second patch:
>
>     ...

Thanks. Adopted with some minor rewording... hopefully it's OK.

> I recommend editing and adding links to the various discussions on this
> topic from your research.

Done in v9.

> As for the patch itself, I noticed that there are few things needing
> pgindenting.
>
> I usually do the following to run pgindent (in case you haven't done
> this recently).
>
> ...

Thank you for your recipe.

> There are some existing indentation issues in these files, but you can
> leave those or put them in a separate commit.

Reindented in v9.

I put existing indentation issues in a separate commit to keep the actual
patches clean from distractions.

> ...
> Add a period at the end of this comment.
>
> > +    /*
> > +     * Use hash join spill memory context to allocate accessors and
> > their
> > +     * buffers
> > +     */

Fixed in v9.

> Add a period at the end of this comment.
>
> > +    /* Use hash join spill memory context to allocate accessors */

Fixed in v9.

> > diff --git a/src/backend/executor/nodeHashjoin.c
> > b/src/backend/executor/nodeHashjoin.c @@ -1313,21 +1314,30 @@
> > ExecParallelHashJoinNewBatch(HashJoinState *hjstate)
> >   * The data recorded in the file for each tuple is its hash value,
> >   * then the tuple in MinimalTuple format.
> >   *
> > - * Note: it is important always to call this in the regular executor
> > - * context, not in a shorter-lived context; else the temp file buffers
> > - * will get messed up.
> > + * If this is the first write to the batch file, this function first
> > + * create it.  The associated BufFile buffer is allocated in the given
> > + * context.  It is important to always give the HashSpillContext
> > + * context.  First to avoid a shorter-lived context, else the temp file
> > + * buffers will get messed up.  Second, for a better accounting of the
> > + * spilling memory consumption.
> > + *
> >   */
>
> Here is my suggested wording fot this block comment:
>
> The batch file is lazily created. If this is the first tuple written to
> this batch, the batch file is created and its buffer is allocated in the
> given context. It is important to pass in a memory context which will
> live for the entirety of the lifespan of the batch.

Reworded. The context must actually survive the batch itself, not just live
during the lifespan of the batch.

> >  void
> >  ExecHashJoinSaveTuple(MinimalTuple tuple, uint32 hashvalue,
> > -                      BufFile **fileptr)
> > +                      BufFile **fileptr, MemoryContext
> > cxt) {

Note that I changed this to:

 ExecHashJoinSaveTuple(MinimalTuple tuple, uint32 hashvalue,
                       BufFile **fileptr, HashJoinTable hashtable) {

As this function must allocate BufFile buffer in spillCxt, I suppose
we should force it explicitly in the function code.

Plus, having hashtable locally could be useful for later patch to eg. fine track
allocated memory in spaceUsed.

> > diff --git a/src/include/executor/hashjoin.h
> > b/src/include/executor/hashjoin.h index 8ee59d2c71..ac27222d18 100644
> > --- a/src/include/executor/hashjoin.h
> > +++ b/src/include/executor/hashjoin.h
> > @@ -23,12 +23,12 @@
> >  /* ----------------------------------------------------------------
> >   *                hash-join hash table structures
> >   *
> > - * Each active hashjoin has a HashJoinTable control block, which is
> > - * palloc'd in the executor's per-query context.  All other storage needed
> > - * for the hashjoin is kept in private memory contexts, two for each
> > hashjoin.
> > - * This makes it easy and fast to release the storage when we don't need it
> > - * anymore.  (Exception: data associated with the temp files lives in the
> > - * per-query context too, since we always call buffile.c in that context.)
> > + * Each active hashjoin has a HashJoinTable structure, which is
>
> "Other storages" should be "Other storage"
>
> > + * palloc'd in the executor's per-query context.  Other storages needed for

Fixed in v9.

> ...
>
> "mainly hash's meta datas" -> "mainly the hashtable's metadata"
>
> > + * "hashCxt" (mainly hash's meta datas). Also, the "hashCxt" context is the

Fixed in v9.

> Suggested alternative wording for the below:
>
> * Data associated with temp files is allocated in the "spillCxt" context
> * which lives for the duration of the entire join as batch files'
> * creation and usage may span batch execution. These files are
> * explicitly destroyed by calling BufFileClose() when the code is done
> * with them. The aim of this context is to help accounting for the
> * memory allocated for temp files and their buffers.

Adopted in v9.

> Suggested alternative wording for the below:
>
> * Finally, data used only during a single batch's execution is allocated
> * in the "batchCxt". By resetting the batchCxt at the end of each batch,
> * we free all the per-batch storage reliably and without tedium.

Adopted in v9.

Thank you for your review!

Regards,
Attachment
On Wed, May 17, 2023 at 07:10:08PM +0200, Jehan-Guillaume de Rorthais wrote:
> On Tue, 16 May 2023 16:00:52 -0400
> Melanie Plageman <melanieplageman@gmail.com> wrote:
> > > From 309ad354b7a9e4dfa01b2985bd883829f5e0eba0 Mon Sep 17 00:00:00 2001
> > > From: Jehan-Guillaume de Rorthais <jgdr@dalibo.com>
> > > Date: Tue, 16 May 2023 15:42:14 +0200
> > > Subject: [PATCH v8 2/3] Allocate hash batches related BufFile in a dedicated
> > There are some existing indentation issues in these files, but you can
> > leave those or put them in a separate commit.
>
> Reindented in v9.
>
> I put existing indentation issues in a separate commit to keep the actual
> patches clean from distractions.

It is a matter of opinion, but I tend to prefer the commit with the fix
for the existing indentation issues to be first in the patch set.

> > > diff --git a/src/backend/executor/nodeHashjoin.c
> > > b/src/backend/executor/nodeHashjoin.c @@ -1313,21 +1314,30 @@
> > > ExecParallelHashJoinNewBatch(HashJoinState *hjstate)
> > >   * The data recorded in the file for each tuple is its hash value,
> > >   * then the tuple in MinimalTuple format.
> > >   *
> > > - * Note: it is important always to call this in the regular executor
> > > - * context, not in a shorter-lived context; else the temp file buffers
> > > - * will get messed up.
> > > + * If this is the first write to the batch file, this function first
> > > + * create it.  The associated BufFile buffer is allocated in the given
> > > + * context.  It is important to always give the HashSpillContext
> > > + * context.  First to avoid a shorter-lived context, else the temp file
> > > + * buffers will get messed up.  Second, for a better accounting of the
> > > + * spilling memory consumption.
> > > + *
> > >   */
> >
> > Here is my suggested wording fot this block comment:
> >
> > The batch file is lazily created. If this is the first tuple written to
> > this batch, the batch file is created and its buffer is allocated in the
> > given context. It is important to pass in a memory context which will
> > live for the entirety of the lifespan of the batch.
>
> Reworded. The context must actually survive the batch itself, not just live
> during the lifespan of the batch.

I've added a small recommended change to this inline.

> > >  void
> > >  ExecHashJoinSaveTuple(MinimalTuple tuple, uint32 hashvalue,
> > > -                      BufFile **fileptr)
> > > +                      BufFile **fileptr, MemoryContext
> > > cxt) {
>
> Note that I changed this to:
>
>  ExecHashJoinSaveTuple(MinimalTuple tuple, uint32 hashvalue,
>                        BufFile **fileptr, HashJoinTable hashtable) {
>
> As this function must allocate BufFile buffer in spillCxt, I suppose
> we should force it explicitly in the function code.
>
> Plus, having hashtable locally could be useful for later patch to eg. fine track
> allocated memory in spaceUsed.

I think if you want to pass the hashtable instead of the memory context,
I think you'll need to explain why you still pass the buffile pointer
(because ExecHashJoinSaveTuple() is called for inner and outer batch
files) instead of getting it from the hashtable's arrays of buffile
pointers.

> From c7b70dec3f4c162ea590b53a407c39dfd7ade873 Mon Sep 17 00:00:00 2001
> From: Jehan-Guillaume de Rorthais <jgdr@dalibo.com>
> Date: Tue, 16 May 2023 15:42:14 +0200
> Subject: [PATCH v9 2/3] Dedicated memory context for hash join spill buffers

> @@ -1310,22 +1311,38 @@ ExecParallelHashJoinNewBatch(HashJoinState *hjstate)
>   *
>   * The data recorded in the file for each tuple is its hash value,
>   * then the tuple in MinimalTuple format.
> - *
> - * Note: it is important always to call this in the regular executor
> - * context, not in a shorter-lived context; else the temp file buffers
> - * will get messed up.
>   */
>  void
>  ExecHashJoinSaveTuple(MinimalTuple tuple, uint32 hashvalue,
> -                      BufFile **fileptr)
> +                      BufFile **fileptr, HashJoinTable hashtable)
>  {
>      BufFile    *file = *fileptr;
>
>      if (file == NULL)
>      {
> -        /* First write to this batch file, so open it. */
> +        MemoryContext oldctx;
> +
> +        /*
> +         * The batch file is lazily created. If this is the first tuple
> +         * written to this batch, the batch file is created and its buffer is
> +         * allocated in the spillCxt context, NOT in the batchCxt.
> +         *
> +         * During the building phase, inner batch are created with their temp
> +         * file buffers. These buffers are released later, after the batch is
> +         * loaded back to memory during the outer side scan. That explains why
> +         * it is important to use a memory context which live longer than the
> +         * batch itself or some temp file buffers will get messed up.
> +         *
> +         * Also, we use spillCxt instead of hashCxt for a better accounting of
> +         * the spilling memory consumption.
> +         */

Suggested small edit to the second paragraph:

    During the build phase, buffered files are created for inner batches.
    Each batch's buffered file is closed (and its buffer freed) after the
    batch is loaded into memory during the outer side scan. Therefore, it is
    necessary to allocate the batch file buffer in a memory context which
    outlives the batch itself.

I'd also mention the reason for passing the buffile pointer above the
function. I would basically say:

    The data recorded in the file for each tuple is its hash value,
    then the tuple in MinimalTuple format. fileptr may refer to either an
    inner or outer side batch file.

- Melanie
On Wed, 17 May 2023 13:46:35 -0400
Melanie Plageman <melanieplageman@gmail.com> wrote:

> On Wed, May 17, 2023 at 07:10:08PM +0200, Jehan-Guillaume de Rorthais wrote:
> > On Tue, 16 May 2023 16:00:52 -0400
> > Melanie Plageman <melanieplageman@gmail.com> wrote:
> > > ...
> > > There are some existing indentation issues in these files, but you can
> > > leave those or put them in a separate commit.
> >
> > Reindented in v9.
> >
> > I put existing indentation issues in a separate commit to keep the actual
> > patches clean from distractions.
>
> It is a matter of opinion, but I tend to prefer the commit with the fix
> for the existing indentation issues to be first in the patch set.

OK. moved in v10 patch set.

> ...
> > > >  void
> > > >  ExecHashJoinSaveTuple(MinimalTuple tuple, uint32 hashvalue,
> > > > -                      BufFile **fileptr)
> > > > +                      BufFile **fileptr,
> > > > MemoryContext cxt) {
> >
> > Note that I changed this to:
> >
> >  ExecHashJoinSaveTuple(MinimalTuple tuple, uint32 hashvalue,
> >                        BufFile **fileptr, HashJoinTable hashtable) {
> >
> > As this function must allocate BufFile buffer in spillCxt, I suppose
> > we should force it explicitly in the function code.
> >
> > Plus, having hashtable locally could be useful for later patch to eg. fine
> > track allocated memory in spaceUsed.
>
> I think if you want to pass the hashtable instead of the memory context,
> I think you'll need to explain why you still pass the buffile pointer
> (because ExecHashJoinSaveTuple() is called for inner and outer batch
> files) instead of getting it from the hashtable's arrays of buffile
> pointers.

Comment added in v10

> > @@ -1310,22 +1311,38 @@ ExecParallelHashJoinNewBatch(HashJoinState *hjstate)
> ...
>
> Suggested small edit to the second paragraph:
>
>     During the build phase, buffered files are created for inner batches.
>     Each batch's buffered file is closed (and its buffer freed) after the
>     batch is loaded into memory during the outer side scan. Therefore, it
>     is necessary to allocate the batch file buffer in a memory context
>     which outlives the batch itself.

Changed.

> I'd also mention the reason for passing the buffile pointer above the
> function.

Added.

Regards,
Attachment
On Wed, May 17, 2023 at 6:35 PM Jehan-Guillaume de Rorthais
<jgdr@dalibo.com> wrote:
>
> On Wed, 17 May 2023 13:46:35 -0400
> Melanie Plageman <melanieplageman@gmail.com> wrote:
>
> > On Wed, May 17, 2023 at 07:10:08PM +0200, Jehan-Guillaume de Rorthais wrote:
> > > On Tue, 16 May 2023 16:00:52 -0400
> > > Melanie Plageman <melanieplageman@gmail.com> wrote:
> > > > ...
> > > > There are some existing indentation issues in these files, but you can
> > > > leave those or put them in a separate commit.
> > >
> > > Reindented in v9.
> > >
> > > I put existing indentation issues in a separate commit to keep the actual
> > > patches clean from distractions.
> >
> > It is a matter of opinion, but I tend to prefer the commit with the fix
> > for the existing indentation issues to be first in the patch set.
>
> OK. moved in v10 patch set.

v10 LGTM.
On 5/19/23 00:27, Melanie Plageman wrote:
> On Wed, May 17, 2023 at 6:35 PM Jehan-Guillaume de Rorthais
> <jgdr@dalibo.com> wrote:
>>
>> On Wed, 17 May 2023 13:46:35 -0400
>> Melanie Plageman <melanieplageman@gmail.com> wrote:
>>
>>> On Wed, May 17, 2023 at 07:10:08PM +0200, Jehan-Guillaume de Rorthais wrote:
>>>> On Tue, 16 May 2023 16:00:52 -0400
>>>> Melanie Plageman <melanieplageman@gmail.com> wrote:
>>>>> ...
>>>>> There are some existing indentation issues in these files, but you can
>>>>> leave those or put them in a separate commit.
>>>>
>>>> Reindented in v9.
>>>>
>>>> I put existing indentation issues in a separate commit to keep the actual
>>>> patches clean from distractions.
>>>
>>> It is a matter of opinion, but I tend to prefer the commit with the fix
>>> for the existing indentation issues to be first in the patch set.
>>
>> OK. moved in v10 patch set.
>
> v10 LGTM.

Thanks!

I've pushed 0002 and 0003, after some general bikeshedding and minor
rewording (a bit audacious, admittedly).

I didn't push 0001, I don't think generally do separate pgindent patches
like this (I only run pgindent on large patches to ensure it doesn't
cause massive breakage, not separately like this, but YMMV).

Anyway, that's it for PG16. Let's see if we can do more in this area for
PG17.

regards

--
Tomas Vondra
EnterpriseDB: http://www.enterprisedb.com
The Enterprise PostgreSQL Company
Tomas Vondra <tomas.vondra@enterprisedb.com> writes:
> I didn't push 0001, I don't think generally do separate pgindent patches
> like this (I only run pgindent on large patches to ensure it doesn't
> cause massive breakage, not separately like this, but YMMV).

It's especially pointless when the main pgindent run for v16 is going
to happen today (as soon as I get done clearing out my other queue
items).

            regards, tom lane
On Fri, 19 May 2023 17:23:56 +0200
Tomas Vondra <tomas.vondra@enterprisedb.com> wrote:
> On 5/19/23 00:27, Melanie Plageman wrote:
> > v10 LGTM.
>
> Thanks!
>
> I've pushed 0002 and 0003, after some general bikeshedding and minor
> rewording (a bit audacious, admittedly).

Thank you Melanie et Tomas for your help, review et commit!