Thread: Need help debugging slow logical replication
Hi there,
I am using PG 14.14 on both primary and secondary DB on AWS, setup
using a logical replication, I'm having trouble with huge replication
lag.
My setup is as follows:
P1 - physical - P1-R
| (logical)
P2 - physical - P2-R
The lag between P1 & P1-R , P2 & P2-R are both minimal , less than
10seconds , but I'm seeing several hours of lag between P1 & P2 .We
currently have 1 pub/sub that covers about 100 tables.
Here is the output from P1 showing there is a Lag of at least 80GB
(keep growing)
> SELECT now() AS CURRENT_TIME,
slot_name,
active,
active_pid,confirmed_flush_lsn,
pg_size_pretty(pg_wal_lsn_diff(pg_current_wal_lsn(),
confirmed_flush_lsn)) AS diff_size,
pg_wal_lsn_diff(pg_current_wal_lsn(), confirmed_flush_lsn) AS diff_bytes
FROM pg_replication_slots
WHERE slot_type = 'logical';
-[ RECORD 1 ]-------+---------------------------
current_time | 2023-02-07 23:26:00.733+00
slot_name | upgrade
active | t
active_pid | 5180
confirmed_flush_lsn | 26B09/8C08C610
diff_size | 81 GB
diff_bytes | 86573472240
Here is what pg_stat_replication shows: note that the write_lag is
very high: we previously had to set wal_sender_timeout to 0, otherwise
the logical replication work keep exiting and fail.
> select * from pg_stat_replication;
-[ RECORD 1 ]----+------------------------------
pid | xxx
usesysid | xxx
usename | dev
application_name | upgrade_target
client_addr | 10.xxx
client_hostname |
client_port | 27404
backend_start | 2023-02-07 23:02:39.228572+00
backend_xmin | 2909692747
state | catchup
sent_lsn | 26B09/8C08C610
write_lsn | 26B09/840514C0
flush_lsn | 26B09/840514C0
replay_lsn | 26B09/840514C0
write_lag | 00:07:03.60362
flush_lag | 00:07:03.60362
replay_lag | 00:07:03.60362
sync_priority | 0
sync_state | async
reply_time | 2023-02-07 23:22:08.245066+00
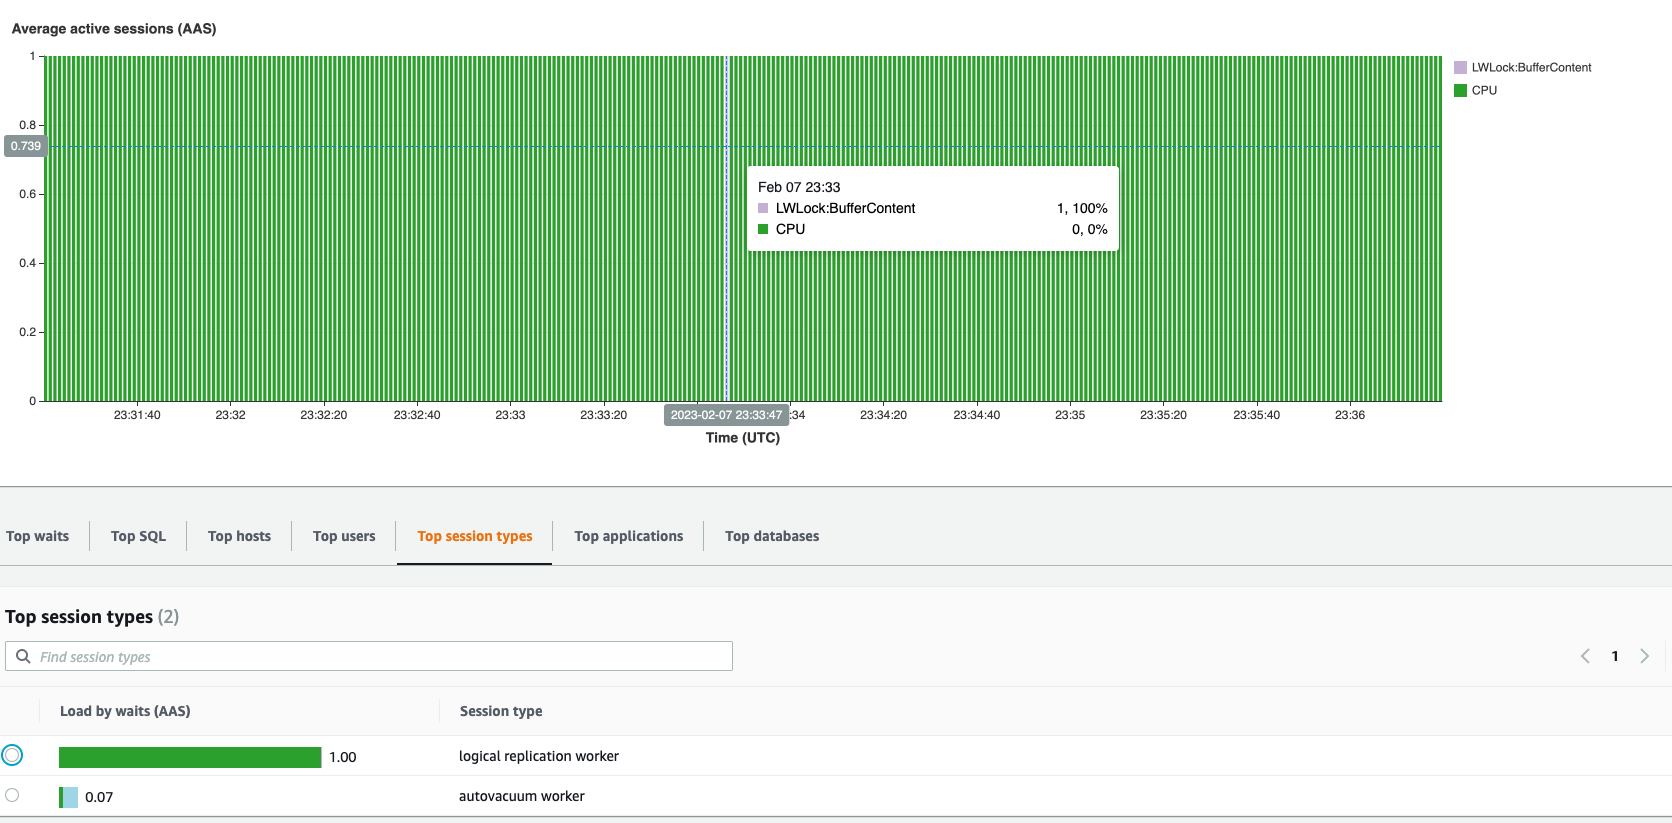
So, the problem seems to be like P2 takes a very long time to apply a
chunk, Mow, my question is why? From AWS performance insight, it
looks like there is only 1 process running on P2, that is 100% blocked
by CPU. I don't really understand why it is being blocked by the CPU,
and any help in further debugging is much appreciated.
Cheers.
Attachment
Hi there,
I am using PG 14.14 on both primary and secondary DB on AWS, setup
using a logical replication, I'm having trouble with huge replication
lag.
My setup is as follows:
P1 - physical - P1-R
| (logical)
P2 - physical - P2-R
The lag between P1 & P1-R , P2 & P2-R are both minimal , less than
10seconds , but I'm seeing several hours of lag between P1 & P2 .We
currently have 1 pub/sub that covers about 100 tables.
Here is the output from P1 showing there is a Lag of at least 80GB
(keep growing)
> SELECT now() AS CURRENT_TIME,
slot_name,
active,
active_pid,confirmed_flush_lsn,
pg_size_pretty(pg_wal_lsn_diff(pg_current_wal_lsn(),
confirmed_flush_lsn)) AS diff_size,
pg_wal_lsn_diff(pg_current_wal_lsn(), confirmed_flush_lsn) AS diff_bytes
FROM pg_replication_slots
WHERE slot_type = 'logical';
-[ RECORD 1 ]-------+---------------------------
current_time | 2023-02-07 23:26:00.733+00
slot_name | upgrade
active | t
active_pid | 5180
confirmed_flush_lsn | 26B09/8C08C610
diff_size | 81 GB
diff_bytes | 86573472240
Here is what pg_stat_replication shows: note that the write_lag is
very high: we previously had to set wal_sender_timeout to 0, otherwise
the logical replication work keep exiting and fail.
> select * from pg_stat_replication;
-[ RECORD 1 ]----+------------------------------
pid | xxx
usesysid | xxx
usename | dev
application_name | upgrade_target
client_addr | 10.xxx
client_hostname |
client_port | 27404
backend_start | 2023-02-07 23:02:39.228572+00
backend_xmin | 2909692747
state | catchup
sent_lsn | 26B09/8C08C610
write_lsn | 26B09/840514C0
flush_lsn | 26B09/840514C0
replay_lsn | 26B09/840514C0
write_lag | 00:07:03.60362
flush_lag | 00:07:03.60362
replay_lag | 00:07:03.60362
sync_priority | 0
sync_state | async
reply_time | 2023-02-07 23:22:08.245066+00
So, the problem seems to be like P2 takes a very long time to apply a
chunk, Mow, my question is why? From AWS performance insight, it
looks like there is only 1 process running on P2, that is 100% blocked
by CPU. I don't really understand why it is being blocked by the CPU,
and any help in further debugging is much appreciated.
Cheers.
Hi Sir,
What is the replica identity being used on the tables? Are any of the tables using REPLICA IDENTITY FULL ?
How many tables are being replicated?
What is the replica identity being used on the tables? Are any of the tables using REPLICA IDENTITY FULL ?
How many tables are being replicated?
Hi Justin:

- i checked that I have 2 tables using replication identity FULL, but
one table is empty and one table has only 1 row
- 7 tables using index
- overall I have ~100 tables in the publication:  But I do find that
some tables doesn't have PK , but using replica identity default, I'm
abit confused since the doc mentioned that that means it is using PK,
does that mean it is using FULL?

Cheers.

On Tue, Feb 7, 2023 at 4:20 PM Justin <zzzzz.graf@gmail.com> wrote:
>
>
> On Tue, Feb 7, 2023 at 6:38 PM sunyucong@gmail.com <sunyucong@gmail.com> wrote:
>>
>> Hi there,
>>
>> I am using PG 14.14 on both primary and secondary DB on AWS, setup
>> using a logical replication, I'm having trouble with huge replication
>> lag.
>>
>> My setup is as follows:
>>
>> P1 - physical - P1-R
>>   | (logical)
>> P2 - physical - P2-R
>>
>>
>> The lag between P1 & P1-R , P2 & P2-R are both minimal , less than
>> 10seconds , but I'm seeing several hours of lag between P1 & P2  .We
>> currently have 1 pub/sub that covers about 100 tables.
>>
>> Here is the output from P1 showing there is a Lag of at least 80GB
>> (keep growing)
>>
>> > SELECT now() AS CURRENT_TIME,
>>        slot_name,
>>        active,
>>        active_pid,confirmed_flush_lsn,
>>        pg_size_pretty(pg_wal_lsn_diff(pg_current_wal_lsn(),
>> confirmed_flush_lsn)) AS diff_size,
>>        pg_wal_lsn_diff(pg_current_wal_lsn(), confirmed_flush_lsn) AS diff_bytes
>> FROM pg_replication_slots
>> WHERE slot_type = 'logical';
>> -[ RECORD 1 ]-------+---------------------------
>> current_time        | 2023-02-07 23:26:00.733+00
>> slot_name           | upgrade
>> active              | t
>> active_pid          | 5180
>> confirmed_flush_lsn | 26B09/8C08C610
>> diff_size           | 81 GB
>> diff_bytes          | 86573472240
>>
>> Here is what pg_stat_replication shows: note that the write_lag is
>> very high: we previously had to set wal_sender_timeout to 0, otherwise
>> the logical replication work keep exiting and fail.
>>
>> > select * from pg_stat_replication;
>> -[ RECORD 1 ]----+------------------------------
>> pid              | xxx
>> usesysid         | xxx
>> usename          | dev
>> application_name | upgrade_target
>> client_addr      | 10.xxx
>> client_hostname  |
>> client_port      | 27404
>> backend_start    | 2023-02-07 23:02:39.228572+00
>> backend_xmin     | 2909692747
>> state            | catchup
>> sent_lsn         | 26B09/8C08C610
>> write_lsn        | 26B09/840514C0
>> flush_lsn        | 26B09/840514C0
>> replay_lsn       | 26B09/840514C0
>> write_lag        | 00:07:03.60362
>> flush_lag        | 00:07:03.60362
>> replay_lag       | 00:07:03.60362
>> sync_priority    | 0
>> sync_state       | async
>> reply_time       | 2023-02-07 23:22:08.245066+00
>>
>> So, the problem seems to be like P2 takes a very long time to apply a
>> chunk,  Mow, my question is why?  From AWS performance insight, it
>> looks like there is only 1 process running on P2, that is 100% blocked
>> by CPU. I don't really understand why it is being blocked by the CPU,
>> and any help in further debugging is much appreciated.
>>
>> Cheers.
>
>
> Hi Sir,
>
> What is the replica identity being used on the tables?  Are any of the tables using  REPLICA IDENTITY FULL ?
>
> How many tables are being replicated?
Hi Justin:
- i checked that I have 2 tables using replication identity FULL, but
one table is empty and one table has only 1 row
- 7 tables using index
- overall I have ~100 tables in the publication: But I do find that
some tables doesn't have PK , but using replica identity default, I'm
abit confused since the doc mentioned that that means it is using PK,
does that mean it is using FULL?
Cheers.
On Tue, Feb 7, 2023 at 4:20 PM Justin <zzzzz.graf@gmail.com> wrote:
>
>
> On Tue, Feb 7, 2023 at 6:38 PM sunyucong@gmail.com <sunyucong@gmail.com> wrote:
>>
>> Hi there,
>>
>> I am using PG 14.14 on both primary and secondary DB on AWS, setup
>> using a logical replication, I'm having trouble with huge replication
>> lag.
>>
>> My setup is as follows:
>>
>> P1 - physical - P1-R
>> | (logical)
>> P2 - physical - P2-R
>>
>>
>> The lag between P1 & P1-R , P2 & P2-R are both minimal , less than
>> 10seconds , but I'm seeing several hours of lag between P1 & P2 .We
>> currently have 1 pub/sub that covers about 100 tables.
>>
>> Here is the output from P1 showing there is a Lag of at least 80GB
>> (keep growing)
>>
>> > SELECT now() AS CURRENT_TIME,
>> slot_name,
>> active,
>> active_pid,confirmed_flush_lsn,
>> pg_size_pretty(pg_wal_lsn_diff(pg_current_wal_lsn(),
>> confirmed_flush_lsn)) AS diff_size,
>> pg_wal_lsn_diff(pg_current_wal_lsn(), confirmed_flush_lsn) AS diff_bytes
>> FROM pg_replication_slots
>> WHERE slot_type = 'logical';
>> -[ RECORD 1 ]-------+---------------------------
>> current_time | 2023-02-07 23:26:00.733+00
>> slot_name | upgrade
>> active | t
>> active_pid | 5180
>> confirmed_flush_lsn | 26B09/8C08C610
>> diff_size | 81 GB
>> diff_bytes | 86573472240
>>
>> Here is what pg_stat_replication shows: note that the write_lag is
>> very high: we previously had to set wal_sender_timeout to 0, otherwise
>> the logical replication work keep exiting and fail.
>>
>> > select * from pg_stat_replication;
>> -[ RECORD 1 ]----+------------------------------
>> pid | xxx
>> usesysid | xxx
>> usename | dev
>> application_name | upgrade_target
>> client_addr | 10.xxx
>> client_hostname |
>> client_port | 27404
>> backend_start | 2023-02-07 23:02:39.228572+00
>> backend_xmin | 2909692747
>> state | catchup
>> sent_lsn | 26B09/8C08C610
>> write_lsn | 26B09/840514C0
>> flush_lsn | 26B09/840514C0
>> replay_lsn | 26B09/840514C0
>> write_lag | 00:07:03.60362
>> flush_lag | 00:07:03.60362
>> replay_lag | 00:07:03.60362
>> sync_priority | 0
>> sync_state | async
>> reply_time | 2023-02-07 23:22:08.245066+00
>>
>> So, the problem seems to be like P2 takes a very long time to apply a
>> chunk, Mow, my question is why? From AWS performance insight, it
>> looks like there is only 1 process running on P2, that is 100% blocked
>> by CPU. I don't really understand why it is being blocked by the CPU,
>> and any help in further debugging is much appreciated.
>>
>> Cheers.
>
>
> Hi Sir,
>
> What is the replica identity being used on the tables? Are any of the tables using REPLICA IDENTITY FULL ?
>
> How many tables are being replicated?
Setting REPLICA IDENTITY FULL causes FULL TABLE SCANS for UPDATES and DELETES. REPLICA IDENTITY FULL should only be used on INSERT only or tables that see very few updates and deletes. REPLICA IDENTITY FULL will cause replaying of the WAL to be very slow if there are many updates/deletes for those tables.
REPLICA IDENTITY DEFAULT will only use primary keys, if the publisher includes those tables, the subscriber when replaying the WAL will stop throwing an error not knowing how to replay the UPDATE/DELETE.
Logical Replication is most likely broken at this point.
I suggest stopping logical replication and correcting tables that don't have qualifying indexes for logical replication by creating the necessary indexes and avoid using replica identity full. Then restart logical replication from the beginning.
Hi Justin, thanks for the response!

> REPLICA IDENTITY DEFAULT   will only use primary keys,  if the publisher  includes those tables, the subscriber when
replayingthe WAL will stop throwing an error not knowing how to replay the UPDATE/DELETE.


But I don't see any errors being thrown out in the postgresql logs?
Should I be seeing it complain there? Is postgresql falling back to
replica identity full here?

However I checked that table, it doesn't seem to be making progress at
all: so I suspect you are right that it is the problem.

> Logical Replication is most likely broken at this point.
>
> I suggest stopping logical replication and correcting tables that don't have qualifying indexes for logical
replicationby creating the necessary indexes and avoid using replica identity full.  Then restart logical replication
fromthe beginning.

>
>
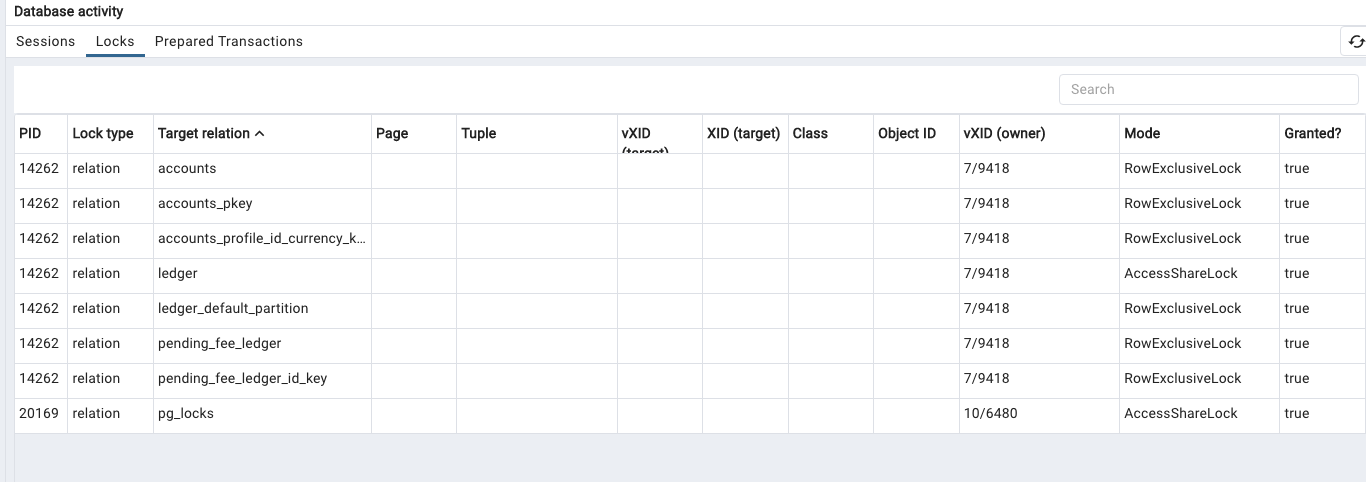
ccing the mailist again in case someone else would have a idea how to debug:

Here is what I see in the pg_locks on subscribe at all time:

As you can see, it mostly concern following 3 tables, accounts,
ledger, pending_ledger_fees, which I have tried analyze, vacuum them
etc, none of them helped much:

I do see in the log these tables are getting autovaccumed *very*
frequently, is that a problem for logical replication?

2023-02-08 04:59:47 UTC::@:[13626]:LOG:  automatic vacuum of table
"dev.public.accounts": index scans: 0
pages: 0 removed, 71437 remain, 0 skipped due to pins, 11465 skipped frozen
tuples: 0 removed, 3590987 remain, 3522495 are dead but not yet
removable, oldest xmin: 2893907681
index scan bypassed: 4 pages from table (0.01% of total) have 5 dead
item identifiers
I/O timings: read: 0.000 ms, write: 0.000 ms
avg read rate: 0.000 MB/s, avg write rate: 0.000 MB/s
buffer usage: 120107 hits, 0 misses, 0 dirtied
WAL usage: 1 records, 0 full page images, 708 bytes
system usage: CPU: user: 0.23 s, system: 0.00 s, elapsed: 1.01 s
2023-02-08 04:59:47 UTC::@:[13626]:LOG:  automatic vacuum of table
"dev.public.pending_fee_ledger": index scans: 0
pages: 0 removed, 199818 remain, 0 skipped due to pins, 117769 skipped frozen
tuples: 0 removed, 3670095 remain, 3520000 are dead but not yet
removable, oldest xmin: 2893907681
index scan not needed: 0 pages from table (0.00% of total) had 0 dead
item identifiers removed
I/O timings: read: 0.000 ms, write: 0.000 ms
avg read rate: 0.000 MB/s, avg write rate: 0.000 MB/s
buffer usage: 164212 hits, 0 misses, 0 dirtied
WAL usage: 0 records, 0 full page images, 0 bytes
system usage: CPU: user: 0.27 s, system: 0.00 s, elapsed: 0.27 s

Thanks

On Tue, Feb 7, 2023 at 6:10 PM sunyucong@gmail.com <sunyucong@gmail.com> wrote:
>
> Hi Justin, thanks for the response!
>
> > REPLICA IDENTITY DEFAULT   will only use primary keys,  if the publisher  includes those tables, the subscriber
when replaying the WAL will stop throwing an error not knowing how to replay the UPDATE/DELETE.

>
> But I don't see any errors being thrown out in the postgresql logs?
> Should I be seeing it complain there? Is postgresql falling back to
> replica identity full here?
>
> However I checked that table, it doesn't seem to be making progress at
> all: so I suspect you are right that it is the problem.
>
> > Logical Replication is most likely broken at this point.
> >
> > I suggest stopping logical replication and correcting tables that don't have qualifying indexes for logical
replicationby creating the necessary indexes and avoid using replica identity full.  Then restart logical replication
fromthe beginning.

> >
> >
Attachment
OK: so I think I've got some new insight by using test_decoding to
peek into the changes being replicate, here is what i think is
happening:

- there is a background job generating a Huge transaction (10K
changes) one after another  that basically does DELETE on 1 table,
INSERT on 1 table and UPDATE on 1 table. Since this is a test
environment, this is the only TX being accumulated.
- since there is only 1 publication,  this  worker on primary
basically spend all its CPU decoding this large transaction then send
to subscriber to execute
   -  memory usage on logical decoding worker maybe a issue: as it
might have spilled to disk during decoding
   -  worker on subscriber basically spend all time applying this change

- I suspect  keep-alives are not sent during applying a transaction,
and the transaction apply time takes longer than wal_sender_timeout
(30seconds) , that's why we have to increase this number before.
- I think utilizing the new streaming feature for logical replication
in PG14 will improve performance here.
- I think the other thing that will help is to drop the index
temporarily on the subscriber to accelerate applying, but will need to
rebuild once close.

BTW: just to clarify Replica identity is not an issue for the table
that only receives INSERT, I tried to create a replica identity for
that table, and it didn't change anything recorded in WAL (as
expected), if anything it actually decreased performance since

What's puzzling for me is that why does logical apply being so slower
than physical apply (and also apparently physical streaming never
times out!)

On Tue, Feb 7, 2023 at 9:13 PM sunyucong@gmail.com <sunyucong@gmail.com> wrote:
>
> ccing the mailist again in case someone else would have a idea how to debug:
>
> Here is what I see in the pg_locks on subscribe at all time:
>
> As you can see, it mostly concern following 3 tables, accounts,
> ledger, pending_ledger_fees, which I have tried analyze, vacuum them
> etc, none of them helped much:
>
> I do see in the log these tables are getting autovaccumed *very*
> frequently, is that a problem for logical replication?
>
> 2023-02-08 04:59:47 UTC::@:[13626]:LOG:  automatic vacuum of table
> "dev.public.accounts": index scans: 0
> pages: 0 removed, 71437 remain, 0 skipped due to pins, 11465 skipped frozen
> tuples: 0 removed, 3590987 remain, 3522495 are dead but not yet
> removable, oldest xmin: 2893907681
> index scan bypassed: 4 pages from table (0.01% of total) have 5 dead
> item identifiers
> I/O timings: read: 0.000 ms, write: 0.000 ms
> avg read rate: 0.000 MB/s, avg write rate: 0.000 MB/s
> buffer usage: 120107 hits, 0 misses, 0 dirtied
> WAL usage: 1 records, 0 full page images, 708 bytes
> system usage: CPU: user: 0.23 s, system: 0.00 s, elapsed: 1.01 s
> 2023-02-08 04:59:47 UTC::@:[13626]:LOG:  automatic vacuum of table
> "dev.public.pending_fee_ledger": index scans: 0
> pages: 0 removed, 199818 remain, 0 skipped due to pins, 117769 skipped frozen
> tuples: 0 removed, 3670095 remain, 3520000 are dead but not yet
> removable, oldest xmin: 2893907681
> index scan not needed: 0 pages from table (0.00% of total) had 0 dead
> item identifiers removed
> I/O timings: read: 0.000 ms, write: 0.000 ms
> avg read rate: 0.000 MB/s, avg write rate: 0.000 MB/s
> buffer usage: 164212 hits, 0 misses, 0 dirtied
> WAL usage: 0 records, 0 full page images, 0 bytes
> system usage: CPU: user: 0.27 s, system: 0.00 s, elapsed: 0.27 s
>
> Thanks
>
> On Tue, Feb 7, 2023 at 6:10 PM sunyucong@gmail.com <sunyucong@gmail.com> wrote:
> >
> > Hi Justin, thanks for the response!
> >
> > > REPLICA IDENTITY DEFAULT   will only use primary keys,  if the publisher  includes those tables, the subscriber
when replaying the WAL will stop throwing an error not knowing how to replay the UPDATE/DELETE.

> >
> > But I don't see any errors being thrown out in the postgresql logs?
> > Should I be seeing it complain there? Is postgresql falling back to
> > replica identity full here?
> >
> > However I checked that table, it doesn't seem to be making progress at
> > all: so I suspect you are right that it is the problem.
> >
> > > Logical Replication is most likely broken at this point.
> > >
> > > I suggest stopping logical replication and correcting tables that don't have qualifying indexes for logical
replicationby creating the necessary indexes and avoid using replica identity full.  Then restart logical replication
fromthe beginning.

> > >
> > >