Thread: Same query taking less time in low configuration machine
Hi,
I have two machines - one with 8GB RAM & 4core CPU and the other with 64GB Ram & 24 core CPU. Both machines have the same DB (Postgres 12 + Postgis 2.5.3). Same query is taking less time in low end machine whereas more time in high end machine. Any thoughts on where to look? I have tuned the db in both machines according to https://pgtune.leopard.in.ua/#/, the function will refer around 14 tables, since both the tables are have same index and views.
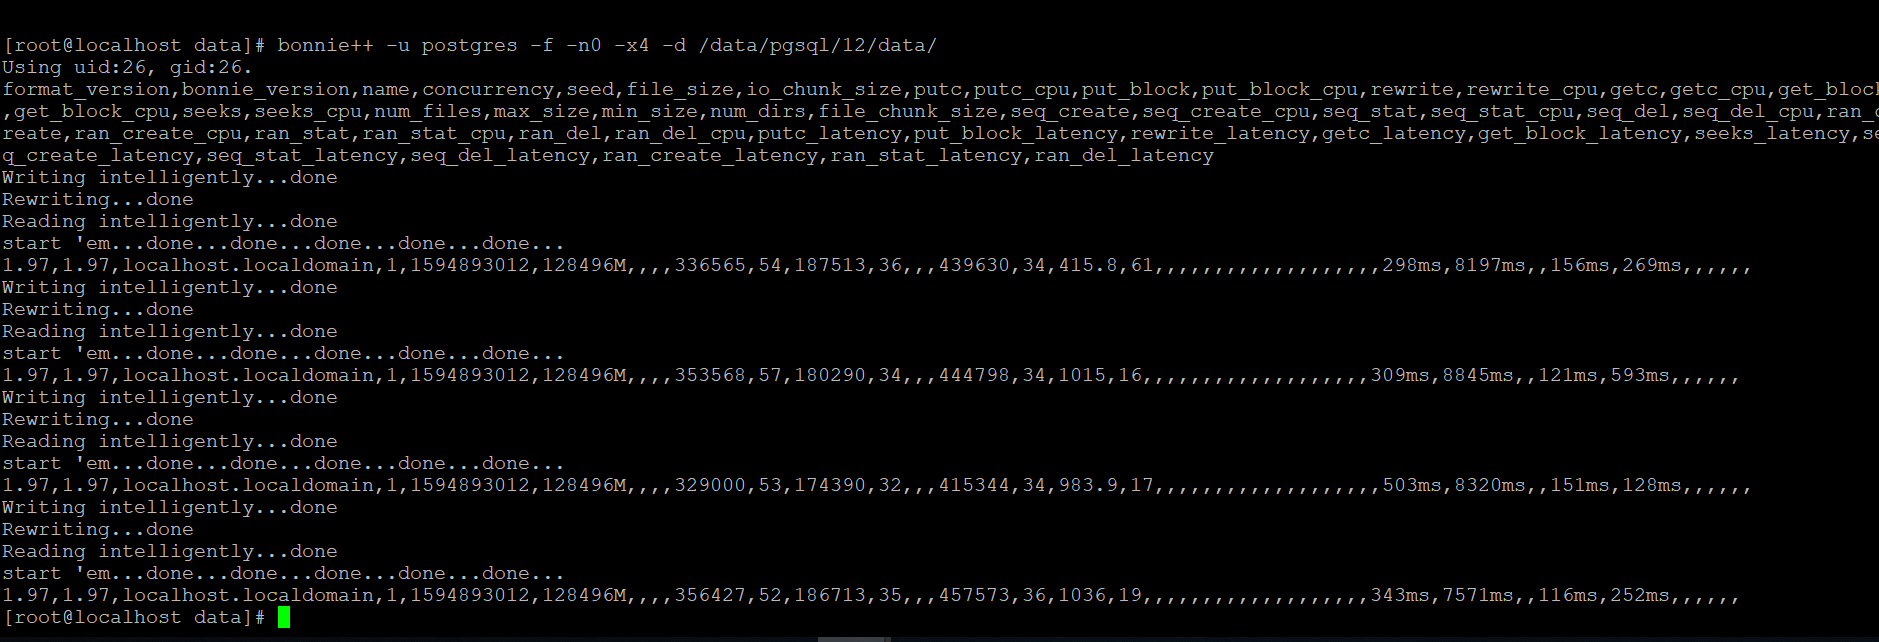
Please find the attachment for query explain & analyze and bonnie result of both the machines.
Low End Machine
-bash-4.2$ psql -p 5434
psql (12.3)
Type "help" for help.
postgres=# \c IPDS_KSEB;
You are now connected to database "IPDS_KSEB" as user "postgres".
IPDS_KSEB=# explain analyze select * from kseb_geometry_trace_with_barrier_partition(5,'kottarakara_version',437,'htline',2) ;
QUERY PLAN
---------------------------------------------------------------------------------------------------------------------------------------------------------
Function Scan on kseb_geometry_trace_with_barrier_partition (cost=0.25..10.25 rows=1000 width=169) (actual time=11626.548..11626.568 rows=254 loops=1)
Planning Time: 0.212 ms
Execution Time: 11628.590 ms
High End Machine
-bash-4.2$ psql -p 5422
psql (12.3)
Type "help" for help.
postgres=# \c IPDS_KSEB;
You are now connected to database "IPDS_KSEB" as user "postgres".
IPDS_KSEB=# explain analyze select * from kseb_geometry_trace_with_barrier_partition(5,'kottarakara_version',437,'htline',2) ;
QUERY PLAN
---------------------------------------------------------------------------------------------------------------------------------------------------------
Function Scan on kseb_geometry_trace_with_barrier_partition (cost=0.25..10.25 rows=1000 width=169) (actual time=22304.425..22304.448 rows=254 loops=1)
Planning Time: 0.219 ms
Execution Time: 22352.219 ms
(3 rows)
Attachment
On Thu, Jul 16, 2020 at 09:13:45PM +0530, Vishwa Kalyankar wrote:
> Hi,
>
> I have two machines - one with 8GB RAM & 4core CPU and the other with 64GB
> Ram & 24 core CPU.  Both machines have the same DB (Postgres 12 + Postgis
> 2.5.3).  Same query is taking less time in low end machine whereas more
> time in high end machine.  Any thoughts on where to look?  I have tuned the

When  you say "the same DB" what do you mean ?
Is one a pg_dump and restore of the other ?
Or a physical copy like rsync/tar of the data dir ?

>   Please find the attachment for query explain & analyze and bonnie result
> of  both the machines.

Are the DB settings the ame or how do they differ ?

Maybe you could send explain(analyze,buffers,timing,settings) ?
https://wiki.postgresql.org/wiki/Slow_Query_Questions

--
Justin
Hi Justin,
I tried both the way, pg_dump and rsync of complete data_directory, but the result is same.
Both the db's configurations are not same, I have tuned the db in both machines according to https://pgtune.leopard.in.ua/#/
Below is the result of explain (analyze, buffer, settings) of both the db's.
High End Machine
IPDS_KSEB=# set track_io_timing TO on;
SET
IPDS_KSEB=# explain (analyze,buffers, settings) select * from kseb_geometry_trace_with_barrier_partition(5,'kottarakara_version',437,'htline',2) ;
QUERY PLAN
-------------------------------------------------------------------------------------------------------------------------------------------------------------
----------------------------------------------
Function Scan on kseb_geometry_trace_with_barrier_partition (cost=0.25..10.25 rows=1000 width=169) (actual time=24708.020..24708.048 rows=254 loops=1)
Buffers: shared hit=254235 read=1484
I/O Timings: read=827.509
Settings: effective_cache_size = '30GB', effective_io_concurrency = '2', max_parallel_workers = '24', max_parallel_workers_per_gather = '4', search_path = '
"$user", public, topology', work_mem = '10MB'
Planning Time: 0.064 ms
Execution Time: 24772.587 ms
(6 rows)
Low End Machine
IPDS_KSEB=# explain (analyze,buffers, settings) select * from kseb_geometry_trace_with_barrier_partition(5,'kottarakara_version',437,'htline',2) ;
QUERY PLAN
---------------------------------------------------------------------------------------------------------------------------------------------------------
Function Scan on kseb_geometry_trace_with_barrier_partition (cost=0.25..10.25 rows=1000 width=169) (actual time=21870.311..21870.344 rows=389 loops=1)
Buffers: shared hit=774945
Settings: search_path = '"$user", public, topology'
Planning Time: 0.089 ms
Execution Time: 21870.406 ms
(5 rows)
On Thu, Jul 16, 2020 at 9:34 PM Justin Pryzby <pryzby@telsasoft.com> wrote:
On Thu, Jul 16, 2020 at 09:13:45PM +0530, Vishwa Kalyankar wrote:
> Hi,
>
> I have two machines - one with 8GB RAM & 4core CPU and the other with 64GB
> Ram & 24 core CPU. Both machines have the same DB (Postgres 12 + Postgis
> 2.5.3). Same query is taking less time in low end machine whereas more
> time in high end machine. Any thoughts on where to look? I have tuned the
When you say "the same DB" what do you mean ?
Is one a pg_dump and restore of the other ?
Or a physical copy like rsync/tar of the data dir ?
> Please find the attachment for query explain & analyze and bonnie result
> of both the machines.
Are the DB settings the ame or how do they differ ?
Maybe you could send explain(analyze,buffers,timing,settings) ?
https://wiki.postgresql.org/wiki/Slow_Query_Questions
--
Justin
On Thu, Jul 16, 2020 at 09:13:45PM +0530, Vishwa Kalyankar wrote:
> I have two machines - one with 8GB RAM & 4core CPU and the other with 64GB
> Ram & 24 core CPU.  Both machines have the same DB (Postgres 12 + Postgis

It looks like they're returning different number of rows, so definitely not the
same DB.

Also, they're performing about the same now...

It looks like you didn't set shared_buffers, even for a machine with 64GB RAM.
I think it's unusual to keep the default.

On Thu, Jul 16, 2020 at 10:21:35PM +0530, Vishwa Kalyankar wrote:
> Both the db's configurations are not same, I have tuned the db in both
> machines according to https://pgtune.leopard.in.ua/#/

It looks like your low-end machine has no settings at all ?
Did you forget to restart the server or use SET instead of ALTER SYSTEM SET ?

> IPDS_KSEB=# set track_io_timing TO on;
> IPDS_KSEB=# explain (analyze,buffers, settings) select * from
kseb_geometry_trace_with_barrier_partition(5,'kottarakara_version',437,'htline',2);
>
>  Function Scan on kseb_geometry_trace_with_barrier_partition
>  (cost=0.25..10.25 rows=1000 width=169) (actual time=24708.020..24708.048 rows=254 loops=1)
>    Buffers: shared hit=254235 read=1484
>    I/O Timings: read=827.509
>  Settings: effective_cache_size = '30GB', effective_io_concurrency = '2', max_parallel_workers = '24',
max_parallel_workers_per_gather= '4', search_path = '"$user", public, topology', work_mem = '10MB'

>  Planning Time: 0.064 ms
>  Execution Time: 24772.587 ms
>
> Low End Machine
> IPDS_KSEB=# explain (analyze,buffers, settings) select * from
kseb_geometry_trace_with_barrier_partition(5,'kottarakara_version',437,'htline',2);

>  Function Scan on kseb_geometry_trace_with_barrier_partition  (cost=0.25..10.25 rows=1000 width=169) (actual
time=21870.311..21870.344rows=389 loops=1)

>    Buffers: shared hit=774945
>  Settings: search_path = '"$user", public, topology'
>  Planning Time: 0.089 ms
>  Execution Time: 21870.406 ms
Hi Justin,
I am pasting once again the output of low end server , explain result and shared_buffer size of high end machine.
-bash-4.2$ psql -p 5422
psql (12.3)
Type "help" for help.
postgres=# \c IPDS_KSEB;
You are now connected to database "IPDS_KSEB" as user "postgres".
IPDS_KSEB=# set track_io_timing TO on;
SET
IPDS_KSEB=# explain (analyze,buffers, settings) select * from kseb_geometry_trace_with_barrier_partition(5,'kottarakara_version',437,'htline',2) ;
QUERY PLAN
---------------------------------------------------------------------------------------------------------------------------------------------------------
Function Scan on kseb_geometry_trace_with_barrier_partition (cost=0.25..10.25 rows=1000 width=169) (actual time=22762.767..22762.800 rows=389 loops=1)
Buffers: shared hit=775445 read=2371
I/O Timings: read=1061.060
Settings: search_path = '"$user", public, topology'
Planning Time: 0.091 ms
Execution Time: 22781.896 ms
(6 rows)
#------------------------------------------------------------------------------
# RESOURCE USAGE (except WAL)
#------------------------------------------------------------------------------
# - Memory -
shared_buffers = 10GB # min 128kB
# (change requires restart)
#huge_pages = try # on, off, or try
# (change requires restart)
#temp_buffers = 8MB # min 800kB
#max_prepared_transactions = 0 # zero disables the feature
# (change requires restart)
# Caution: it is not advisable to set max_prepared_transactions nonzero unless
# you actively intend to use prepared transactions.
work_mem = 10MB # min 64kB
maintenance_work_mem = 2GB # min 1MB
#autovacuum_work_mem = -1 # min 1MB, or -1 to use maintenance_work_mem
#max_stack_depth = 2MB # min 100kB
#shared_memory_type = mmap # the default is the first option
# supported by the operating system:
# mmap
# sysv
# windows
# (change requires restart)
dynamic_shared_memory_type = posix # the default is the first option
# supported by the operating system:
# posix
On Thu, Jul 16, 2020 at 10:33 PM Justin Pryzby <pryzby@telsasoft.com> wrote:
On Thu, Jul 16, 2020 at 09:13:45PM +0530, Vishwa Kalyankar wrote:
> I have two machines - one with 8GB RAM & 4core CPU and the other with 64GB
> Ram & 24 core CPU. Both machines have the same DB (Postgres 12 + Postgis
It looks like they're returning different number of rows, so definitely not the
same DB.
Also, they're performing about the same now...
It looks like you didn't set shared_buffers, even for a machine with 64GB RAM.
I think it's unusual to keep the default.
On Thu, Jul 16, 2020 at 10:21:35PM +0530, Vishwa Kalyankar wrote:
> Both the db's configurations are not same, I have tuned the db in both
> machines according to https://pgtune.leopard.in.ua/#/
It looks like your low-end machine has no settings at all ?
Did you forget to restart the server or use SET instead of ALTER SYSTEM SET ?
> IPDS_KSEB=# set track_io_timing TO on;
> IPDS_KSEB=# explain (analyze,buffers, settings) select * from kseb_geometry_trace_with_barrier_partition(5,'kottarakara_version',437,'htline',2);
>
> Function Scan on kseb_geometry_trace_with_barrier_partition
> (cost=0.25..10.25 rows=1000 width=169) (actual time=24708.020..24708.048 rows=254 loops=1)
> Buffers: shared hit=254235 read=1484
> I/O Timings: read=827.509
> Settings: effective_cache_size = '30GB', effective_io_concurrency = '2', max_parallel_workers = '24', max_parallel_workers_per_gather = '4', search_path = '"$user", public, topology', work_mem = '10MB'
> Planning Time: 0.064 ms
> Execution Time: 24772.587 ms
>
> Low End Machine
> IPDS_KSEB=# explain (analyze,buffers, settings) select * from kseb_geometry_trace_with_barrier_partition(5,'kottarakara_version',437,'htline',2) ;
> Function Scan on kseb_geometry_trace_with_barrier_partition (cost=0.25..10.25 rows=1000 width=169) (actual time=21870.311..21870.344 rows=389 loops=1)
> Buffers: shared hit=774945
> Settings: search_path = '"$user", public, topology'
> Planning Time: 0.089 ms
> Execution Time: 21870.406 ms