Hi,
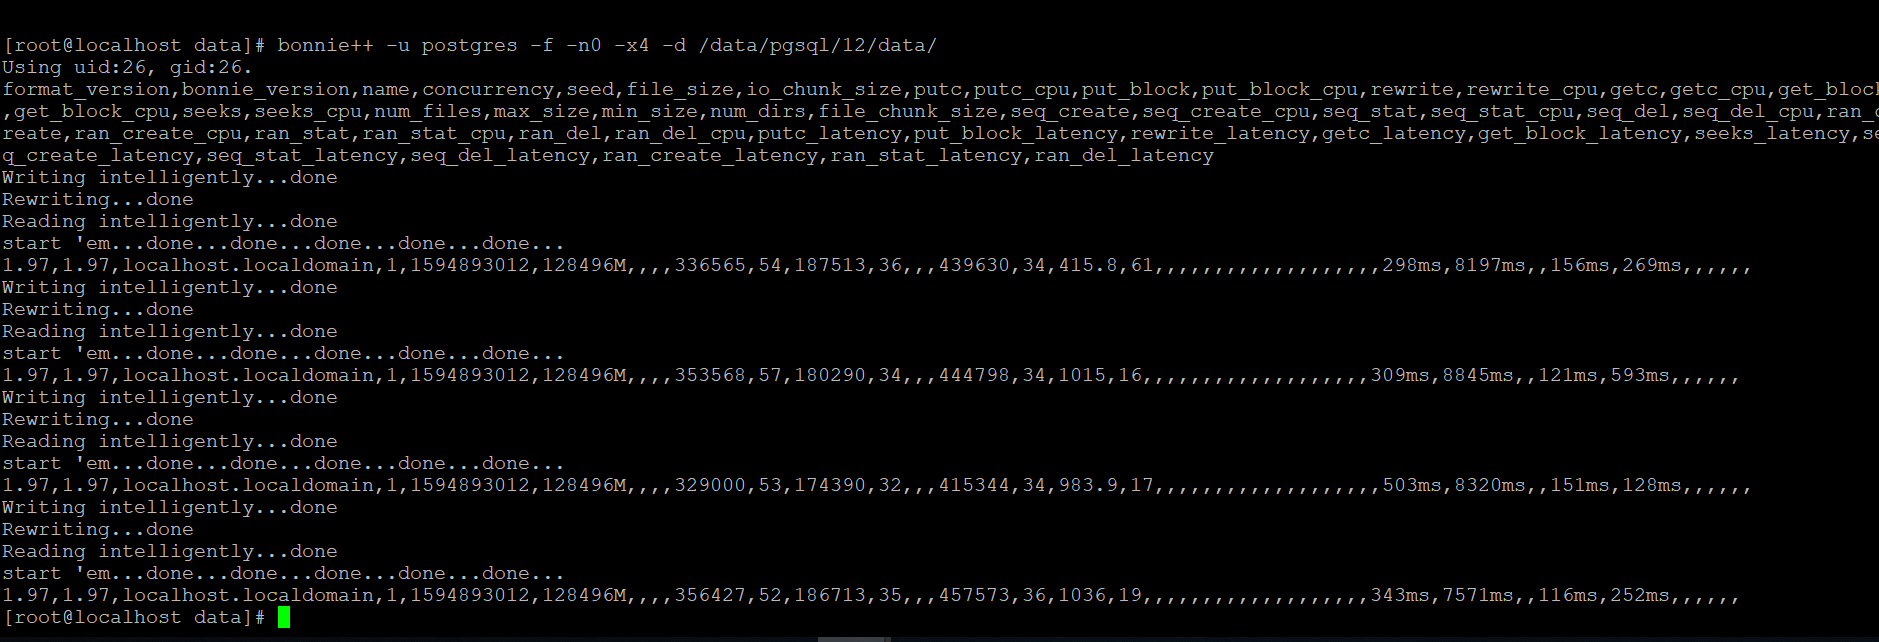
Please find the attachment for query explain & analyze and bonnie result of both the machines.
Low End Machine
-bash-4.2$ psql -p 5434
psql (12.3)
Type "help" for help.
postgres=# \c IPDS_KSEB;
You are now connected to database "IPDS_KSEB" as user "postgres".
IPDS_KSEB=# explain analyze select * from kseb_geometry_trace_with_barrier_partition(5,'kottarakara_version',437,'htline',2) ;
QUERY PLAN
---------------------------------------------------------------------------------------------------------------------------------------------------------
Function Scan on kseb_geometry_trace_with_barrier_partition (cost=0.25..10.25 rows=1000 width=169) (actual time=11626.548..11626.568 rows=254 loops=1)
Planning Time: 0.212 ms
Execution Time: 11628.590 ms
High End Machine
-bash-4.2$ psql -p 5422
psql (12.3)
Type "help" for help.
postgres=# \c IPDS_KSEB;
You are now connected to database "IPDS_KSEB" as user "postgres".
IPDS_KSEB=# explain analyze select * from kseb_geometry_trace_with_barrier_partition(5,'kottarakara_version',437,'htline',2) ;
QUERY PLAN
---------------------------------------------------------------------------------------------------------------------------------------------------------
Function Scan on kseb_geometry_trace_with_barrier_partition (cost=0.25..10.25 rows=1000 width=169) (actual time=22304.425..22304.448 rows=254 loops=1)
Planning Time: 0.219 ms
Execution Time: 22352.219 ms
(3 rows)