Thread: pgsql-performance issue
On 2016-08-20 08:21, pgsql-performance-owner@postgresql.org wrote:
> Welcome to the pgsql-performance mailing list!
> Your password at PostgreSQL Mailing Lists is
>
> x8DiA6
>
> To leave this mailing list, send the following command in the body
> of a message to majordomo@postgresql.org:
>
> approve x8DiA6 unsubscribe pgsql-performance
> debasis.moharana@ipathsolutions.co.in
>
> This command will work even if your address changes.  For that reason,
> among others, it is important that you keep a copy of this message.
>
> To post a message to the mailing list, send it to
>   pgsql-performance@postgresql.org
>
> If you need help or have questions about the mailing list, please
> contact the people who manage the list by sending a message to
>   pgsql-performance-owner@postgresql.org
>
> You can manage your subscription by visiting the following WWW
> location:
>
> <https://lists.postgresql.org/mj/mj_wwwusr/domain=postgresql.org/debasis.moharana%40ipathsolutions.co.in>
Dear Sir/Mam,

I have a PostgreSQL 9.5 instance running on Windows 8 machine with 4GB
of RAM.This server is mainly used for inserting/updating large amounts
of data via copy/insert/update commands, and seldom for running select
queries.

Here are the relevant configuration parameters I changed:

max_connections = 100
shared_buffers = 512MB
effective_cache_size = 3GB
work_mem = 12233kB
maintenance_work_mem = 256MB
min_wal_size = 1GB max_wal_size = 2GB
checkpoint_completion_target = 0.7
wal_buffers = 16MB
default_statistics_target = 100

After setting in postgresql.conf. I run the select query to fetch large
amount of record of 29000 in postgresql but it takes 10.3 seconds but
the same query takes 2 seconds for execution in MSSQL.

So my query is how to improve the perfermance in postgresql.

Regards,
Debasis Moharana
.NET Software Developer
2016-08-20 10:27 GMT+02:00 <debasis.moharana@ipathsolutions.co.in>:
On 2016-08-20 08:21, pgsql-performance-owner@postgresql.org wrote: Welcome to the pgsql-performance mailing list!Dear Sir/Mam,
Your password at PostgreSQL Mailing Lists is
x8DiA6
To leave this mailing list, send the following command in the body
of a message to majordomo@postgresql.org:
approve x8DiA6 unsubscribe pgsql-performance
debasis.moharana@ipathsolutions.co.in
This command will work even if your address changes. For that reason,
among others, it is important that you keep a copy of this message.
To post a message to the mailing list, send it to
pgsql-performance@postgresql.org
If you need help or have questions about the mailing list, please
contact the people who manage the list by sending a message to
pgsql-performance-owner@postgresql.org
You can manage your subscription by visiting the following WWW location:
<https://lists.postgresql.org/mj/mj_wwwusr/domain=postgresql .org/debasis.moharana% 40ipathsolutions.co.in>
I have a PostgreSQL 9.5 instance running on Windows 8 machine with 4GB of RAM.This server is mainly used for inserting/updating large amounts of data via copy/insert/update commands, and seldom for running select queries.
Here are the relevant configuration parameters I changed:
max_connections = 100
shared_buffers = 512MB
effective_cache_size = 3GB
work_mem = 12233kB
maintenance_work_mem = 256MB
min_wal_size = 1GB max_wal_size = 2GB
checkpoint_completion_target = 0.7
wal_buffers = 16MB
default_statistics_target = 100
After setting in postgresql.conf. I run the select query to fetch large amount of record of 29000 in postgresql but it takes 10.3 seconds but the same query takes 2 seconds for execution in MSSQL.
So my query is how to improve the perfermance in postgresql.
hi
please, send execution plan of slow query
https://www.postgresql.org/docs/current/static/sql-explain.html
https://explain.depesz.com/
https://www.postgresql.org/docs/current/static/sql-explain.html
https://explain.depesz.com/
p.s. Did you do VACUUM and ANALYZE on database?
Regards
Pavel
Regards,
Debasis Moharana
.NET Software Developer
--
Sent via pgsql-performance mailing list (pgsql-performance@postgresql.org)
To make changes to your subscription:
http://www.postgresql.org/mailpref/pgsql-performance
On 2016-08-20 08:58, Pavel Stehule wrote:
> 2016-08-20 10:27 GMT+02:00 <debasis.moharana@ipathsolutions.co.in>:
>
>> On 2016-08-20 08:21, pgsql-performance-owner@postgresql.org wrote:
>>
>>> Welcome to the pgsql-performance mailing list!
>>> Your password at PostgreSQL Mailing Lists is
>>>
>>> x8DiA6
>>>
>>> To leave this mailing list, send the following command in the
>>> body
>>> of a message to majordomo@postgresql.org:
>>>
>>> approve x8DiA6 unsubscribe pgsql-performance
>>> debasis.moharana@ipathsolutions.co.in
>>>
>>> This command will work even if your address changes. For that
>>> reason,
>>> among others, it is important that you keep a copy of this
>>> message.
>>>
>>> To post a message to the mailing list, send it to
>>> pgsql-performance@postgresql.org
>>>
>>> If you need help or have questions about the mailing list, please
>>> contact the people who manage the list by sending a message to
>>> pgsql-performance-owner@postgresql.org
>>>
>>> You can manage your subscription by visiting the following WWW
>>> location:
>>>
>>>
>>
> <https://lists.postgresql.org/mj/mj_wwwusr/domain=postgresql.org/debasis.moharana%40ipathsolutions.co.in
>>> [1]>
>> Dear Sir/Mam,
>>
>> I have a PostgreSQL 9.5 instance running on Windows 8 machine with
>> 4GB of RAM.This server is mainly used for inserting/updating large
>> amounts of data via copy/insert/update commands, and seldom for
>> running select queries.
>>
>> Here are the relevant configuration parameters I changed:
>>
>> max_connections = 100
>> shared_buffers = 512MB
>> effective_cache_size = 3GB
>> work_mem = 12233kB
>> maintenance_work_mem = 256MB
>> min_wal_size = 1GB max_wal_size = 2GB
>> checkpoint_completion_target = 0.7
>> wal_buffers = 16MB
>> default_statistics_target = 100
>>
>> After setting in postgresql.conf. I run the select query to fetch
>> large amount of record of 29000 in postgresql but it takes 10.3
>> seconds but the same query takes 2 seconds for execution in MSSQL.
>>
>> So my query is how to improve the perfermance in postgresql.
>
> hi
>
> please, send execution plan of slow query
>
> https://www.postgresql.org/docs/current/static/sql-explain.html [3]
> https://explain.depesz.com/ [4]
>
> p.s. Did you do VACUUM and ANALYZE on database?
>
> Regards
>
> Pavel
>
>> Regards,
>> Debasis Moharana
>> .NET Software Developer
>>
>> --
>> Sent via pgsql-performance mailing list
>> (pgsql-performance@postgresql.org)
>> To make changes to your subscription:
>> http://www.postgresql.org/mailpref/pgsql-performance [2]
>
>
>
> Links:
> ------
> [1]
> https://lists.postgresql.org/mj/mj_wwwusr/domain=postgresql.org/debasis.moharana%40ipathsolutions.co.in
> [2] http://www.postgresql.org/mailpref/pgsql-performance
> [3] https://www.postgresql.org/docs/current/static/sql-explain.html
> [4] https://explain.depesz.com/


Hi,

Please check the execution plan details


Execution Query is = EXPLAIN (ANALYZE, BUFFERS) select * from
tblPurchaseOrderstock cross join tblPurchaseOrderInfo;

"Nested Loop  (cost=0.00..507.51 rows=39593 width=224) (actual
time=0.032..13.026 rows=39593 loops=1)"
"  Buffers: shared read=8"
"  I/O Timings: read=0.058"
"  ->  Seq Scan on tblpurchaseorderstock  (cost=0.00..7.89 rows=289
width=95) (actual time=0.014..0.082 rows=289 loops=1)"
"        Buffers: shared read=5"
"        I/O Timings: read=0.040"
"  ->  Materialize  (cost=0.00..5.05 rows=137 width=129) (actual
time=0.000..0.006 rows=137 loops=289)"
"        Buffers: shared read=3"
"        I/O Timings: read=0.019"
"        ->  Seq Scan on tblpurchaseorderinfo  (cost=0.00..4.37 rows=137
width=129) (actual time=0.011..0.035 rows=137 loops=1)"
"              Buffers: shared read=3"
"              I/O Timings: read=0.019"
"Planning time: 56.052 ms"
"Execution time: 14.038 ms"

Regards,
Debasis Moharana
2016-08-20 13:31 GMT+02:00 <debasis.moharana@ipathsolutions.co.in>:
On 2016-08-20 08:58, Pavel Stehule wrote:2016-08-20 10:27 GMT+02:00 <debasis.moharana@ipathsolutions.co.in>: On 2016-08-20 08:21, pgsql-performance-owner@postgr<https://lists.postgresql.org/esql.org wrote: Welcome to the pgsql-performance mailing list!
Your password at PostgreSQL Mailing Lists is
x8DiA6
To leave this mailing list, send the following command in the
body
of a message to majordomo@postgresql.org:
approve x8DiA6 unsubscribe pgsql-performance
debasis.moharana@ipathsolutions.co.in
This command will work even if your address changes. For that
reason,
among others, it is important that you keep a copy of this
message.
To post a message to the mailing list, send it to
pgsql-performance@postgresql.org
If you need help or have questions about the mailing list, please
contact the people who manage the list by sending a message to
pgsql-performance-owner@postgresql.org
You can manage your subscription by visiting the following WWW
location:mj/mj_wwwusr/domain=postgresql .org/debasis.moharana% 40ipathsolutions.co.in [1]>Dear Sir/Mam,
I have a PostgreSQL 9.5 instance running on Windows 8 machine with
4GB of RAM.This server is mainly used for inserting/updating large
amounts of data via copy/insert/update commands, and seldom for
running select queries.
Here are the relevant configuration parameters I changed:
max_connections = 100
shared_buffers = 512MB
effective_cache_size = 3GB
work_mem = 12233kB
maintenance_work_mem = 256MB
min_wal_size = 1GB max_wal_size = 2GB
checkpoint_completion_target = 0.7
wal_buffers = 16MB
default_statistics_target = 100
After setting in postgresql.conf. I run the select query to fetch
large amount of record of 29000 in postgresql but it takes 10.3
seconds but the same query takes 2 seconds for execution in MSSQL.
So my query is how to improve the perfermance in postgresql.
hi
please, send execution plan of slow query
https://www.postgresql.org/docs/current/static/sql-explain. html [3]
https://explain.depesz.com/ [4]
p.s. Did you do VACUUM and ANALYZE on database?
Regards
PavelRegards,
Debasis Moharana
.NET Software Developer
--
Sent via pgsql-performance mailing list
(pgsql-performance@postgresql.org)
To make changes to your subscription:
http://www.postgresql.org/mailpref/pgsql-performance [2]
Links:
------
[1]
https://lists.postgresql.org/mj/mj_wwwusr/domain=postgresql. org/debasis.moharana% 40ipathsolutions.co.in
[2] http://www.postgresql.org/mailpref/pgsql-performance
[3] https://www.postgresql.org/docs/current/static/sql-explain. html
[4] https://explain.depesz.com/
Hi,
Please check the execution plan details
Execution Query is = EXPLAIN (ANALYZE, BUFFERS) select * from tblPurchaseOrderstock cross join tblPurchaseOrderInfo;
"Nested Loop (cost=0.00..507.51 rows=39593 width=224) (actual time=0.032..13.026 rows=39593 loops=1)"
" Buffers: shared read=8"
" I/O Timings: read=0.058"
" -> Seq Scan on tblpurchaseorderstock (cost=0.00..7.89 rows=289 width=95) (actual time=0.014..0.082 rows=289 loops=1)"
" Buffers: shared read=5"
" I/O Timings: read=0.040"
" -> Materialize (cost=0.00..5.05 rows=137 width=129) (actual time=0.000..0.006 rows=137 loops=289)"
" Buffers: shared read=3"
" I/O Timings: read=0.019"
" -> Seq Scan on tblpurchaseorderinfo (cost=0.00..4.37 rows=137 width=129) (actual time=0.011..0.035 rows=137 loops=1)"
" Buffers: shared read=3"
" I/O Timings: read=0.019"
"Planning time: 56.052 ms"
"Execution time: 14.038 ms"
It is same query? It needs only 14ms
Regards
Pavel
Regards,
Debasis Moharana
On 2016-08-20 11:42, Pavel Stehule wrote:
> 2016-08-20 13:31 GMT+02:00 <debasis.moharana@ipathsolutions.co.in>:
>
>> On 2016-08-20 08:58, Pavel Stehule wrote:
>> 2016-08-20 10:27 GMT+02:00 <debasis.moharana@ipathsolutions.co.in>:
>>
>> On 2016-08-20 08:21, pgsql-performance-owner@postgresql.org wrote:
>>
>> Welcome to the pgsql-performance mailing list!
>> Your password at PostgreSQL Mailing Lists is
>>
>> x8DiA6
>>
>> To leave this mailing list, send the following command in the
>> body
>> of a message to majordomo@postgresql.org:
>>
>> approve x8DiA6 unsubscribe pgsql-performance
>> debasis.moharana@ipathsolutions.co.in
>>
>> This command will work even if your address changes. For that
>> reason,
>> among others, it is important that you keep a copy of this
>> message.
>>
>> To post a message to the mailing list, send it to
>> pgsql-performance@postgresql.org
>>
>> If you need help or have questions about the mailing list, please
>> contact the people who manage the list by sending a message to
>> pgsql-performance-owner@postgresql.org
>>
>> You can manage your subscription by visiting the following WWW
>> location:
>
> <https://lists.postgresql.org/mj/mj_wwwusr/domain=postgresql.org/debasis.moharana%40ipathsolutions.co.in
> [2]
>
>>> [1]>
>> Dear Sir/Mam,
>>
>> I have a PostgreSQL 9.5 instance running on Windows 8 machine with
>> 4GB of RAM.This server is mainly used for inserting/updating large
>> amounts of data via copy/insert/update commands, and seldom for
>> running select queries.
>>
>> Here are the relevant configuration parameters I changed:
>>
>> max_connections = 100
>> shared_buffers = 512MB
>> effective_cache_size = 3GB
>> work_mem = 12233kB
>> maintenance_work_mem = 256MB
>> min_wal_size = 1GB max_wal_size = 2GB
>> checkpoint_completion_target = 0.7
>> wal_buffers = 16MB
>> default_statistics_target = 100
>>
>> After setting in postgresql.conf. I run the select query to fetch
>> large amount of record of 29000 in postgresql but it takes 10.3
>> seconds but the same query takes 2 seconds for execution in MSSQL.
>>
>> So my query is how to improve the perfermance in postgresql.
>
>  hi
>
>  please, send execution plan of slow query
>
>  https://www.postgresql.org/docs/current/static/sql-explain.html [3]
> [3]
>  https://explain.depesz.com/ [4] [4]
>
>  p.s. Did you do VACUUM and ANALYZE on database?
>
>  Regards
>
>  Pavel
>
>> Regards,
>> Debasis Moharana
>> .NET Software Developer
>>
>> --
>> Sent via pgsql-performance mailing list
>> (pgsql-performance@postgresql.org)
>> To make changes to your subscription:
>> http://www.postgresql.org/mailpref/pgsql-performance [1] [2]
>
>  Links:
>  ------
>  [1]
>
> https://lists.postgresql.org/mj/mj_wwwusr/domain=postgresql.org/debasis.moharana%40ipathsolutions.co.in
> [2]
>  [2] http://www.postgresql.org/mailpref/pgsql-performance [1]
>  [3] https://www.postgresql.org/docs/current/static/sql-explain.html
> [3]
>  [4] https://explain.depesz.com/ [4]
>
>  Hi,
>
>  Please check the execution plan details
>
>  Execution Query is = EXPLAIN (ANALYZE, BUFFERS) select * from
> tblPurchaseOrderstock cross join tblPurchaseOrderInfo;
>
>  "Nested Loop  (cost=0.00..507.51 rows=39593 width=224) (actual
> time=0.032..13.026 rows=39593 loops=1)"
>  "  Buffers: shared read=8"
>  "  I/O Timings: read=0.058"
>  "  ->  Seq Scan on tblpurchaseorderstock  (cost=0.00..7.89 rows=289
> width=95) (actual time=0.014..0.082 rows=289 loops=1)"
>  "        Buffers: shared read=5"
>  "        I/O Timings: read=0.040"
>  "  ->  Materialize  (cost=0.00..5.05 rows=137 width=129) (actual
> time=0.000..0.006 rows=137 loops=289)"
>  "        Buffers: shared read=3"
>  "        I/O Timings: read=0.019"
>  "        ->  Seq Scan on tblpurchaseorderinfo  (cost=0.00..4.37
> rows=137 width=129) (actual time=0.011..0.035 rows=137 loops=1)"
>  "              Buffers: shared read=3"
>  "              I/O Timings: read=0.019"
>  "Planning time: 56.052 ms"
>  "Execution time: 14.038 ms"
>
> It is same query? It needs only 14ms
>
> Regards
>
> Pavel
>
>> Regards,
>> Debasis Moharana
>
>
>
> Links:
> ------
> [1] http://www.postgresql.org/mailpref/pgsql-performance
> [2]
> https://lists.postgresql.org/mj/mj_wwwusr/domain=postgresql.org/debasis.moharana%40ipathsolutions.co.in
> [3] https://www.postgresql.org/docs/current/static/sql-explain.html
> [4] https://explain.depesz.com/


Hi,

Yes you right.But it will take more time(10.3 sec.) Plase check the
snap.


Can you please tell me what we need to setup so that it will take the
actual time.

Regards,
Debasis Moharana
Attachment
2016-08-20 13:59 GMT+02:00 <debasis.moharana@ipathsolutions.co.in>:
On 2016-08-20 11:42, Pavel Stehule wrote:[2]2016-08-20 13:31 GMT+02:00 <debasis.moharana@ipathsolutions.co.in>: On 2016-08-20 08:58, Pavel Stehule wrote:
2016-08-20 10:27 GMT+02:00 <debasis.moharana@ipathsolutions.co.in>:
On 2016-08-20 08:21, pgsql-performance-owner@postgresql.org wrote:
Welcome to the pgsql-performance mailing list!
Your password at PostgreSQL Mailing Lists is
x8DiA6
To leave this mailing list, send the following command in the
body
of a message to majordomo@postgresql.org:
approve x8DiA6 unsubscribe pgsql-performance
debasis.moharana@ipathsolutions.co.in
This command will work even if your address changes. For that
reason,
among others, it is important that you keep a copy of this
message.
To post a message to the mailing list, send it to
pgsql-performance@postgresql.org
If you need help or have questions about the mailing list, please
contact the people who manage the list by sending a message to
pgsql-performance-owner@postgresql.org
You can manage your subscription by visiting the following WWW
location:
<https://lists.postgresql.org/mj/mj_wwwusr/domain=postgresql .org/debasis.moharana% 40ipathsolutions.co.in [1]>Dear Sir/Mam,
I have a PostgreSQL 9.5 instance running on Windows 8 machine with
4GB of RAM.This server is mainly used for inserting/updating large
amounts of data via copy/insert/update commands, and seldom for
running select queries.
Here are the relevant configuration parameters I changed:
max_connections = 100
shared_buffers = 512MB
effective_cache_size = 3GB
work_mem = 12233kB
maintenance_work_mem = 256MB
min_wal_size = 1GB max_wal_size = 2GB
checkpoint_completion_target = 0.7
wal_buffers = 16MB
default_statistics_target = 100
After setting in postgresql.conf. I run the select query to fetch
large amount of record of 29000 in postgresql but it takes 10.3
seconds but the same query takes 2 seconds for execution in MSSQL.
So my query is how to improve the perfermance in postgresql.
hi
please, send execution plan of slow query
https://www.postgresql.org/docs/current/static/sql-explain. html [3]
[3]
https://explain.depesz.com/ [4] [4]
p.s. Did you do VACUUM and ANALYZE on database?
Regards
PavelRegards,
Debasis Moharana
.NET Software Developer
--
Sent via pgsql-performance mailing list
(pgsql-performance@postgresql.org)
To make changes to your subscription:
http://www.postgresql.org/mailpref/pgsql-performance [1] [2]
Links:
------
[1]
https://lists.postgresql.org/mj/mj_wwwusr/domain=postgresql. org/debasis.moharana% 40ipathsolutions.co.in
[2]
[2] http://www.postgresql.org/mailpref/pgsql-performance [1]
[3] https://www.postgresql.org/docs/current/static/sql-explain. html
[3]
[4] https://explain.depesz.com/ [4]Links:
Hi,
Please check the execution plan details
Execution Query is = EXPLAIN (ANALYZE, BUFFERS) select * from
tblPurchaseOrderstock cross join tblPurchaseOrderInfo;
"Nested Loop (cost=0.00..507.51 rows=39593 width=224) (actual
time=0.032..13.026 rows=39593 loops=1)"
" Buffers: shared read=8"
" I/O Timings: read=0.058"
" -> Seq Scan on tblpurchaseorderstock (cost=0.00..7.89 rows=289
width=95) (actual time=0.014..0.082 rows=289 loops=1)"
" Buffers: shared read=5"
" I/O Timings: read=0.040"
" -> Materialize (cost=0.00..5.05 rows=137 width=129) (actual
time=0.000..0.006 rows=137 loops=289)"
" Buffers: shared read=3"
" I/O Timings: read=0.019"
" -> Seq Scan on tblpurchaseorderinfo (cost=0.00..4.37
rows=137 width=129) (actual time=0.011..0.035 rows=137 loops=1)"
" Buffers: shared read=3"
" I/O Timings: read=0.019"
"Planning time: 56.052 ms"
"Execution time: 14.038 ms"
It is same query? It needs only 14ms
Regards
PavelRegards,
Debasis Moharana
------
[1] http://www.postgresql.org/mailpref/pgsql-performance
[2]
https://lists.postgresql.org/mj/mj_wwwusr/domain=postgresql. org/debasis.moharana% 40ipathsolutions.co.in
[3] https://www.postgresql.org/docs/current/static/sql-explain. html
[4] https://explain.depesz.com/
Hi,
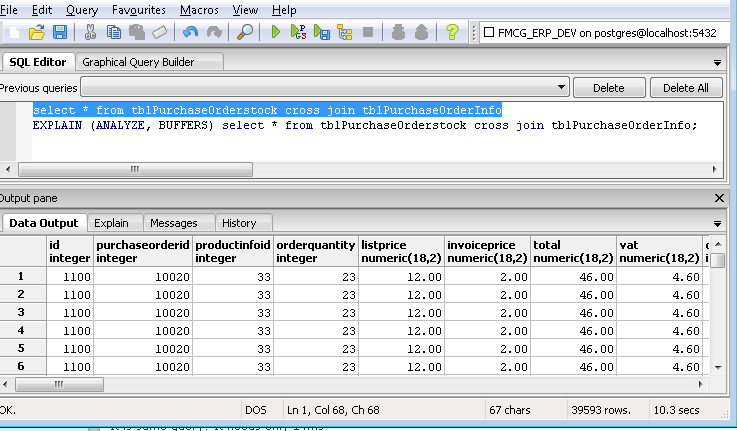
Yes you right.But it will take more time(10.3 sec.) Plase check the snap.
The real time you can see in EXPLAIN ANALYZE ... output. The some strange time what you can see in PgAdmin can be based on
a) PgAdmin issue - pgAdmin is relativly slow client due slow formatting - the time of processing in your application can be pretty better, try to check another client
b) there can be some network issues - the problem is in passing data from server to client
but probably variant is @a - pgAdmin is not good for benchmarking - use "psql" console instead.
Pavel
Can you please tell me what we need to setup so that it will take the actual time.
Regards,
Debasis Moharana
On 2016-08-20 12:05, Pavel Stehule wrote:
> 2016-08-20 13:59 GMT+02:00 <debasis.moharana@ipathsolutions.co.in>:
>
>> On 2016-08-20 11:42, Pavel Stehule wrote:
>>
>> 2016-08-20 13:31 GMT+02:00 <debasis.moharana@ipathsolutions.co.in>:
>>
>> On 2016-08-20 08:58, Pavel Stehule wrote:
>> 2016-08-20 10:27 GMT+02:00 <debasis.moharana@ipathsolutions.co.in>:
>>
>> On 2016-08-20 08:21, pgsql-performance-owner@postgresql.org wrote:
>>
>> Welcome to the pgsql-performance mailing list!
>> Your password at PostgreSQL Mailing Lists is
>>
>> x8DiA6
>>
>> To leave this mailing list, send the following command in the
>> body
>> of a message to majordomo@postgresql.org:
>>
>> approve x8DiA6 unsubscribe pgsql-performance
>> debasis.moharana@ipathsolutions.co.in
>>
>> This command will work even if your address changes. For that
>> reason,
>> among others, it is important that you keep a copy of this
>> message.
>>
>> To post a message to the mailing list, send it to
>> pgsql-performance@postgresql.org
>>
>> If you need help or have questions about the mailing list, please
>> contact the people who manage the list by sending a message to
>> pgsql-performance-owner@postgresql.org
>>
>> You can manage your subscription by visiting the following WWW
>> location:
>>
>>
> <https://lists.postgresql.org/mj/mj_wwwusr/domain=postgresql.org/debasis.moharana%40ipathsolutions.co.in
>> [1]
>> [2]
>>
>> [1]>
>> Dear Sir/Mam,
>>
>> I have a PostgreSQL 9.5 instance running on Windows 8 machine with
>> 4GB of RAM.This server is mainly used for inserting/updating large
>> amounts of data via copy/insert/update commands, and seldom for
>> running select queries.
>>
>> Here are the relevant configuration parameters I changed:
>>
>> max_connections = 100
>> shared_buffers = 512MB
>> effective_cache_size = 3GB
>> work_mem = 12233kB
>> maintenance_work_mem = 256MB
>> min_wal_size = 1GB max_wal_size = 2GB
>> checkpoint_completion_target = 0.7
>> wal_buffers = 16MB
>> default_statistics_target = 100
>>
>> After setting in postgresql.conf. I run the select query to fetch
>> large amount of record of 29000 in postgresql but it takes 10.3
>> seconds but the same query takes 2 seconds for execution in MSSQL.
>>
>> So my query is how to improve the perfermance in postgresql.
>
>   hi
>
>   please, send execution plan of slow query
>
>   https://www.postgresql.org/docs/current/static/sql-explain.html [3]
> [3]
>  [3]
>   https://explain.depesz.com/ [4] [4] [4]
>
>   p.s. Did you do VACUUM and ANALYZE on database?
>
>   Regards
>
>   Pavel
>
>> Regards,
>> Debasis Moharana
>> .NET Software Developer
>>
>> --
>> Sent via pgsql-performance mailing list
>> (pgsql-performance@postgresql.org)
>> To make changes to your subscription:
>> http://www.postgresql.org/mailpref/pgsql-performance [2] [1] [2]
>
>   Links:
>   ------
>   [1]
>
>
> https://lists.postgresql.org/mj/mj_wwwusr/domain=postgresql.org/debasis.moharana%40ipathsolutions.co.in
> [1]
>  [2]
>   [2] http://www.postgresql.org/mailpref/pgsql-performance [2] [1]
>   [3] https://www.postgresql.org/docs/current/static/sql-explain.html
> [3]
>  [3]
>   [4] https://explain.depesz.com/ [4] [4]
>
>   Hi,
>
>   Please check the execution plan details
>
>   Execution Query is = EXPLAIN (ANALYZE, BUFFERS) select * from
>  tblPurchaseOrderstock cross join tblPurchaseOrderInfo;
>
>   "Nested Loop  (cost=0.00..507.51 rows=39593 width=224) (actual
>  time=0.032..13.026 rows=39593 loops=1)"
>   "  Buffers: shared read=8"
>   "  I/O Timings: read=0.058"
>   "  ->  Seq Scan on tblpurchaseorderstock  (cost=0.00..7.89 rows=289
>  width=95) (actual time=0.014..0.082 rows=289 loops=1)"
>   "        Buffers: shared read=5"
>   "        I/O Timings: read=0.040"
>   "  ->  Materialize  (cost=0.00..5.05 rows=137 width=129) (actual
>  time=0.000..0.006 rows=137 loops=289)"
>   "        Buffers: shared read=3"
>   "        I/O Timings: read=0.019"
>   "        ->  Seq Scan on tblpurchaseorderinfo  (cost=0.00..4.37
>  rows=137 width=129) (actual time=0.011..0.035 rows=137 loops=1)"
>   "              Buffers: shared read=3"
>   "              I/O Timings: read=0.019"
>   "Planning time: 56.052 ms"
>   "Execution time: 14.038 ms"
>
>  It is same query? It needs only 14ms
>
>  Regards
>
>  Pavel
>
>> Regards,
>> Debasis Moharana
>
>  Links:
>  ------
>  [1] http://www.postgresql.org/mailpref/pgsql-performance [2]
>  [2]
>
> https://lists.postgresql.org/mj/mj_wwwusr/domain=postgresql.org/debasis.moharana%40ipathsolutions.co.in
> [1]
>  [3] https://www.postgresql.org/docs/current/static/sql-explain.html
> [3]
>  [4] https://explain.depesz.com/ [4]
>
>  Hi,
>
>  Yes you right.But it will take more time(10.3 sec.) Plase check the
> snap.
>
> The real time you can see in EXPLAIN ANALYZE ... output. The some
> strange time what you can see in PgAdmin can be based on
>
> a) PgAdmin issue - pgAdmin is relativly slow client due slow
> formatting - the time of processing in your application can be pretty
> better, try to check another client
>
> b) there can be some network issues - the problem is in passing data
> from server to client
>
> but probably variant is @a - pgAdmin is not good for benchmarking -
> use "psql" console instead.
>
> Pavel
>
>> Can you please tell me what we need to setup so that it will take
>> the actual time.
>>
>> Regards,
>> Debasis Moharana
>
>
>
> Links:
> ------
> [1]
> https://lists.postgresql.org/mj/mj_wwwusr/domain=postgresql.org/debasis.moharana%40ipathsolutions.co.in
> [2] http://www.postgresql.org/mailpref/pgsql-performance
> [3] https://www.postgresql.org/docs/current/static/sql-explain.html
> [4] https://explain.depesz.com/


Hi,

Actually i am fresher on this.So want to connect my application with
postgresql instead of MSSQL.

If we are using psql console for executing the query then it will faster
according to you.
But what is the other option to use instead of pgadmin.

Can you give me some link for reference.

Regards,
Debasis Moharana
2016-08-20 14:17 GMT+02:00 <debasis.moharana@ipathsolutions.co.in>:
https://wiki.postgresql.org/wiki/Community_Guide_to_PostgreSQL_GUI_Tools
http://www.sqlmanager.net/en/products/postgresql/manager
On 2016-08-20 12:05, Pavel Stehule wrote:2016-08-20 13:59 GMT+02:00 <debasis.moharana@ipathsolutions.co.in>: On 2016-08-20 11:42, Pavel Stehule wrote:<https://lists.postgresql.org/
2016-08-20 13:31 GMT+02:00 <debasis.moharana@ipathsolutions.co.in>:
On 2016-08-20 08:58, Pavel Stehule wrote:
2016-08-20 10:27 GMT+02:00 <debasis.moharana@ipathsolutions.co.in>:
On 2016-08-20 08:21, pgsql-performance-owner@postgresql.org wrote:
Welcome to the pgsql-performance mailing list!
Your password at PostgreSQL Mailing Lists is
x8DiA6
To leave this mailing list, send the following command in the
body
of a message to majordomo@postgresql.org:
approve x8DiA6 unsubscribe pgsql-performance
debasis.moharana@ipathsolutions.co.in
This command will work even if your address changes. For that
reason,
among others, it is important that you keep a copy of this
message.
To post a message to the mailing list, send it to
pgsql-performance@postgresql.org
If you need help or have questions about the mailing list, please
contact the people who manage the list by sending a message to
pgsql-performance-owner@postgresql.org
You can manage your subscription by visiting the following WWW
location:mj/mj_wwwusr/domain=postgresql .org/debasis.moharana% 40ipathsolutions.co.in [1]
[2]
[1]>
Dear Sir/Mam,
I have a PostgreSQL 9.5 instance running on Windows 8 machine with
4GB of RAM.This server is mainly used for inserting/updating large
amounts of data via copy/insert/update commands, and seldom for
running select queries.
Here are the relevant configuration parameters I changed:
max_connections = 100
shared_buffers = 512MB
effective_cache_size = 3GB
work_mem = 12233kB
maintenance_work_mem = 256MB
min_wal_size = 1GB max_wal_size = 2GB
checkpoint_completion_target = 0.7
wal_buffers = 16MB
default_statistics_target = 100
After setting in postgresql.conf. I run the select query to fetch
large amount of record of 29000 in postgresql but it takes 10.3
seconds but the same query takes 2 seconds for execution in MSSQL.
So my query is how to improve the perfermance in postgresql.https://explain.depesz.com/ [4] [4] [4]
hi
please, send execution plan of slow query
https://www.postgresql.org/docs/current/static/sql-explain. html [3]
[3]
[3]
p.s. Did you do VACUUM and ANALYZE on database?
Regards
PavelRegards,
Debasis Moharana
.NET Software Developer
--
Sent via pgsql-performance mailing list
(pgsql-performance@postgresql.org)
To make changes to your subscription:
http://www.postgresql.org/mailpref/pgsql-performance [2] [1] [2]
Links:
------
[1]
https://lists.postgresql.org/mj/mj_wwwusr/domain=postgresql. org/debasis.moharana% 40ipathsolutions.co.in
[1]
[2]
[2] http://www.postgresql.org/mailpref/pgsql-performance [2] [1]
[3] https://www.postgresql.org/docs/current/static/sql-explain. html
[3]
[3]
[4] https://explain.depesz.com/ [4] [4][2]
Hi,
Please check the execution plan details
Execution Query is = EXPLAIN (ANALYZE, BUFFERS) select * from
tblPurchaseOrderstock cross join tblPurchaseOrderInfo;
"Nested Loop (cost=0.00..507.51 rows=39593 width=224) (actual
time=0.032..13.026 rows=39593 loops=1)"
" Buffers: shared read=8"
" I/O Timings: read=0.058"
" -> Seq Scan on tblpurchaseorderstock (cost=0.00..7.89 rows=289
width=95) (actual time=0.014..0.082 rows=289 loops=1)"
" Buffers: shared read=5"
" I/O Timings: read=0.040"
" -> Materialize (cost=0.00..5.05 rows=137 width=129) (actual
time=0.000..0.006 rows=137 loops=289)"
" Buffers: shared read=3"
" I/O Timings: read=0.019"
" -> Seq Scan on tblpurchaseorderinfo (cost=0.00..4.37
rows=137 width=129) (actual time=0.011..0.035 rows=137 loops=1)"
" Buffers: shared read=3"
" I/O Timings: read=0.019"
"Planning time: 56.052 ms"
"Execution time: 14.038 ms"
It is same query? It needs only 14ms
Regards
PavelRegards,
Debasis Moharana
Links:
------
[1] http://www.postgresql.org/mailpref/pgsql-performance [2]
https://lists.postgresql.org/mj/mj_wwwusr/domain=postgresql. org/debasis.moharana% 40ipathsolutions.co.in
[1]
[3] https://www.postgresql.org/docs/current/static/sql-explain. html
[3]
[4] https://explain.depesz.com/ [4]
Hi,
Yes you right.But it will take more time(10.3 sec.) Plase check the
snap.
The real time you can see in EXPLAIN ANALYZE ... output. The some
strange time what you can see in PgAdmin can be based on
a) PgAdmin issue - pgAdmin is relativly slow client due slow
formatting - the time of processing in your application can be pretty
better, try to check another client
b) there can be some network issues - the problem is in passing data
from server to client
but probably variant is @a - pgAdmin is not good for benchmarking -
use "psql" console instead.
PavelCan you please tell me what we need to setup so that it will take
the actual time.
Regards,
Debasis Moharana
Links:
------
[1]
https://lists.postgresql.org/mj/mj_wwwusr/domain=postgresql. org/debasis.moharana% 40ipathsolutions.co.in
[2] http://www.postgresql.org/mailpref/pgsql-performance
[3] https://www.postgresql.org/docs/current/static/sql-explain. html
[4] https://explain.depesz.com/
Hi,
Actually i am fresher on this.So want to connect my application with postgresql instead of MSSQL.
If we are using psql console for executing the query then it will faster according to you.
But what is the other option to use instead of pgadmin.
Can you give me some link for reference.
https://wiki.postgresql.org/wiki/Community_Guide_to_PostgreSQL_GUI_Tools
http://www.sqlmanager.net/en/products/postgresql/manager
Regards
Pavel
Regards,
Debasis Moharana
On 2016-08-20 12:19, Pavel Stehule wrote:
> 2016-08-20 14:17 GMT+02:00 <debasis.moharana@ipathsolutions.co.in>:
>
>> On 2016-08-20 12:05, Pavel Stehule wrote:
>>
>> 2016-08-20 13:59 GMT+02:00 <debasis.moharana@ipathsolutions.co.in>:
>>
>> On 2016-08-20 11:42, Pavel Stehule wrote:
>>
>> 2016-08-20 13:31 GMT+02:00 <debasis.moharana@ipathsolutions.co.in>:
>>
>> On 2016-08-20 08:58, Pavel Stehule wrote:
>> 2016-08-20 10:27 GMT+02:00 <debasis.moharana@ipathsolutions.co.in>:
>>
>> On 2016-08-20 08:21, pgsql-performance-owner@postgresql.org wrote:
>>
>> Welcome to the pgsql-performance mailing list!
>> Your password at PostgreSQL Mailing Lists is
>>
>> x8DiA6
>>
>> To leave this mailing list, send the following command in the
>> body
>> of a message to majordomo@postgresql.org:
>>
>> approve x8DiA6 unsubscribe pgsql-performance
>> debasis.moharana@ipathsolutions.co.in
>>
>> This command will work even if your address changes. For that
>> reason,
>> among others, it is important that you keep a copy of this
>> message.
>>
>> To post a message to the mailing list, send it to
>> pgsql-performance@postgresql.org
>>
>> If you need help or have questions about the mailing list, please
>> contact the people who manage the list by sending a message to
>> pgsql-performance-owner@postgresql.org
>>
>> You can manage your subscription by visiting the following WWW
>> location:
>>
>>
> <https://lists.postgresql.org/mj/mj_wwwusr/domain=postgresql.org/debasis.moharana%40ipathsolutions.co.in
>> [1]
>> [1]
>>
>> [2]
>>
>> [1]>
>> Dear Sir/Mam,
>>
>> I have a PostgreSQL 9.5 instance running on Windows 8 machine with
>> 4GB of RAM.This server is mainly used for inserting/updating large
>> amounts of data via copy/insert/update commands, and seldom for
>> running select queries.
>>
>> Here are the relevant configuration parameters I changed:
>>
>> max_connections = 100
>> shared_buffers = 512MB
>> effective_cache_size = 3GB
>> work_mem = 12233kB
>> maintenance_work_mem = 256MB
>> min_wal_size = 1GB max_wal_size = 2GB
>> checkpoint_completion_target = 0.7
>> wal_buffers = 16MB
>> default_statistics_target = 100
>>
>> After setting in postgresql.conf. I run the select query to fetch
>> large amount of record of 29000 in postgresql but it takes 10.3
>> seconds but the same query takes 2 seconds for execution in MSSQL.
>>
>> So my query is how to improve the perfermance in postgresql.
>>
>> hi
>>
>> please, send execution plan of slow query
>>
>> https://www.postgresql.org/docs/current/static/sql-explain.html
>> [2] [3]
>> [3]
>> [3]
>> https://explain.depesz.com/ [3] [4] [4] [4]
>>
>> p.s. Did you do VACUUM and ANALYZE on database?
>>
>> Regards
>>
>> Pavel
>>
>> Regards,
>> Debasis Moharana
>> .NET Software Developer
>>
>> --
>> Sent via pgsql-performance mailing list
>> (pgsql-performance@postgresql.org)
>> To make changes to your subscription:
>> http://www.postgresql.org/mailpref/pgsql-performance [4] [2] [1]
>> [2]
>>
>> Links:
>> ------
>> [1]
>>
>>
> https://lists.postgresql.org/mj/mj_wwwusr/domain=postgresql.org/debasis.moharana%40ipathsolutions.co.in
>> [1]
>> [1]
>> [2]
>> [2] http://www.postgresql.org/mailpref/pgsql-performance [4] [2]
>> [1]
>> [3]
>> https://www.postgresql.org/docs/current/static/sql-explain.html [2]
>> [3]
>> [3]
>> [4] https://explain.depesz.com/ [3] [4] [4]
>>
>> Hi,
>>
>> Please check the execution plan details
>>
>> Execution Query is = EXPLAIN (ANALYZE, BUFFERS) select * from
>> tblPurchaseOrderstock cross join tblPurchaseOrderInfo;
>>
>> "Nested Loop (cost=0.00..507.51 rows=39593 width=224) (actual
>> time=0.032..13.026 rows=39593 loops=1)"
>> " Buffers: shared read=8"
>> " I/O Timings: read=0.058"
>> " -> Seq Scan on tblpurchaseorderstock (cost=0.00..7.89
>> rows=289
>> width=95) (actual time=0.014..0.082 rows=289 loops=1)"
>> " Buffers: shared read=5"
>> " I/O Timings: read=0.040"
>> " -> Materialize (cost=0.00..5.05 rows=137 width=129) (actual
>> time=0.000..0.006 rows=137 loops=289)"
>> " Buffers: shared read=3"
>> " I/O Timings: read=0.019"
>> " -> Seq Scan on tblpurchaseorderinfo (cost=0.00..4.37
>> rows=137 width=129) (actual time=0.011..0.035 rows=137 loops=1)"
>> " Buffers: shared read=3"
>> " I/O Timings: read=0.019"
>> "Planning time: 56.052 ms"
>> "Execution time: 14.038 ms"
>>
>> It is same query? It needs only 14ms
>>
>> Regards
>>
>> Pavel
>>
>> Regards,
>> Debasis Moharana
>>
>> Links:
>> ------
>> [1] http://www.postgresql.org/mailpref/pgsql-performance [4] [2]
>> [2]
>>
>>
> https://lists.postgresql.org/mj/mj_wwwusr/domain=postgresql.org/debasis.moharana%40ipathsolutions.co.in
>> [1]
>> [1]
>> [3]
>> https://www.postgresql.org/docs/current/static/sql-explain.html [2]
>> [3]
>> [4] https://explain.depesz.com/ [3] [4]
>>
>> Hi,
>>
>> Yes you right.But it will take more time(10.3 sec.) Plase check
>> the
>> snap.
>>
>> The real time you can see in EXPLAIN ANALYZE ... output. The some
>> strange time what you can see in PgAdmin can be based on
>>
>> a) PgAdmin issue - pgAdmin is relativly slow client due slow
>> formatting - the time of processing in your application can be
>> pretty
>> better, try to check another client
>>
>> b) there can be some network issues - the problem is in passing
>> data
>> from server to client
>>
>> but probably variant is @a - pgAdmin is not good for benchmarking -
>> use "psql" console instead.
>>
>> Pavel
>>
>> Can you please tell me what we need to setup so that it will take
>> the actual time.
>>
>> Regards,
>> Debasis Moharana
>>
>> Links:
>> ------
>> [1]
>>
> https://lists.postgresql.org/mj/mj_wwwusr/domain=postgresql.org/debasis.moharana%40ipathsolutions.co.in
>> [1]
>> [2] http://www.postgresql.org/mailpref/pgsql-performance [4]
>> [3] https://www.postgresql.org/docs/current/static/sql-explain.html
>> [2]
>> [4] https://explain.depesz.com/ [3]
>
>  Hi,
>
>  Actually i am fresher on this.So want to connect my application with
> postgresql instead of MSSQL.
>
>  If we are using psql console for executing the query then it will
> faster according to you.
>  But what is the other option to use instead of pgadmin.
>
>  Can you give me some link for reference.
>
>
> https://wiki.postgresql.org/wiki/Community_Guide_to_PostgreSQL_GUI_Tools
> [5]
> http://www.sqlmanager.net/en/products/postgresql/manager [6]
>
> Regards
>
> Pavel
>
>> Regards,
>> Debasis Moharana
>
>
>
> Links:
> ------
> [1]
> https://lists.postgresql.org/mj/mj_wwwusr/domain=postgresql.org/debasis.moharana%40ipathsolutions.co.in
> [2] https://www.postgresql.org/docs/current/static/sql-explain.html
> [3] https://explain.depesz.com/
> [4] http://www.postgresql.org/mailpref/pgsql-performance
> [5]
> https://wiki.postgresql.org/wiki/Community_Guide_to_PostgreSQL_GUI_Tools
> [6] http://www.sqlmanager.net/en/products/postgresql/manager


Hi,


Thanks a lot. its now faster execution of query.Let me check all the
things in postgresql.If i have any further query then i will get back to
you.
Regards,
Debasis Moharana