Hello,
i have a problem with my postgres server. There is a DB with approx 30
GB. the traffic per day is between 20-50 GB on the outgoing interface.
one client has ~ 20 IDLE connections. i have sniffer this connections
with nfdump and get this traffic
2016-11-29 12:05:56.165 5854.304 TCP xxx.xxx.xx.25:5432 ->
xxx.xxx.xx.178:35902 16398 74.8 M 20
2016-11-29 12:06:08.450 5826.815 TCP xxx.xxx.xx.25:5432 ->
xxx.xxx.xx.178:56307 15414 68.5 M 20
2016-11-29 12:06:14.771 5630.078 TCP xxx.xxx.xx.25:5432 ->
xxx.xxx.xx.178:40468 13967 61.6 M 21
2016-11-29 12:11:04.971 5528.725 TCP xxx.xxx.xx.25:5432 ->
xxx.xxx.xx.178:56269 13767 59.9 M 19
2016-11-29 12:07:07.203 5791.580 TCP xxx.xxx.xx.25:5432 ->
xxx.xxx.xx.178:46606 14728 59.4 M 22
2016-11-29 12:11:03.595 5497.724 TCP xxx.xxx.xx.25:5432 ->
xxx.xxx.xx.178:40463 12551 54.3 M 20
2016-11-29 12:05:26.932 5651.347 TCP xxx.xxx.xx.25:5432 ->
xxx.xxx.xx.178:48122 13068 52.5 M 22
2016-11-29 12:08:39.283 5611.296 TCP xxx.xxx.xx.25:5432 ->
xxx.xxx.xx.178:40470 12811 52.0 M 19
2016-11-29 12:10:09.644 5560.621 TCP xxx.xxx.xx.25:5432 ->
xxx.xxx.xx.178:59706 12782 48.3 M 20
2016-11-29 12:09:57.819 5569.701 TCP xxx.xxx.xx.25:5432 ->
xxx.xxx.xx.178:59710 12670 47.9 M 21
2016-11-29 12:11:04.933 5433.838 TCP xxx.xxx.xx.25:5432 ->
xxx.xxx.xx.178:56308 12801 47.7 M 20
2016-11-29 12:06:01.908 5799.515 TCP xxx.xxx.xx.25:5432 ->
xxx.xxx.xx.178:40467 11833 46.8 M 25
2016-11-29 12:11:02.652 5334.349 TCP xxx.xxx.xx.25:5432 ->
xxx.xxx.xx.178:59635 10878 43.5 M 20
2016-11-29 12:08:12.557 5772.403 TCP xxx.xxx.xx.25:5432 ->
xxx.xxx.xx.178:40477 10626 40.6 M 22
2016-11-29 12:10:40.379 5566.667 TCP xxx.xxx.xx.25:5432 ->
xxx.xxx.xx.178:59646 10347 40.2 M 21
2016-11-29 12:06:48.133 5852.796 TCP xxx.xxx.xx.25:5432 ->
xxx.xxx.xx.178:59645 10328 30.9 M 21
My question is. what does send so much traffic on an idle connection
within an hour?
Is there a way to to monitor the traffic in postgres? or to see what is
done on the idle connection?
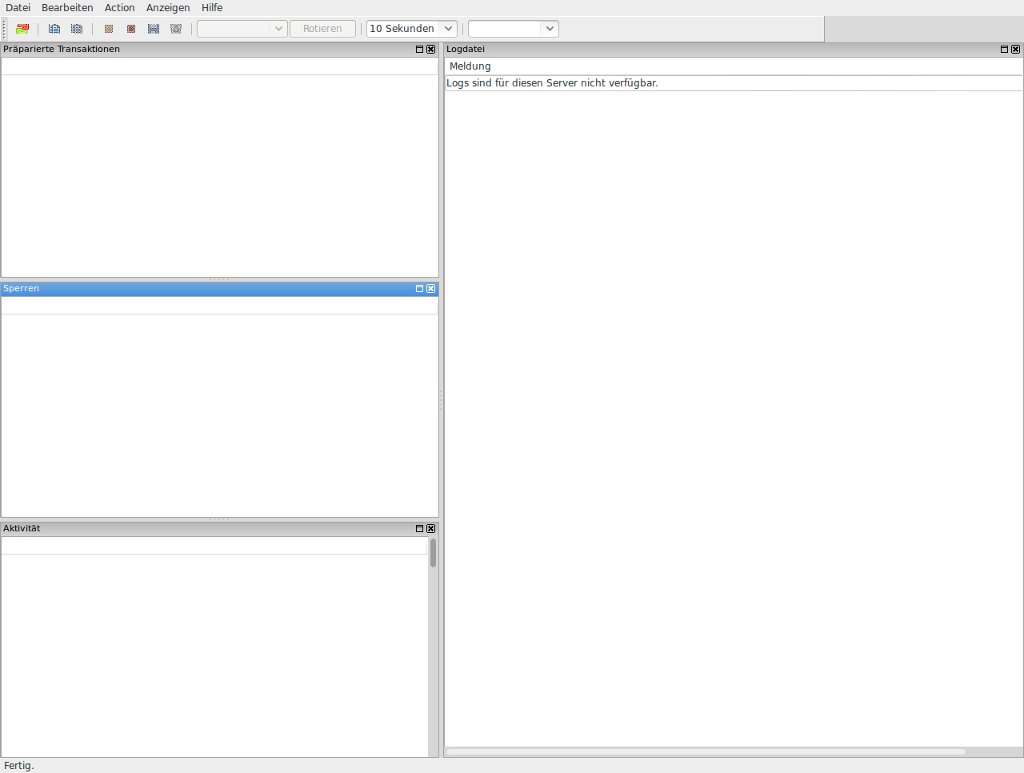
The other problem is that i see nothing in the pgAdmin Server-Status
(see attachment)
Server is 9.1
pgadmin is 1.22.1
best regards