Thread: Postgresql 14 performance
Attachment
Hello Kenny,

have you tried to correlate with the system load for example?

also, it is normal to have variations,
although big variations under the same circumstances might indicate
another problem on the system (somewhere in your hw/sw stack)

--

a quick look at the query + plan:

..WHERE "Extent1"."DdoId" = 1506074 OR "Extent1"."DdoId" IS NULL AND
1506074 IS NULL LIMIT 1;

1506074 IS NULL is always false (generated query?)

(never executed lines, ERP_WORK_ORDER_DDO_INFO does not seem to a
regular table, hence the query plan, (there a few highlighting
tools/sites for the query plan you could also check))

mvg,
Wim

Kenny Bachman schreef op zo 21-08-2022 om 19:05 [+0300]:
> Hi Team,
>
> Have a lovely Sunday.
> I have a problem with PostgreSQL performance. I am using PostgreSQL
> 14.5 on Linux physical server. My query was taking 1 or 2 seconds
> yesterday, but today it is taking 5-6 seconds. Also, nothing has
> changed in the database. Also, when I run the query for the second
> time, the query runs for the same time, so I expect it to be more
> performant the second time because of the cache.
> (the database cache hit ratio is 97,8)
>
> Lastly, some other queries take milliseconds normally, but sometimes
> they take minutes. I didn't understand why this is happening. (There
> is no lock, no table bloating and up to date analyze)
>
>
> I am adding the explain analyze output as an attachment.
Hello Kenny,
have you tried to correlate with the system load for example?
also, it is normal to have variations,
although big variations under the same circumstances might indicate
another problem on the system (somewhere in your hw/sw stack)
--
a quick look at the query + plan:
..WHERE "Extent1"."DdoId" = 1506074 OR "Extent1"."DdoId" IS NULL AND
1506074 IS NULL LIMIT 1;
1506074 IS NULL is always false (generated query?)
(never executed lines, ERP_WORK_ORDER_DDO_INFO does not seem to a
regular table, hence the query plan, (there a few highlighting
tools/sites for the query plan you could also check))
mvg,
Wim
Kenny Bachman schreef op zo 21-08-2022 om 19:05 [+0300]:
> Hi Team,
>
> Have a lovely Sunday.
> I have a problem with PostgreSQL performance. I am using PostgreSQL
> 14.5 on Linux physical server. My query was taking 1 or 2 seconds
> yesterday, but today it is taking 5-6 seconds. Also, nothing has
> changed in the database. Also, when I run the query for the second
> time, the query runs for the same time, so I expect it to be more
> performant the second time because of the cache.
> (the database cache hit ratio is 97,8)
>
> Lastly, some other queries take milliseconds normally, but sometimes
> they take minutes. I didn't understand why this is happening. (There
> is no lock, no table bloating and up to date analyze)
>
>
> I am adding the explain analyze output as an attachment.
Hi Team,Have a lovely Sunday.I have a problem with PostgreSQL performance. I am using PostgreSQL 14.5 on Linux physical server. My query was taking 1 or 2 seconds yesterday, but today it is taking 5-6 seconds. Also, nothing has changed in the database. Also, when I run the query for the second time, the query runs for the same time, so I expect it to be more performant the second time because of the cache.(the database cache hit ratio is 97,8)Lastly, some other queries take milliseconds normally, but sometimes they take minutes. I didn't understand why this is happening. (There is no lock, no table bloating and up to date analyze)I am adding the explain analyze output as an attachment.
Hi Kenny,
The query is small but the plan is huge and likely to use a lot of memory. What is with the rest of the system? Any paging? There are lots of steps that are never executed in the plan. The plan looks great, mostly unique index equality scans. Did you check pg_stat_activity for wait_event_type and wait_event? What is your SQL waiting for?
Regards
--
Mladen Gogala
Database Consultant
Tel: (347) 321-1217
https://dbwhisperer.wordpress.com
Mem: 251 6 1 24 243 220
On 8/21/22 12:05, Kenny Bachman wrote:Hi Team,Have a lovely Sunday.I have a problem with PostgreSQL performance. I am using PostgreSQL 14.5 on Linux physical server. My query was taking 1 or 2 seconds yesterday, but today it is taking 5-6 seconds. Also, nothing has changed in the database. Also, when I run the query for the second time, the query runs for the same time, so I expect it to be more performant the second time because of the cache.(the database cache hit ratio is 97,8)Lastly, some other queries take milliseconds normally, but sometimes they take minutes. I didn't understand why this is happening. (There is no lock, no table bloating and up to date analyze)I am adding the explain analyze output as an attachment.Hi Kenny,
The query is small but the plan is huge and likely to use a lot of memory. What is with the rest of the system? Any paging? There are lots of steps that are never executed in the plan. The plan looks great, mostly unique index equality scans. Did you check pg_stat_activity for wait_event_type and wait_event? What is your SQL waiting for?
Regards
--
Mladen Gogala
Database Consultant
Tel: (347) 321-1217
https://dbwhisperer.wordpress.com
> On Aug 21, 2022, at 12:55 PM, Kenny Bachman <kenny.bachman17@gmail.com> wrote:
>
> How can we explain the cache doesn't work as expected? I mean, I expect more performant the second or third time
runningbecause of the cache. However, every time I run it I get the same exec time value.

Take a look at system paging activity, and at pg IO waits. (For the latter, I think you have to enable tracking in
postgresql.conf.)Also take a peek at CPU usage--if cache is doing what you expect here, then CPU should go to 100% on
oneor more cores.
Hi Team,Have a lovely Sunday.I have a problem with PostgreSQL performance. I am using PostgreSQL 14.5 on Linux physical server. My query was taking 1 or 2 seconds yesterday, but today it is taking 5-6 seconds. Also, nothing has changed in the database.
Also, when I run the query for the second time, the query runs for the same time, so I expect it to be more performant the second time because of the cache.(the database cache hit ratio is 97,8)Lastly, some other queries take milliseconds normally, but sometimes they take minutes. I didn't understand why this is happening. (There is no lock, no table bloating and up to date analyze)
| -> Index Scan using "IX_T_WF_STEP_StepDefTypeCd" on "T_WF_STEP" wf_cstp (cost=0.43..1098968.54 rows=4019 width=8) (actual time=0.096..4278.668 rows=802420 loops=1) |
| Heap Fetches: 803045 |
I am adding the explain analyze output as an attachment.
On Sun, Aug 21, 2022 at 12:05 PM Kenny Bachman <kenny.bachman17@gmail.com> wrote:Hi Team,Have a lovely Sunday.I have a problem with PostgreSQL performance. I am using PostgreSQL 14.5 on Linux physical server. My query was taking 1 or 2 seconds yesterday, but today it is taking 5-6 seconds. Also, nothing has changed in the database.Do you mean just no structural changes, or no changes of any kind?Also, when I run the query for the second time, the query runs for the same time, so I expect it to be more performant the second time because of the cache.(the database cache hit ratio is 97,8)Lastly, some other queries take milliseconds normally, but sometimes they take minutes. I didn't understand why this is happening. (There is no lock, no table bloating and up to date analyze)Did they start to "sometimes take minutes" just today, or was that a pre existing issue?How up to date are the stats? Did you just finish ANALYZE right before you captured the plan?This estimate looks pretty horrible and probably a problem with your stats:
-> Index Scan using "IX_T_WF_STEP_StepDefTypeCd" on "T_WF_STEP" wf_cstp (cost=0.43..1098968.54 rows=4019 width=8) (actual time=0.096..4278.668 rows=802420 loops=1) And this one suggests you vacuuming is not very up to date:
Heap Fetches: 803045 I am adding the explain analyze output as an attachment.Do you happen to have one for the same query from before the problem started? Also, it would be better to capture BUFFERS as part of the plan, and preferably with track_io_timing turned on.Cheers,Jeff
Attachment
Hi Mladen,Thank you for your help.Yes, the plan is huge, because there is a view object. The system has a very low load today and there are 2-3 active sessions normally, no long-running query.I checked the activity view, and there is no wait event for my query, which has a NULL value for the wait event column.Here is my memory status:total used free shared buff/cache available
Mem: 251 6 1 24 243 220How can we explain the cache doesn't work as expected? I mean, I expect more performant the second or third time running because of the cache. However, every time I run it I get the same exec time value.
Hi Kenny,
Please follow the execution with "perf top". If you get something like this:
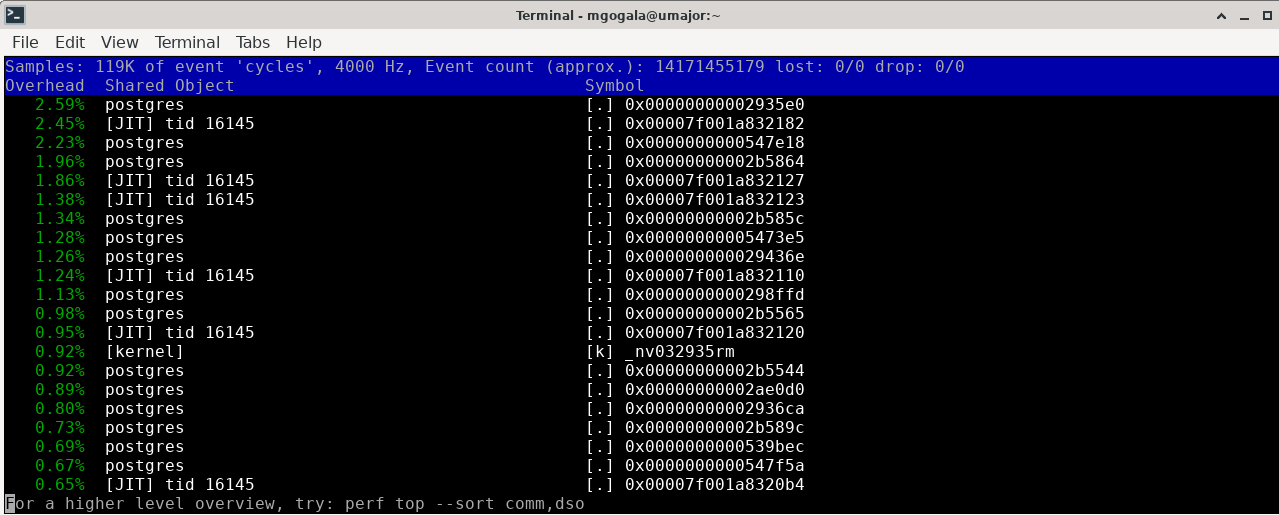
then your problem may be with the JIT component. Jit has large influence on the execution speed:
scott=# \timing on
Timing is on.
scott=# set jit=on;
SET
Time: 0.359 ms
scott=# select count(*) from emp e1,emp e2,emp e3,emp e4,emp e5,emp e6,emp e7;
count
-----------
105413504
(1 row)
Time: 3785.608 ms (00:03.786)
scott=# set jit=off;
SET
Time: 0.278 ms
scott=# select count(*) from emp e1,emp e2,emp e3,emp e4,emp e5,emp e6,emp e7;
count
-----------
105413504
(1 row)
Time: 4660.464 ms (00:04.660)
In my case, JIT speeds things up. However, I am aware of the situations when JIT slows things down. BTW, what you've just described demonstrates the need for a reliable event tracing mechanism, which was once suggested by Jeff Holt.
Regards
--
Mladen Gogala
Database Consultant
Tel: (347) 321-1217
https://dbwhisperer.wordpress.com
Attachment
On 8/21/22 14:55, Kenny Bachman wrote:Hi Mladen,Thank you for your help.Yes, the plan is huge, because there is a view object. The system has a very low load today and there are 2-3 active sessions normally, no long-running query.I checked the activity view, and there is no wait event for my query, which has a NULL value for the wait event column.Here is my memory status:total used free shared buff/cache available
Mem: 251 6 1 24 243 220How can we explain the cache doesn't work as expected? I mean, I expect more performant the second or third time running because of the cache. However, every time I run it I get the same exec time value.Hi Kenny,
Please follow the execution with "perf top". If you get something like this:
then your problem may be with the JIT component. Jit has large influence on the execution speed:
scott=# \timing on
Timing is on.
scott=# set jit=on;
SET
Time: 0.359 ms
scott=# select count(*) from emp e1,emp e2,emp e3,emp e4,emp e5,emp e6,emp e7;
count
-----------
105413504
(1 row)
Time: 3785.608 ms (00:03.786)
scott=# set jit=off;
SET
Time: 0.278 ms
scott=# select count(*) from emp e1,emp e2,emp e3,emp e4,emp e5,emp e6,emp e7;
count
-----------
105413504
(1 row)
Time: 4660.464 ms (00:04.660)In my case, JIT speeds things up. However, I am aware of the situations when JIT slows things down. BTW, what you've just described demonstrates the need for a reliable event tracing mechanism, which was once suggested by Jeff Holt.
Regards
--
Mladen Gogala
Database Consultant
Tel: (347) 321-1217
https://dbwhisperer.wordpress.com

Attachment
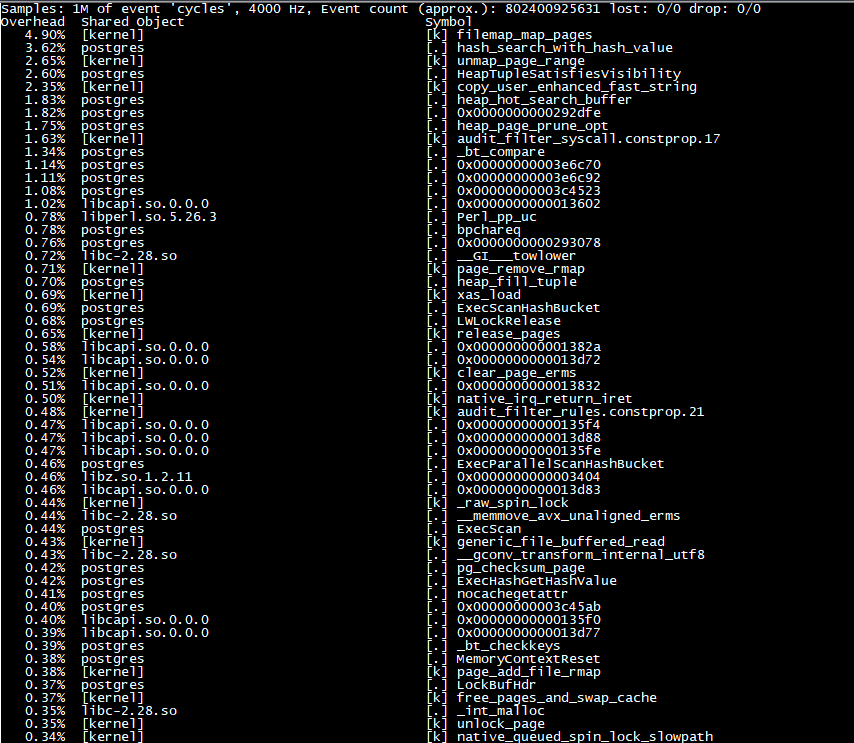
Hi again,JIT is already enabled. And here is the perf top output:
Kenny, JIT is not mentioned in any of your plans. Look how it looks, with JIT enabled:
QUERY PLAN
-------------------------------------------------------------------------------------------------------
Aggregate (cost=1682569.70..1682569.71 rows=1 width=8)
-> Nested Loop (cost=0.00..1419035.94 rows=105413504 width=0)
-> Nested Loop (cost=0.00..101365.96 rows=7529536 width=0)
-> Nested Loop (cost=0.00..7245.59 rows=537824 width=0)
-> Nested Loop (cost=0.00..521.62 rows=38416 width=0)
-> Nested Loop (cost=0.00..40.24 rows=2744 width=0)
-> Nested Loop (cost=0.00..4.77 rows=196 width=0)
-> Seq Scan on emp e1 (cost=0.00..1.14 rows=14 width=0)
-> Materialize (cost=0.00..1.21 rows=14 width=0)
-> Seq Scan on emp e2 (cost=0.00..1.14 rows=14 width=0)
-> Materialize (cost=0.00..1.21 rows=14 width=0)
-> Seq Scan on emp e3 (cost=0.00..1.14 rows=14 width=0)
-> Materialize (cost=0.00..1.21 rows=14 width=0)
-> Seq Scan on emp e4 (cost=0.00..1.14 rows=14 width=0)
-> Materialize (cost=0.00..1.21 rows=14 width=0)
-> Seq Scan on emp e5 (cost=0.00..1.14 rows=14 width=0)
-> Materialize (cost=0.00..1.21 rows=14 width=0)
-> Seq Scan on emp e6 (cost=0.00..1.14 rows=14 width=0)
-> Materialize (cost=0.00..1.21 rows=14 width=0)
-> Seq Scan on emp e7 (cost=0.00..1.14 rows=14 width=0)
JIT:
Functions: 14
Options: Inlining true, Optimization true, Expressions true, Deforming true
(23 rows)
Look at the end. There is no such section in any of your plans.
Regards
--
Mladen Gogala
Database Consultant
Tel: (347) 321-1217
https://dbwhisperer.wordpress.com
>
> Hello Jeff,
>
> Thank you for your response.
>
> >Do you mean just no structural changes, or no changes of any kind?
> I mean, no database parameter changes were made.
So that probably just means that enough data has changed that the new stats suggest the new plan will be faster. It is wrong about that, but given the poor estimates in the plan that is not surprising that it would be wrong. But without seeing the fast plan, it might be very hard to figure out what changed. Maybe you could restore a backup to a test server to get the old plan.
> > Did they start to "sometimes take minutes" just today, or was that a pre existing issue?
> Not just today. Sometimes it takes 50 seconds, sometimes 20 seconds, sometimes 10 milliseconds. (at completely random times.)
That sounds like a topic for a different email thread. You can use auto_explain with the log_min_duration setting to capture plans for the very run where they were slow. Since the slowness is only sporadic, then you get a fast plan to compare it to just by manually repeating the query.
> > How up to date are the stats? Did you just finish ANALYZE right before you captured the plan?
> Yes, I ran the VACUUM ANALYZE command for the all tables of the view and I captured the plan after the vacuum analyze operation finished.
>
Your new plan shows the heap fetches were greatly reduced, so another vacuum must have been more successful than the earlier one. Maybe a long-running transaction was blocking rows from being cleaned up, and finally went away. But the estimate is still very off.
Could you do `EXPLAIN (ANALYZE, BUFFERS) select * from "T_WF_STEP" wher "StepDefTypeCd" = 'End';` to see how many rows it thought it would find versus how many it actually finds? And if they are very different, ANALYZE that table again just to make sure it didn't get overlooked before and then repeat the query.
>
> > Do you happen to have one for the same query from before the problem started? Also, it would be better to capture BUFFERS as part of the plan, and preferably with track_io_timing turned on
> I added the exec plan with the buffers option, and I don't have query plan from before the problem.
You can see there that little time was spent reading data, so that explains why repeating the query didn't make it much faster due to caching. The time isn't spent reading data, but doing CPU work on data already in memory.
You can see there that little time was spent reading data, so that explains why repeating the query didn't make it much faster due to caching. The time isn't spent reading data, but doing CPU work on data already in memory.Cheers,Jeff
Agreed. The "perf top" output produced by Kenny definitely indicates that. That's precisely why I concentrated on JIT. Anything else would give us a slim chance of increasing the query speed.
Regards
--
Mladen Gogala
Database Consultant
Tel: (347) 321-1217
https://dbwhisperer.wordpress.com
Agreed. The "perf top" output produced by Kenny definitely indicates that. That's precisely why I concentrated on JIT. Anything else would give us a slim chance of increasing the query speed.
When I come to think of it, are you using huge pages for shared buffers? Huge pages tend to decrease page tables and lessen the impact of paging.
Regards
--
Mladen Gogala
Database Consultant
Tel: (347) 321-1217
https://dbwhisperer.wordpress.com
On 8/21/22 21:16, Mladen Gogala wrote:Agreed. The "perf top" output produced by Kenny definitely indicates that. That's precisely why I concentrated on JIT. Anything else would give us a slim chance of increasing the query speed.
When I come to think of it, are you using huge pages for shared buffers? Huge pages tend to decrease page tables and lessen the impact of paging.
Regards
--
Mladen Gogala
Database Consultant
Tel: (347) 321-1217
https://dbwhisperer.wordpress.com
The huge_pages parameter is try. How can I know the huge page is used for shared buffers?Also, I would like to say one more thing. Some queries have high planning time of explain analyze output. However, I run vacuumdb analyze command every day. I am a little bit confused about this.Warm regards,Kenn
Hi Kenny,
You can check by using grep -i huge /proc/meminfo. If your shared buffers are properly allocated, you will see something like this:
grep -i huge /proc/meminfo
AnonHugePages:         0 kB
ShmemHugePages:        0 kB
FileHugePages:         0 kB
HugePages_Total:    3072
HugePages_Free:        6
HugePages_Rsvd:        3
HugePages_Surp:        0
Hugepagesize:       2048 kB
Hugetlb:         6291456 kB

If, on the other side, huge pages are not allocated properly, you will get something like this:

grep -i huge /proc/meminfo
AnonHugePages:         0 kB
ShmemHugePages:        0 kB
FileHugePages:         0 kB
HugePages_Total:       0
HugePages_Free:        0
HugePages_Rsvd:        0
HugePages_Surp:        0
Hugepagesize:       2048 kB
Hugetlb:               0 kB

HugePages total and free will be equal. You need to put the right number into /etc/sysctl.conf:

grep vm.nr_hugepages /etc/sysctl.conf
vm.nr_hugepages=3072

Regards
--
Mladen Gogala
Database Consultant
Tel: (347) 321-1217
https://dbwhisperer.wordpress.com
ShmemHugePages: 0 kB
FileHugePages: 0 kB
HugePages_Total: 0
HugePages_Free: 0
HugePages_Rsvd: 0
HugePages_Surp: 0
Hugepagesize: 2048 kB
Hugetlb: 0 kB
On 8/22/22 09:17, Kenny Bachman wrote:The huge_pages parameter is try. How can I know the huge page is used for shared buffers?Also, I would like to say one more thing. Some queries have high planning time of explain analyze output. However, I run vacuumdb analyze command every day. I am a little bit confused about this.Warm regards,Kenn
Hi Kenny,
You can check by using grep -i huge /proc/meminfo. If your shared buffers are properly allocated, you will see something like this:
grep -i huge /proc/meminfo
AnonHugePages:         0 kB
ShmemHugePages:        0 kB
FileHugePages:         0 kB
HugePages_Total:    3072
HugePages_Free:        6
HugePages_Rsvd:        3
HugePages_Surp:        0
Hugepagesize:       2048 kB
Hugetlb:         6291456 kB

If, on the other side, huge pages are not allocated properly, you will get something like this:

grep -i huge /proc/meminfo
AnonHugePages:         0 kB
ShmemHugePages:        0 kB
FileHugePages:         0 kB
HugePages_Total:       0
HugePages_Free:        0
HugePages_Rsvd:        0
HugePages_Surp:        0
Hugepagesize:       2048 kB
Hugetlb:               0 kB

HugePages total and free will be equal. You need to put the right number into /etc/sysctl.conf:

grep vm.nr_hugepages /etc/sysctl.conf
vm.nr_hugepages=3072

Regards
-- Mladen Gogala Database Consultant Tel: (347) 321-1217 https://dbwhisperer.wordpress.com
Hi Kenny, have you enable huge pages? See for example: https://linuxconfig.org/how-to-enable-hugepages-on-linux Best regards, Frank Am Tue, Aug 23, 2022 at 04:27:54PM +0300 schrieb Kenny Bachman: > Thank you so much for your response. I checked the huge page status; the > huge pages not allocated. > > AnonHugePages: 0 kB > ShmemHugePages: 0 kB > FileHugePages: 0 kB > HugePages_Total: 0 > HugePages_Free: 0 > HugePages_Rsvd: 0 > HugePages_Surp: 0 > Hugepagesize: 2048 kB > Hugetlb: 0 kB
On 8/21/22 20:46, Jeff Janes wrote:
You can see there that little time was spent reading data, so that explains why repeating the query didn't make it much faster due to caching. The time isn't spent reading data, but doing CPU work on data already in memory.Agreed. The "perf top" output produced by Kenny definitely indicates that. That's precisely why I concentrated on JIT. Anything else would give us a slim chance of increasing the query speed.
I don't think that that follows at all. Proper index usage can vastly improve CPU-bound performance, not just Disk-bound performance. And that it used to be faster in the recent past suggests that it is certainly possible for it to be faster.
I don't think that that follows at all. Proper index usage can vastly improve CPU-bound performance, not just Disk-bound performance. And that it used to be faster in the recent past suggests that it is certainly possible for it to be faster.I assume he is on a system/installation without a JIT provider, so even if jit is enabled in the postgresql.conf, it won't be used.
That may also be true. The plan attached by the OP doesn't have any JIT information despite him telling us that JIT is turned on. As for the proper index usage, I would need to look at the plan details, in particular, how many rows were retrieved in each index range scan step. Unfortunately, I don't have time to do that.
Regards
--
Mladen Gogala
Database Consultant
Tel: (347) 321-1217
https://dbwhisperer.wordpress.com