Thread: Avoid stack frame setup in performance critical routines using tail calls
Hi,

We have a few routines that are taking up a meaningful share of nearly all
workloads. They are worth micro-optimizing, even though they rarely the most
expensive parts of a profile. The memory allocation infrastructure is an
example of that.

When looking at a profile one can often see that a measurable percentage of
the time is spent doing stack frame setup in functions like palloc(),
AllocSetAlloc(). E.g. here's a perf profile annotating palloc(), the first
column showing the percentage of the time the relevant instruction was
sampled:

       │      void *
       │      palloc(Size size)
       │      {
 11.62 │        push  %rbp
  5.89 │        mov   %rsp,%rbp
 11.79 │        push  %r12
       │        mov   %rdi,%r12
  6.07 │        push  %rbx
       │      /* duplicates MemoryContextAlloc to avoid increased overhead */
       │      void       *ret;
       │      MemoryContext context = CurrentMemoryContext;
       │        mov   CurrentMemoryContext,%rbx
       │
       │      AssertArg(MemoryContextIsValid(context));
       │      AssertNotInCriticalSection(context);
       │
       │      if (!AllocSizeIsValid(size))
  5.86 │        cmp   $0x3fffffff,%rdi
       │      → ja    14fa5b <palloc.cold>
       │      elog(ERROR, "invalid memory alloc request size %zu", size);
       │
       │      context->isReset = false;
 17.71 │        movb  $0x0,0x4(%rbx)
       │
       │      ret = context->methods->alloc(context, size);
  5.98 │        mov   0x10(%rbx),%rax
       │        mov   %rdi,%rsi
       │        mov   %rbx,%rdi
 35.08 │      → callq *(%rax)


The stack frame setup bit is the push ... bit.

At least on x86-64 unixoid systems, that overhead can be avoided in certain
circumstances! The simplest case is if the function doesn't do any function
calls of its own. If simple enough (i.e. no register spilling), the compiler
will just not set up a stack frame - nobody could need it.

The slightly more complicated case is that of a function that only does a
"tail call", i.e. the only function call is just before returning (there can
be multiple such paths though). If the function is simple enough, gcc/clang
will then not use the "call" instruction to call the function (which would
require a proper stack frame being set up), but instead just jump to the other
function. Which ends up reusing the current function's stack frame,
basically. When that called function returns using 'ret', it'll reuse the
location pushed onto the call stack by the caller of the "original" function,
and return to its caller. Having optimized away the need to maintain one stack
frame level, and one indirection when returning from the inner function (which
just would do its own ret).

For that to work, there obviously cannot be any instructions in the function
before calling the inner function. Which brings us back to the palloc example
from above.

As an experiment, if i change the code for palloc() to omit the if (ret == NULL)
check, the assembly (omitting source for brevity) from:

  61c9a0:       55                      push   %rbp
  61c9a1:       48 89 e5                mov    %rsp,%rbp
  61c9a4:       41 54                   push   %r12
  61c9a6:       49 89 fc                mov    %rdi,%r12
  61c9a9:       53                      push   %rbx
  61c9aa:       48 8b 1d 2f f2 2a 00    mov    0x2af22f(%rip),%rbx        # 8cbbe0 <CurrentMemoryContext>
  61c9b1:       48 81 ff ff ff ff 3f    cmp    $0x3fffffff,%rdi
  61c9b8:       0f 87 9d 30 b3 ff       ja     14fa5b <palloc.cold>
  61c9be:       c6 43 04 00             movb   $0x0,0x4(%rbx)
  61c9c2:       48 8b 43 10             mov    0x10(%rbx),%rax
  61c9c6:       48 89 fe                mov    %rdi,%rsi
  61c9c9:       48 89 df                mov    %rbx,%rdi
  61c9cc:       ff 10                   callq  *(%rax)
  61c9ce:       48 85 c0                test   %rax,%rax
  61c9d1:       0f 84 b9 30 b3 ff       je     14fa90 <palloc.cold+0x35>
  61c9d7:       5b                      pop    %rbx
  61c9d8:       41 5c                   pop    %r12
  61c9da:       5d                      pop    %rbp
  61c9db:       c3                      retq

to

  61c8c0:       48 89 fe                mov    %rdi,%rsi
  61c8c3:       48 8b 3d 16 f3 2a 00    mov    0x2af316(%rip),%rdi        # 8cbbe0 <CurrentMemoryContext>
  61c8ca:       48 81 fe ff ff ff 3f    cmp    $0x3fffffff,%rsi
  61c8d1:       0f 87 c3 31 b3 ff       ja     14fa9a <palloc.cold>
  61c8d7:       c6 47 04 00             movb   $0x0,0x4(%rdi)
  61c8db:       48 8b 47 10             mov    0x10(%rdi),%rax
  61c8df:       ff 20                   jmpq   *(%rax)

It's not hard to see why that would be faster, I think.


Of course, we cannot just omit that check. But I think this is an argument for
why it is not a great idea to have such a check in palloc() - it prevents the
use of the above optimization, and it adds a branch to a performance critical
function, though there already existing branches in aset.c etc that
specifically know about this case.

The code in palloc() does this check after context->methods->alloc() since
3d6d1b585524: Move out-of-memory error checks from aset.c to mcxt.c

Of course, that commit changed things for a reason: It allows
palloc_extended() to exist.

However, it seems that the above optimization, as well as the desire to avoid
redundant branches (checking for allocation failures in AllocSetAlloc() and
then again in palloc() etc) in critical paths, suggests pushing the handling
of MCXT_ALLOC_NO_OOM (and perhaps others) a layer down, into the memory
context implementations. Which of course means that we would need to pass down
MCXT_ALLOC_NO_OOM into at least MemoryContextMethods->alloc,realloc}. But that
seems like a good idea to me anyway. That way we could pass down further
information as well, e.g. about required alignment.

Of course it'd make sense to avoid duplicating the same error message across
all contexts, but that could be addressed using a mcxt.c helper function to
deal with the allocation failure case.

E.g the existing cases like

    block = (AllocBlock) malloc(blksize);
    if (block == NULL)
        return NULL;

could become something like
    block = (AllocBlock) malloc(blksize);
    if (unlikely(block == NULL))
        return MemoryContextAllocationFailure(context, size, flags);


The trick of avoiding stack frame setup does not just apply to wrapper
functions like palloc(). It even can apply to AllocSetAlloc() itself! If one
separates out the "slow paths" from the "fast paths" of AllocSetAlloc(), the
fast path can avoid needing the stack frame, for the price of the slow paths
being a tiny bit slower. Often the generated code turns out to be better,
because the register allocation pressure is lower in the fast path.

For that to work, the paths of AllocSetAlloc() that call malloc() need to be
separated out. As we obviously need to process malloc()'s result, the call to
malloc cannot be a tail call. So we need to split out two paths:
1) handling of large allocations
2) running out of space in the current block / having no block

To actually benefit from the optimization, those paths need to actually return
the allocated memory. And they need to be marked pg_noinline, otherwise the
compiler won't get the message...

I think this actually makes the aset.c code a good bit more readable, and
highlights where in AllocSetAlloc() adding instructions hurts, and where its
fine.

I have *not* carefully benchmarked this, but a quick implementation of this
does seem to increase readonly pgbench tps at a small scale by 2-3% (both
-Mprepared/simple). Despite not being an all that pgbench bound workload.


Rough prototype patch for the above attached.

Comments?


A slightly tangential improvement would be to move the memset() in palloc0()
et al do into a static inline. There's two benefits of that:

1) compilers can generate much better code for memset() if the length is known
   - instead of a function call with length dispatch replace that with a
   handful of instructions doing the zeroing for the precise length.

2) compilers can often optimize away [part of ]the overhead of needing to do
   the memset, as many callers will go on to overwrite a good portion of the
   zeroed data.


Greetings,

Andres Freund
Attachment
Re: Avoid stack frame setup in performance critical routines using tail calls
From
David Rowley
Date:
On Tue, 20 Jul 2021 at 08:00, Andres Freund <andres@anarazel.de> wrote:
> I have *not* carefully benchmarked this, but a quick implementation of this
> does seem to increase readonly pgbench tps at a small scale by 2-3% (both

Interesting.

I've not taken the time to study the patch but I was running some
other benchmarks today on a small scale pgbench readonly test and I
took this patch for a spin to see if I could see the same performance
gains.

This is an AMD 3990x machine that seems to get the most throughput
from pgbench with 132 processes

I did: pgbench -T 240 -P 10 -c 132 -j 132 -S -M prepared
--random-seed=12345 postgres

master = dd498998a

Master: 3816959.53 tps
Patched: 3820723.252 tps

I didn't quite get the same 2-3% as you did, but it did come out
faster than on master.

David
Attachment
Re: Avoid stack frame setup in performance critical routines using tail calls
From
Andres Freund
Date:
Hi,

On 2021-07-20 16:50:09 +1200, David Rowley wrote:
> I've not taken the time to study the patch but I was running some
> other benchmarks today on a small scale pgbench readonly test and I
> took this patch for a spin to see if I could see the same performance
> gains.

Thanks!


> This is an AMD 3990x machine that seems to get the most throughput
> from pgbench with 132 processes
>
> I did: pgbench -T 240 -P 10 -c 132 -j 132 -S -M prepared
> --random-seed=12345 postgres
>
> master = dd498998a
>
> Master: 3816959.53 tps
> Patched: 3820723.252 tps
>
> I didn't quite get the same 2-3% as you did, but it did come out
> faster than on master.

It would not at all be suprising to me if AMD in recent microarchitectures did
a better job at removing stack management overview (e.g. by better register
renaming, or by resolving dependencies on %rsp in a smarter way) than Intel
has. This was on a Cascade Lake CPU (xeon 5215), which, despite being released
in 2019, effectively is a moderately polished (or maybe shoehorned)
microarchitecture from 2015 due to all the Intel troubles. Whereas Zen2 is
from 2019.

It's also possible that my attempts at avoiding the stack management just
didn't work on your compiler. Either due to vendor (I know that gcc is better
at it than clang), version, or compiler flags (e.g. -fno-omit-frame-pointer
could make it harder, -fno-optimize-sibling-calls would disable it).

A third plausible explanation for the difference is that at a client count of
132, the bottlenecks are sufficiently elsewhere to just not show a meaningful
gain from memory management efficiency improvements.


Any chance you could show a `perf annotate AllocSetAlloc` and `perf annotate
palloc` from a patched run? And perhaps how high their percentages of the
total work are. E.g. using something like
perf report -g none|grep -E 'AllocSetAlloc|palloc|MemoryContextAlloc|pfree'

It'd be interesting to know where the bottlenecks on a zen2 machine are.

Greetings,

Andres Freund
Re: Avoid stack frame setup in performance critical routines using tail calls
From
David Rowley
Date:
On Tue, 20 Jul 2021 at 18:17, Andres Freund <andres@anarazel.de> wrote:
> Any chance you could show a `perf annotate AllocSetAlloc` and `perf annotate
> palloc` from a patched run? And perhaps how high their percentages of the
> total work are. E.g. using something like
> perf report -g none|grep -E 'AllocSetAlloc|palloc|MemoryContextAlloc|pfree'

Sure. See attached.

David
Attachment
Re: Avoid stack frame setup in performance critical routines using tail calls
From
"Andres Freund"
Date:
Hi,

On Mon, Jul 19, 2021, at 23:53, David Rowley wrote:
> On Tue, 20 Jul 2021 at 18:17, Andres Freund <andres@anarazel.de> wrote:
> > Any chance you could show a `perf annotate AllocSetAlloc` and `perf annotate
> > palloc` from a patched run? And perhaps how high their percentages of the
> > total work are. E.g. using something like
> > perf report -g none|grep -E 'AllocSetAlloc|palloc|MemoryContextAlloc|pfree'
>
> Sure. See attached.
>
> David
>
> Attachments:
> * AllocateSetAlloc.txt
> * palloc.txt
> * percent.txt

Huh, that's interesting. You have some control flow enforcement stuff turned on (the endbr64). And it looks like it has
anon zero cost (or maybe it's just skid). Did you enable that intentionally? If not, what compiler/version/distro is
it?I think at least on GCC that's -fcf-protection=...


Andres
Re: Avoid stack frame setup in performance critical routines using tail calls
From
David Rowley
Date:
On Tue, 20 Jul 2021 at 19:04, Andres Freund <andres@anarazel.de> wrote:
> > * AllocateSetAlloc.txt
> > * palloc.txt
> > * percent.txt
>
> Huh, that's interesting. You have some control flow enforcement stuff turned on (the endbr64). And it looks like it
hasa non zero cost (or maybe it's just skid). Did you enable that intentionally? If not, what compiler/version/distro
isit? I think at least on GCC that's -fcf-protection=...

It's ubuntu 21.04 with gcc 10.3 (specifically gcc version 10.3.0
(Ubuntu 10.3.0-1ubuntu1)

I've attached the same results from compiling with clang 12
(12.0.0-3ubuntu1~21.04.1)

David
Attachment
Re: Avoid stack frame setup in performance critical routines using tail calls
From
Andres Freund
Date:
Hi,

On 2021-07-20 19:37:46 +1200, David Rowley wrote:
> On Tue, 20 Jul 2021 at 19:04, Andres Freund <andres@anarazel.de> wrote:
> > > * AllocateSetAlloc.txt
> > > * palloc.txt
> > > * percent.txt
> >
> > Huh, that's interesting. You have some control flow enforcement stuff turned on (the endbr64). And it looks like it
hasa non zero cost (or maybe it's just skid). Did you enable that intentionally? If not, what compiler/version/distro
isit? I think at least on GCC that's -fcf-protection=...

>
> It's ubuntu 21.04 with gcc 10.3 (specifically gcc version 10.3.0
> (Ubuntu 10.3.0-1ubuntu1)
>
> I've attached the same results from compiling with clang 12
> (12.0.0-3ubuntu1~21.04.1)

It looks like the ubuntu folks have changed the default for CET to on.


andres@ubuntu2020:~$ echo 'int foo(void) { return 17;}' > test.c && gcc -O2  -c -o test.o test.c && objdump -S test.o

test.o:     file format elf64-x86-64


Disassembly of section .text:

0000000000000000 <foo>:
   0:    f3 0f 1e fa              endbr64
   4:    b8 11 00 00 00           mov    $0x11,%eax
   9:    c3                       retq
andres@ubuntu2020:~$ echo 'int foo(void) { return 17;}' > test.c && gcc -O2 -fcf-protection=none -c -o test.o test.c &&
objdump-S test.o


test.o:     file format elf64-x86-64


Disassembly of section .text:

0000000000000000 <foo>:
   0:    b8 11 00 00 00           mov    $0x11,%eax
   5:    c3                       retq


Independent of this patch, it might be worth running a benchmark with
the default options, and one with -fcf-protection=none. None of my
machines support it...

$ cpuid -1|grep CET
      CET_SS: CET shadow stack                 = false
      CET_IBT: CET indirect branch tracking    = false
         XCR0 supported: CET_U state          = false
         XCR0 supported: CET_S state          = false

Here it adds about 40kB of .text, but I can't measure the CET
overhead...

Greetings,

Andres Freund
Re: Avoid stack frame setup in performance critical routines using tail calls
From
Andres Freund
Date:
Hi,

David and I were chatting about this patch, in the context of his bump
allocator patch.  Attached is a rebased version that is also split up into two
steps, and a bit more polished.

I wasn't sure what a good test was. I ended up measuring
  COPY pgbench_accounts TO '/dev/null' WITH (FORMAT 'binary');
of a scale 1 database with pgbench:

c=1;pgbench -q -i -s1 && pgbench  -n -c$c -j$c -t100 -f <(echo "COPY pgbench_accounts TO '/dev/null' WITH (FORMAT
'binary');")

    average latency
HEAD:   33.865 ms
01:     32.820 ms
02:     29.934 ms

The server was pinned to the one core, turbo mode disabled.  That's a pretty
nice win, I'd say.  And I don't think this is actually the most allocator
bound workload, I just tried something fairly random...


Greetings,

Andres Freund
Attachment
Re: Avoid stack frame setup in performance critical routines using tail calls
From
David Rowley
Date:
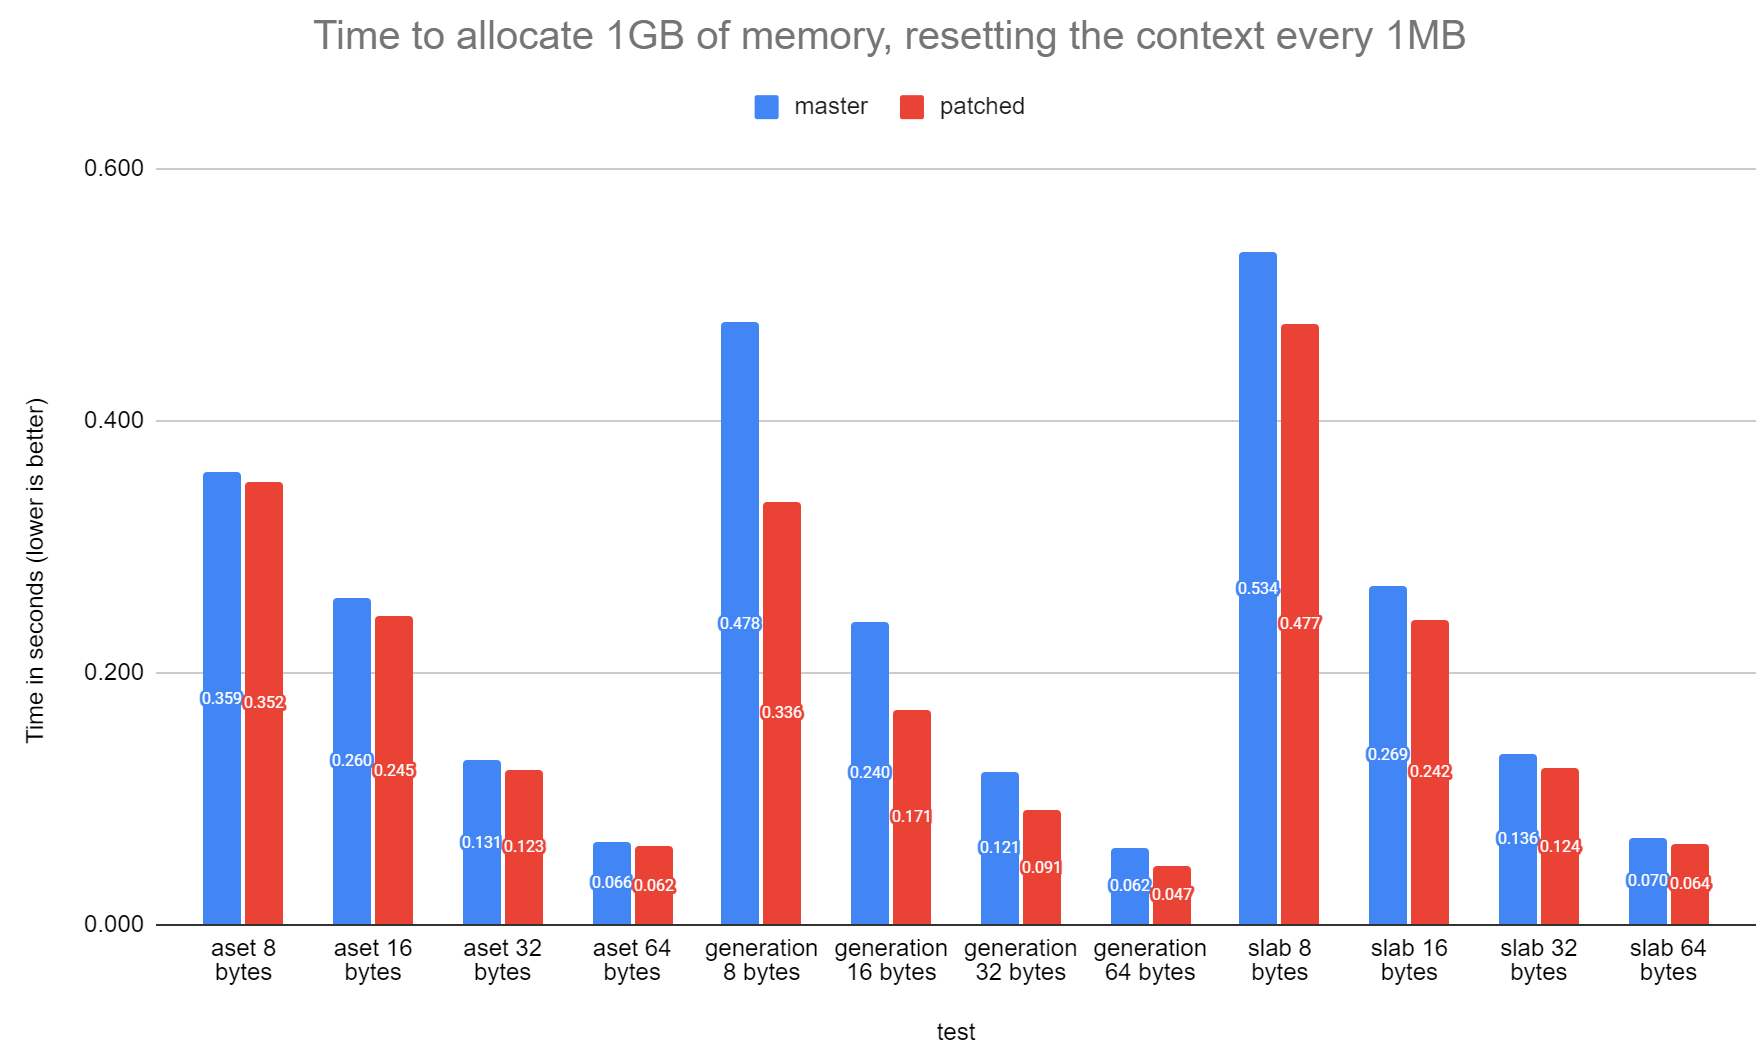
On Wed, 19 Jul 2023 at 20:52, Andres Freund <andres@anarazel.de> wrote:
> David and I were chatting about this patch, in the context of his bump
> allocator patch.  Attached is a rebased version that is also split up into two
> steps, and a bit more polished.

I've only just briefly read through the updated patch, but I did take
it for a spin to see what sort of improvements I can get from it.

The attached graph shows the time in seconds that it took for each
allocator to allocate 10GBs of memory resetting the context once 1MB
is allocated.  The data point for aset with 32-byte chunks takes
master 1.697 seconds and with both patches, it goes down to 1.264,
which is a 34% increase in performance.

It's pretty nice that we can hide the AllocSizeIsValid tests inside
the allocChunkLimit path and pretty good that we can skip the NULL
checks in most cases since we're not having to check for malloc
failure unless we malloc a new block.

I'll reply back with a more detailed review next week.

David
Attachment
Re: Avoid stack frame setup in performance critical routines using tail calls
From
John Naylor
Date:
On Wed, Jul 19, 2023 at 3:53 PM Andres Freund <andres@anarazel.de> wrote:
>
> Hi,
>
> David and I were chatting about this patch, in the context of his bump
> allocator patch. Attached is a rebased version that is also split up into two
> steps, and a bit more polished.
Here is a quick test -- something similar was used to measure the slab improvements last cycle. With radix tree v37 0001-0011 from [1],
create extension bench_radix_tree;
select avg(load_ms) from generate_series(1,100) x(x), lateral (select * from bench_load_random_int(100 * 1000 * (1+x-x))) a;
The backend was pinned and turbo off. Perf runs were separate from timed runs. I included 0002 for completeness.
v37
avg
---------------------
27.0400000000000000
32.42% postgres bench_radix_tree.so [.] rt_recursive_set
21.60% postgres postgres [.] SlabAlloc
11.06% postgres [unknown] [k] 0xffffffff930018f7
10.49% postgres bench_radix_tree.so [.] rt_extend_down
7.07% postgres postgres [.] MemoryContextAlloc
4.83% postgres bench_radix_tree.so [.] rt_node_insert_inner
2.19% postgres bench_radix_tree.so [.] rt_grow_node_48
2.16% postgres bench_radix_tree.so [.] rt_set.isra.0
1.50% postgres bench_radix_tree.so [.] MemoryContextAlloc@plt
v37 + palloc sibling calls
avg
---------------------
26.0700000000000000
v37 + palloc sibling calls + opt aset
avg
---------------------
26.0900000000000000
33.78% postgres bench_radix_tree.so [.] rt_recursive_set
23.04% postgres postgres [.] SlabAlloc
11.43% postgres [unknown] [k] 0xffffffff930018f7
11.05% postgres bench_radix_tree.so [.] rt_extend_down
5.52% postgres bench_radix_tree.so [.] rt_node_insert_inner
2.47% postgres bench_radix_tree.so [.] rt_set.isra.0
2.30% postgres bench_radix_tree.so [.] rt_grow_node_48
1.88% postgres postgres [.] MemoryContextAlloc
1.44% postgres bench_radix_tree.so [.] MemoryContextAlloc@plt
avg
---------------------
27.0400000000000000
32.42% postgres bench_radix_tree.so [.] rt_recursive_set
21.60% postgres postgres [.] SlabAlloc
11.06% postgres [unknown] [k] 0xffffffff930018f7
10.49% postgres bench_radix_tree.so [.] rt_extend_down
7.07% postgres postgres [.] MemoryContextAlloc
4.83% postgres bench_radix_tree.so [.] rt_node_insert_inner
2.19% postgres bench_radix_tree.so [.] rt_grow_node_48
2.16% postgres bench_radix_tree.so [.] rt_set.isra.0
1.50% postgres bench_radix_tree.so [.] MemoryContextAlloc@plt
v37 + palloc sibling calls
avg
---------------------
26.0700000000000000
v37 + palloc sibling calls + opt aset
avg
---------------------
26.0900000000000000
33.78% postgres bench_radix_tree.so [.] rt_recursive_set
23.04% postgres postgres [.] SlabAlloc
11.43% postgres [unknown] [k] 0xffffffff930018f7
11.05% postgres bench_radix_tree.so [.] rt_extend_down
5.52% postgres bench_radix_tree.so [.] rt_node_insert_inner
2.47% postgres bench_radix_tree.so [.] rt_set.isra.0
2.30% postgres bench_radix_tree.so [.] rt_grow_node_48
1.88% postgres postgres [.] MemoryContextAlloc
1.44% postgres bench_radix_tree.so [.] MemoryContextAlloc@plt
It's nice to see MemoryContextAlloc go down in the profile.
Re: Avoid stack frame setup in performance critical routines using tail calls
From
David Rowley
Date:
On Fri, 21 Jul 2023 at 14:03, David Rowley <dgrowleyml@gmail.com> wrote:
> I'll reply back with a more detailed review next week.

Here's a review of v2-0001:

1.

/*
* XXX: Should this also be moved into alloc()? We could possibly avoid
* zeroing in some cases (e.g. if we used mmap() ourselves.
*/
MemSetAligned(ret, 0, size);

Maybe this should be moved to the alloc function.  It would allow us
to get rid of this:

#define palloc0fast(sz) \
( MemSetTest(0, sz) ? \
MemoryContextAllocZeroAligned(CurrentMemoryContext, sz) : \
MemoryContextAllocZero(CurrentMemoryContext, sz) )

If we do the zeroing inside the alloc function then it can always use
the MemoryContextAllocZeroAligned version providing we zero before
setting the sentinel byte.

It would allow the tail call in the palloc0() case, but the drawback
would be having to check for the MCXT_ALLOC_ZERO flag in the alloc
function. I wonder if that branch would be predictable in most cases,
e.g. the parser will be making lots of nodes and want to zero all
allocations, but the executor won't be doing much of that. There will
be a mix of zeroing and not zeroing in the planner, mostly not, I
think.

2. Why do you need to add the NULL check here?

 #ifdef USE_VALGRIND
- if (method != MCTX_ALIGNED_REDIRECT_ID)
+ if (ret != NULL && method != MCTX_ALIGNED_REDIRECT_ID)
  VALGRIND_MEMPOOL_CHANGE(context, pointer, ret, size);
 #endif

I know it's just valgrind code and performance does not matter, but
the realloc flags are being passed as 0, so allocation failures won't
return.

3.

/*
* XXX: Probably no need to check for huge allocations, we only support
* one size? Which could theoretically be huge, but that'd not make
* sense...
*/

They can't be huge per Assert(fullChunkSize <= MEMORYCHUNK_MAX_VALUE)
in SlabContextCreate().

4. It would be good to see some API documentation in the
MemoryContextMethods struct.  This adds a lot of responsibility onto
the context implementation without any extra documentation to explain
what, for example, palloc is responsible for and what the alloc
function needs to do itself.

David
Re: Avoid stack frame setup in performance critical routines using tail calls
From
David Rowley
Date:
I've rebased the 0001 patch and gone over it again and made a few
additional changes besides what I mentioned in my review.

On Wed, 9 Aug 2023 at 20:44, David Rowley <dgrowleyml@gmail.com> wrote:
> Here's a review of v2-0001:
> 2. Why do you need to add the NULL check here?
>
>  #ifdef USE_VALGRIND
> - if (method != MCTX_ALIGNED_REDIRECT_ID)
> + if (ret != NULL && method != MCTX_ALIGNED_REDIRECT_ID)
>   VALGRIND_MEMPOOL_CHANGE(context, pointer, ret, size);
>  #endif

I removed this NULL check as we're calling the realloc function with
no flags, so it shouldn't return NULL as it'll error out from any OOM
errors.

> 3.
>
> /*
> * XXX: Probably no need to check for huge allocations, we only support
> * one size? Which could theoretically be huge, but that'd not make
> * sense...
> */
>
> They can't be huge per Assert(fullChunkSize <= MEMORYCHUNK_MAX_VALUE)
> in SlabContextCreate().

I removed this comment and adjusted the comment just below that which
checks the 'size' matches the expected slab chunk size. i.e.

/*
* Make sure we only allow correct request size.  This doubles as the
* MemoryContextCheckSize check.
*/
if (unlikely(size != slab->chunkSize))


> 4. It would be good to see some API documentation in the
> MemoryContextMethods struct.  This adds a lot of responsibility onto
> the context implementation without any extra documentation to explain
> what, for example, palloc is responsible for and what the alloc
> function needs to do itself.

I've done that too.

I also added header comments for MemoryContextAllocationFailure and
MemoryContextSizeFailure and added some comments to explain in places
like palloc() to warn people not to add checks after the 'alloc' call.

The rebased patch is 0001 and all of my changes are in 0002.  I will
rebase your original 0002 patch later.  I think 0001 is much more
important, as evident by the reported benchmarks on this thread.

In absence of anyone else looking at this, I think it's ready to go.
If anyone is following along and wants to review or test it, please do
so soon.

David
Attachment
Re: Avoid stack frame setup in performance critical routines using tail calls
From
Andres Freund
Date:
Hi,
On 2024-02-23 00:46:26 +1300, David Rowley wrote:
> I've rebased the 0001 patch and gone over it again and made a few
> additional changes besides what I mentioned in my review.
>
> On Wed, 9 Aug 2023 at 20:44, David Rowley <dgrowleyml@gmail.com> wrote:
> > Here's a review of v2-0001:
> > 2. Why do you need to add the NULL check here?
> >
> > #ifdef USE_VALGRIND
> > - if (method != MCTX_ALIGNED_REDIRECT_ID)
> > + if (ret != NULL && method != MCTX_ALIGNED_REDIRECT_ID)
> > VALGRIND_MEMPOOL_CHANGE(context, pointer, ret, size);
> > #endif
>
> I removed this NULL check as we're calling the realloc function with
> no flags, so it shouldn't return NULL as it'll error out from any OOM
> errors.
That was probably a copy-paste issue...
> > 4. It would be good to see some API documentation in the
> > MemoryContextMethods struct. This adds a lot of responsibility onto
> > the context implementation without any extra documentation to explain
> > what, for example, palloc is responsible for and what the alloc
> > function needs to do itself.
>
> I've done that too.
>
> I also added header comments for MemoryContextAllocationFailure and
> MemoryContextSizeFailure and added some comments to explain in places
> like palloc() to warn people not to add checks after the 'alloc' call.
>
> The rebased patch is 0001 and all of my changes are in 0002. I will
> rebase your original 0002 patch later.
Thanks!
> I think 0001 is much more important, as evident by the reported benchmarks
> on this thread.
I agree that it's good to tackle 0001 first.
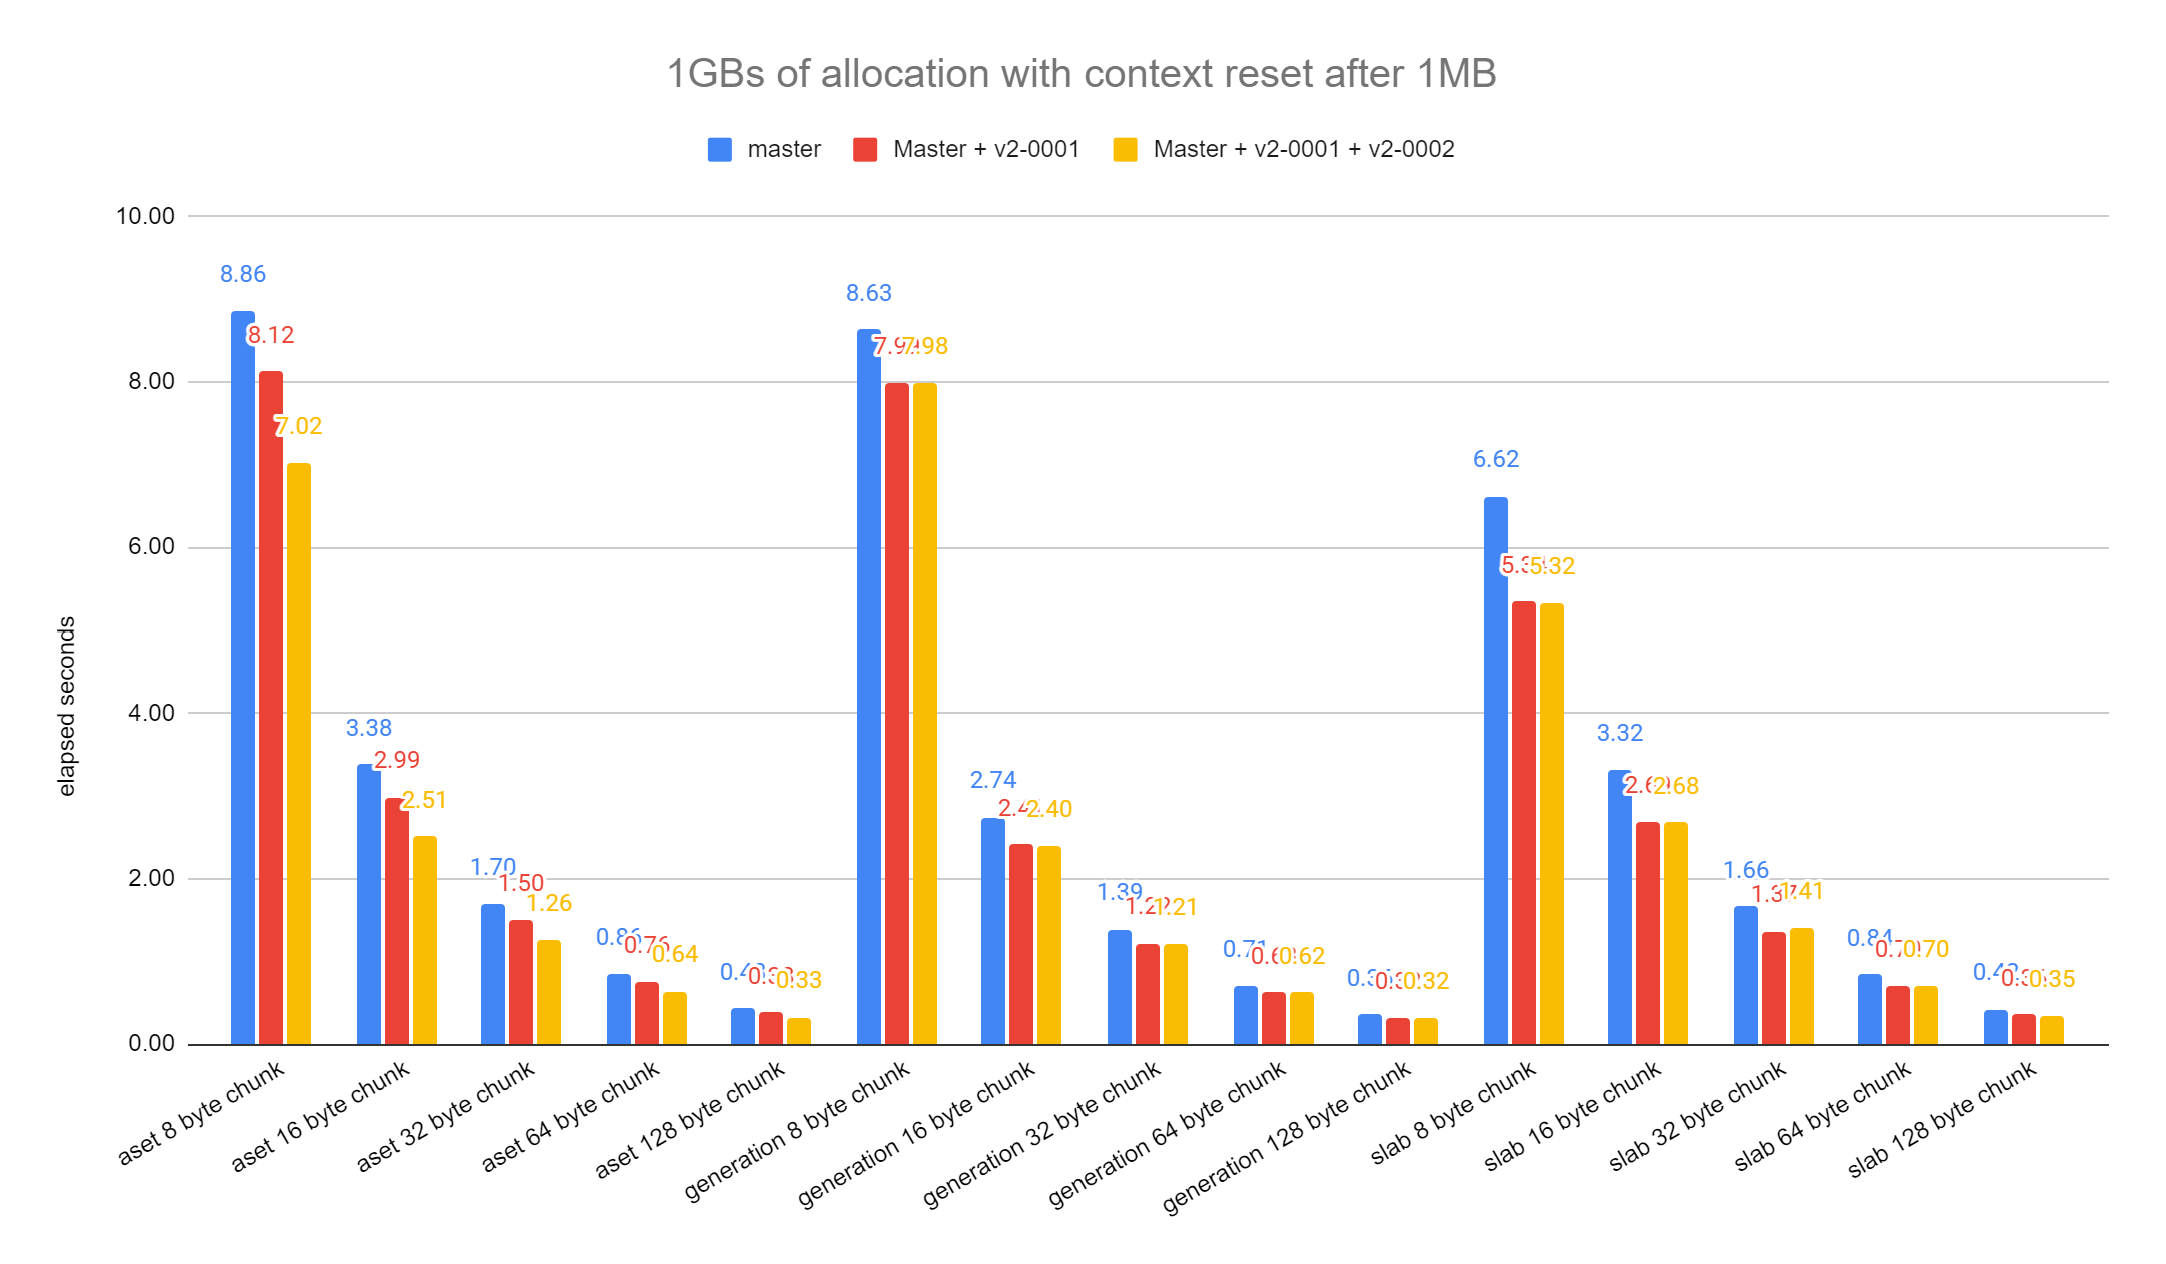
I don't understand the benchmark point though. Your benchmark seems to suggest
that 0002 improves aset performance by *more* than 0001: for 8 byte aset
allocs:
time
master: 8.86
0001: 8.12
0002: 7.02
So 0001 reduces time by 0.92x and 0002 by 0.86x.
John's test shows basically no change for 0002 - which is unsurprising, as
0002 changes aset.c, but the test seems to solely exercise slab, as only
SlabAlloc() shows up in the profile. As 0002 only touches aset.c it couldn't
really have affected that test.
> In absence of anyone else looking at this, I think it's ready to go.
> If anyone is following along and wants to review or test it, please do
> so soon.
Makes sense!
> @@ -1061,6 +1072,16 @@ MemoryContextAlloc(MemoryContext context, Size size)
>
> context->isReset = false;
>
For a moment this made me wonder if we could move the isReset handling into
the allocator slow paths as well - it's annoying to write that bit (and thus
dirty the cacheline) over and ove. But it'd be somewhat awkward due to
pre-allocated blocks. So that'd be a larger change better done separately.
Greetings,
Andres Freund
Re: Avoid stack frame setup in performance critical routines using tail calls
From
David Rowley
Date:
On Fri, 23 Feb 2024 at 11:53, Andres Freund <andres@anarazel.de> wrote:
> > @@ -1061,6 +1072,16 @@ MemoryContextAlloc(MemoryContext context, Size size)
> >
> >       context->isReset = false;
> >
>
> For a moment this made me wonder if we could move the isReset handling into
> the allocator slow paths as well - it's annoying to write that bit (and thus
> dirty the cacheline) over and ove. But it'd be somewhat awkward due to
> pre-allocated blocks. So that'd be a larger change better done separately.

It makes sense to do this, but on looking closer for aset.c, it seems
like the only time we can avoid un-setting the isReset flag is when
allocating from the freelist.  We must unset it for large allocations
and for allocations that don't fit onto the existing block (the
exiting block could be the keeper block) and for allocations that
require a new block.

With the current arrangement of code in generation.c, I didn't see any
path we could skip doing context->isReset = false.

For slab.c, it's very easy and we can skip setting the isReset in most cases.

I've attached the patches I benchmarked against 449e798c7 and also the
patch I used to add a function to exercise palloc.

The query I ran was:

select chksz,mtype,pg_allocate_memory_test_reset(chksz, 1024*1024,
1024*1024*1024, mtype)
from (values(8),(16),(32),(64)) sizes(chksz),
(values('aset'),('generation'),('slab')) cxt(mtype)
order by mtype,chksz;

David
Attachment
Re: Avoid stack frame setup in performance critical routines using tail calls
From
David Rowley
Date:
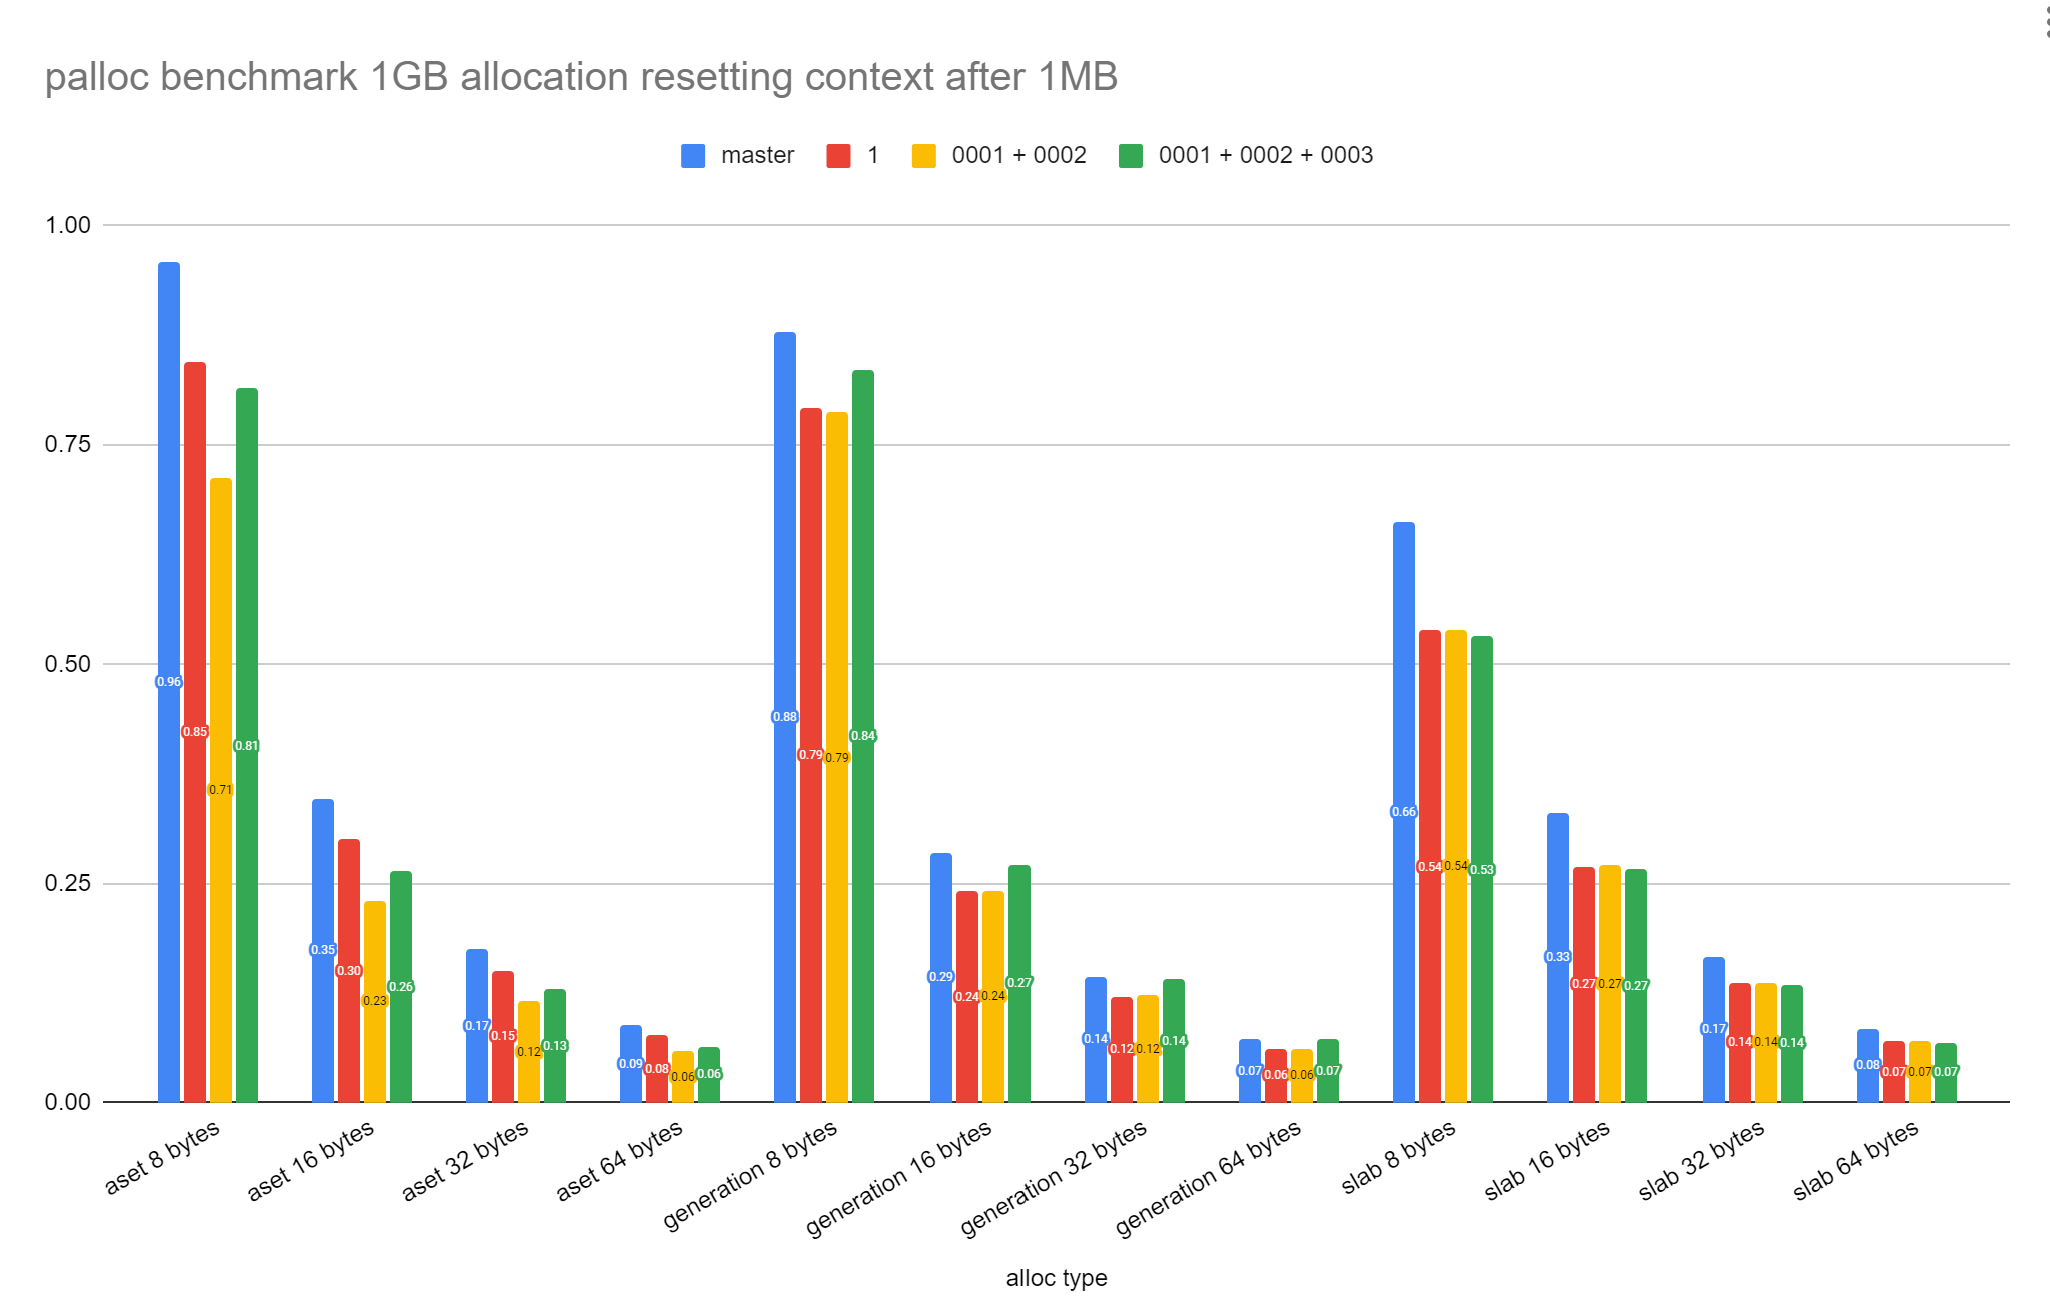
On Fri, 23 Feb 2024 at 11:53, Andres Freund <andres@anarazel.de> wrote:
>
> On 2024-02-23 00:46:26 +1300, David Rowley wrote:
> > In absence of anyone else looking at this, I think it's ready to go.
> > If anyone is following along and wants to review or test it, please do
> > so soon.
>
> Makes sense!

I pushed the 0001 and 0002 patches today.

I switched over to working on doing what you did in 0002 for
generation.c and slab.c.

See the attached patch which runs the same test as in [1] (aset.c is
just there for comparisons between slab and generation)

The attached includes some additional tuning to generation.c:

1) Changed GenerationFree() to not free() the current block when it
becomes empty. The code now just marks it as empty and reuses it.
Saves free()/malloc() cycle. Also means we can get rid of a NULL check
in GenerationAlloc().

2) Removed code in GenerationAlloc() which I felt was trying too hard
to fill the keeper, free and current block.  The changes I made here
do mean that once the keeper block becomes empty, it won't be used
again until the context is reset and gets a new allocation.  I don't
see this as a big issue as the keeper block is small anyway.

generation.c is now ~30% faster for the 8-byte test.

David

[1] https://postgr.es/m/CAApHDvqss7-a9c51nj+f9xyAr15wjLB6teHsxPe-NwLCNqiJbg@mail.gmail.com
Attachment
Re: Avoid stack frame setup in performance critical routines using tail calls
From
David Rowley
Date:
On Thu, 29 Feb 2024 at 00:29, David Rowley <dgrowleyml@gmail.com> wrote:
> I switched over to working on doing what you did in 0002 for
> generation.c and slab.c.
>
> See the attached patch which runs the same test as in [1] (aset.c is
> just there for comparisons between slab and generation)
>
> The attached includes some additional tuning to generation.c:

I've now pushed this.

David

> [1] https://postgr.es/m/CAApHDvqss7-a9c51nj+f9xyAr15wjLB6teHsxPe-NwLCNqiJbg@mail.gmail.com
Re: Avoid stack frame setup in performance critical routines using tail calls
From
Andres Freund
Date:
Hi,

On 2024-03-04 17:43:50 +1300, David Rowley wrote:
> On Thu, 29 Feb 2024 at 00:29, David Rowley <dgrowleyml@gmail.com> wrote:
> > I switched over to working on doing what you did in 0002 for
> > generation.c and slab.c.
> >
> > See the attached patch which runs the same test as in [1] (aset.c is
> > just there for comparisons between slab and generation)
> >
> > The attached includes some additional tuning to generation.c:
>
> I've now pushed this.

Thanks for working on all these, much appreciated!

Greetings,

Andres Freund