Thread: "order by" and "order by asc" returning different results on date field
I have a table that I'm using to log results from my system. It has a field "created timestamp default current_timestamp."
Running the query "select * from tbl_log order by created asc;" works as expected.
Running the query "select * from tbl_log order by created;" returns sorted chunks of 2000 records.
Regards,
Rick Gentry
-----------------
Zenus, Inc.
Rick Gentry <rick.gentry@zenus-biometrics.com> writes:
> I have a table that I'm using to log results from my system.  It has a
> field "created timestamp default current_timestamp."

> Running the query "select * from tbl_log order by created asc;" works as
> expected.

> Running the query "select * from tbl_log order by created;" returns sorted
> chunks of 2000 records.

It's quite hard to believe that the ASC annotation affects anything;
it's easily proven that PG's parser creates identical parsetrees for those
two statements.  I have to guess that there is some other effect involved
here.

To start with, what PG version is this, what do you mean exactly by
"sorted chunks", and what client-side code are you using?  Can you
create a self-contained example of the misbehavior?

            regards, tom lane
PostgreSQL 9.6.6 on x86_64-pc-linux-gnu, compiled by gcc (GCC) 4.8.3 20140911 (Red Hat 4.8.3-9), 64-bit
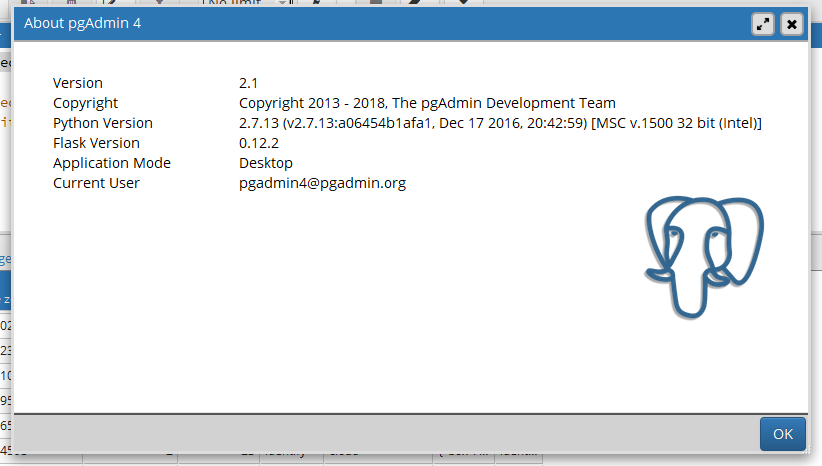
Connecting with pgAdmin 4.
The result set looks like some form of merge sort was being performed, but the system decided to skip the last few merge iterations.
You're correct, the statement I've sent does not reproduce the issue. The actual query I'm using is much longer, but I've managed to reproduce the issue with "select * from tbl_recognition_logging where action='identify' order by created". 'action' is a text field and I see that pgAdmin 4 highlights it like a reserved word.
Regards,
Rick Gentry
-----------------
Zenus, Inc.
On Tue, May 15, 2018 at 1:59 PM, Tom Lane <tgl@sss.pgh.pa.us> wrote:
Rick Gentry <rick.gentry@zenus-biometrics.com> writes:
> I have a table that I'm using to log results from my system. It has a
> field "created timestamp default current_timestamp."
> Running the query "select * from tbl_log order by created asc;" works as
> expected.
> Running the query "select * from tbl_log order by created;" returns sorted
> chunks of 2000 records.
It's quite hard to believe that the ASC annotation affects anything;
it's easily proven that PG's parser creates identical parsetrees for those
two statements. I have to guess that there is some other effect involved
here.
To start with, what PG version is this, what do you mean exactly by
"sorted chunks", and what client-side code are you using? Can you
create a self-contained example of the misbehavior?
regards, tom lane
Rick Gentry <rick.gentry@zenus-biometrics.com> writes:
> PostgreSQL 9.6.6 on x86_64-pc-linux-gnu, compiled by gcc (GCC) 4.8.3
> 20140911 (Red Hat 4.8.3-9), 64-bit

Hm.  You might try updating to current (9.6.9), though this doesn't
sound much like any recent bug fix.

> The result set looks like some form of merge sort was being performed, but
> the system decided to skip the last few merge iterations.
>
> You're correct, the statement I've sent does not reproduce the issue.  The
> actual query I'm using is much longer, but I've managed to reproduce the
> issue with "select * from tbl_recognition_logging where action='identify'
> order by created".  'action' is a text field and I see that pgAdmin 4
> highlights it like a reserved word.

Can we see EXPLAIN ANALYZE output for both the working and non-working
cases?

If the system is relying on an indexscan to produce the sort ordering,
it's possible that this traces to some kind of index corruption.  But
that's purely a guess.

On the whole, I think we're going to need a self-contained test case
to get far with this.

            regards, tom lane
Table definition:
create table tbl_recognition_logging(
created timestamp default current_timestamp,
account_id int not null,
group_id int not null,
action text not null,
environment text not null,
result text not null
);
Without 'asc':
[
{
"Execution Time": 97.782,
"Planning Time": 0.057,
"Plan": {
"Temp Written Blocks": 950,
"Sort Key": [
"tbl_recognition_logging.created"
],
"Node Type": "Sort",
"Sort Space Used": 7600,
"Actual Total Time": 84.425,
"Shared Hit Blocks": 1171,
"Plans": [
{
"Node Type": "Seq Scan",
"Actual Total Time": 20.459,
"Shared Hit Blocks": 1171,
"Schema": "public",
"Shared Read Blocks": 0,
"Relation Name": "tbl_recognition_logging",
"Local Hit Blocks": 0,
"Local Dirtied Blocks": 0,
"Temp Written Blocks": 0,
"Plan Width": 118,
"Total Cost": 1958.04,
"Actual Startup Time": 0.014,
"Filter": "(tbl_recognition_logging.action = 'identify'::text)",
"Alias": "tbl_recognition_logging",
"Temp Read Blocks": 0,
"Output": [
"created",
"account_id",
"group_id",
"action",
"environment",
"result"
],
"Local Read Blocks": 0,
"Startup Cost": 0,
"Shared Dirtied Blocks": 0,
"Shared Written Blocks": 0,
"Local Written Blocks": 0,
"Plan Rows": 60031,
"Parallel Aware": false,
"Actual Rows": 59720,
"Parent Relationship": "Outer",
"Actual Loops": 1,
"Rows Removed by Filter": 2849
}
],
"Shared Read Blocks": 0,
"Local Hit Blocks": 0,
"Local Dirtied Blocks": 0,
"Sort Method": "external sort",
"Plan Width": 118,
"Actual Loops": 1,
"Actual Startup Time": 67.139,
"Temp Read Blocks": 950,
"Output": [
"created",
"account_id",
"group_id",
"action",
"environment",
"result"
],
"Local Read Blocks": 0,
"Shared Written Blocks": 0,
"Startup Cost": 10418.52,
"Shared Dirtied Blocks": 0,
"Sort Space Type": "Disk",
"Local Written Blocks": 0,
"Plan Rows": 60031,
"Parallel Aware": false,
"Actual Rows": 59720,
"Total Cost": 10568.6
},
"Triggers": []
}
]
With asc:
[
{
"Execution Time": 97.447,
"Planning Time": 0.053,
"Plan": {
"Temp Written Blocks": 950,
"Sort Key": [
"tbl_recognition_logging.created"
],
"Node Type": "Sort",
"Sort Space Used": 7600,
"Actual Total Time": 84.076,
"Shared Hit Blocks": 1171,
"Plans": [
{
"Node Type": "Seq Scan",
"Actual Total Time": 20.507,
"Shared Hit Blocks": 1171,
"Schema": "public",
"Shared Read Blocks": 0,
"Relation Name": "tbl_recognition_logging",
"Local Hit Blocks": 0,
"Local Dirtied Blocks": 0,
"Temp Written Blocks": 0,
"Plan Width": 118,
"Total Cost": 1958.04,
"Actual Startup Time": 0.012,
"Filter": "(tbl_recognition_logging.action = 'identify'::text)",
"Alias": "tbl_recognition_logging",
"Temp Read Blocks": 0,
"Output": [
"created",
"account_id",
"group_id",
"action",
"environment",
"result"
],
"Local Read Blocks": 0,
"Startup Cost": 0,
"Shared Dirtied Blocks": 0,
"Shared Written Blocks": 0,
"Local Written Blocks": 0,
"Plan Rows": 60031,
"Parallel Aware": false,
"Actual Rows": 59720,
"Parent Relationship": "Outer",
"Actual Loops": 1,
"Rows Removed by Filter": 2849
}
],
"Shared Read Blocks": 0,
"Local Hit Blocks": 0,
"Local Dirtied Blocks": 0,
"Sort Method": "external sort",
"Plan Width": 118,
"Actual Loops": 1,
"Actual Startup Time": 66.835,
"Temp Read Blocks": 950,
"Output": [
"created",
"account_id",
"group_id",
"action",
"environment",
"result"
],
"Local Read Blocks": 0,
"Shared Written Blocks": 0,
"Startup Cost": 10418.52,
"Shared Dirtied Blocks": 0,
"Sort Space Type": "Disk",
"Local Written Blocks": 0,
"Plan Rows": 60031,
"Parallel Aware": false,
"Actual Rows": 59720,
"Total Cost": 10568.6
},
"Triggers": []
}
]
Creating a "self contained test case" is out of scope for me considering my current workload, but I'm happy to answer any questions. Additionally, I just ran "select * from tbl_recognition_logging order by created;" again and found that the results are not properly ordered.
Regards,
Rick Gentry
-----------------
Zenus, Inc.
On Tue, May 15, 2018 at 3:06 PM, Tom Lane <tgl@sss.pgh.pa.us> wrote:
Rick Gentry <rick.gentry@zenus-biometrics.com> writes:
> PostgreSQL 9.6.6 on x86_64-pc-linux-gnu, compiled by gcc (GCC) 4.8.3
> 20140911 (Red Hat 4.8.3-9), 64-bit
Hm. You might try updating to current (9.6.9), though this doesn't
sound much like any recent bug fix.
> The result set looks like some form of merge sort was being performed, but
> the system decided to skip the last few merge iterations.
>
> You're correct, the statement I've sent does not reproduce the issue. The
> actual query I'm using is much longer, but I've managed to reproduce the
> issue with "select * from tbl_recognition_logging where action='identify'
> order by created". 'action' is a text field and I see that pgAdmin 4
> highlights it like a reserved word.
Can we see EXPLAIN ANALYZE output for both the working and non-working
cases?
If the system is relying on an indexscan to produce the sort ordering,
it's possible that this traces to some kind of index corruption. But
that's purely a guess.
On the whole, I think we're going to need a self-contained test case
to get far with this.
regards, tom lane
Attachment
Re: "order by" and "order by asc" returning different results on date field
From
Feike Steenbergen
Date:
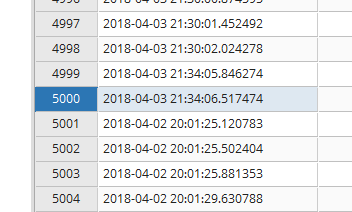
The anamoly occurs at exactly line 5000 is that consistently the case?
It might be your client playing tricks on you, can you reproduce the issue in psql?
Regards,
Feike
Feike,
After running a couple tests outside of the pgAdmin 4 client, I failed to reproduce the issue. It appears that you're correct and the client is the source of the issue.
Regards,
Rick Gentry
-----------------
Zenus, Inc.
On Wed, May 16, 2018 at 11:44 AM, Feike Steenbergen <feikesteenbergen@gmail.com> wrote:
The anamoly occurs at exactly line 5000 is that consistently the case?It might be your client playing tricks on you, can you reproduce the issue in psql?Regards,Feike