Re: "order by" and "order by asc" returning different results on date field - Mailing list pgsql-bugs
| From | Rick Gentry |
|---|---|
| Subject | Re: "order by" and "order by asc" returning different results on date field |
| Date | |
| Msg-id | CAF0U+Fke5wprufnq2O5QYBh5dshRZL4KAtagb+wrd30FzXnZYQ@mail.gmail.com Whole thread |
| In response to | Re: "order by" and "order by asc" returning different results on date field (Tom Lane <tgl@sss.pgh.pa.us>) |
| Responses |
Re: "order by" and "order by asc" returning different results on date field
|
| List | pgsql-bugs |
Table definition:
create table tbl_recognition_logging(
created timestamp default current_timestamp,
account_id int not null,
group_id int not null,
action text not null,
environment text not null,
result text not null
);
Without 'asc':
[
{
"Execution Time": 97.782,
"Planning Time": 0.057,
"Plan": {
"Temp Written Blocks": 950,
"Sort Key": [
"tbl_recognition_logging.created"
],
"Node Type": "Sort",
"Sort Space Used": 7600,
"Actual Total Time": 84.425,
"Shared Hit Blocks": 1171,
"Plans": [
{
"Node Type": "Seq Scan",
"Actual Total Time": 20.459,
"Shared Hit Blocks": 1171,
"Schema": "public",
"Shared Read Blocks": 0,
"Relation Name": "tbl_recognition_logging",
"Local Hit Blocks": 0,
"Local Dirtied Blocks": 0,
"Temp Written Blocks": 0,
"Plan Width": 118,
"Total Cost": 1958.04,
"Actual Startup Time": 0.014,
"Filter": "(tbl_recognition_logging.action = 'identify'::text)",
"Alias": "tbl_recognition_logging",
"Temp Read Blocks": 0,
"Output": [
"created",
"account_id",
"group_id",
"action",
"environment",
"result"
],
"Local Read Blocks": 0,
"Startup Cost": 0,
"Shared Dirtied Blocks": 0,
"Shared Written Blocks": 0,
"Local Written Blocks": 0,
"Plan Rows": 60031,
"Parallel Aware": false,
"Actual Rows": 59720,
"Parent Relationship": "Outer",
"Actual Loops": 1,
"Rows Removed by Filter": 2849
}
],
"Shared Read Blocks": 0,
"Local Hit Blocks": 0,
"Local Dirtied Blocks": 0,
"Sort Method": "external sort",
"Plan Width": 118,
"Actual Loops": 1,
"Actual Startup Time": 67.139,
"Temp Read Blocks": 950,
"Output": [
"created",
"account_id",
"group_id",
"action",
"environment",
"result"
],
"Local Read Blocks": 0,
"Shared Written Blocks": 0,
"Startup Cost": 10418.52,
"Shared Dirtied Blocks": 0,
"Sort Space Type": "Disk",
"Local Written Blocks": 0,
"Plan Rows": 60031,
"Parallel Aware": false,
"Actual Rows": 59720,
"Total Cost": 10568.6
},
"Triggers": []
}
]
With asc:
[
{
"Execution Time": 97.447,
"Planning Time": 0.053,
"Plan": {
"Temp Written Blocks": 950,
"Sort Key": [
"tbl_recognition_logging.created"
],
"Node Type": "Sort",
"Sort Space Used": 7600,
"Actual Total Time": 84.076,
"Shared Hit Blocks": 1171,
"Plans": [
{
"Node Type": "Seq Scan",
"Actual Total Time": 20.507,
"Shared Hit Blocks": 1171,
"Schema": "public",
"Shared Read Blocks": 0,
"Relation Name": "tbl_recognition_logging",
"Local Hit Blocks": 0,
"Local Dirtied Blocks": 0,
"Temp Written Blocks": 0,
"Plan Width": 118,
"Total Cost": 1958.04,
"Actual Startup Time": 0.012,
"Filter": "(tbl_recognition_logging.action = 'identify'::text)",
"Alias": "tbl_recognition_logging",
"Temp Read Blocks": 0,
"Output": [
"created",
"account_id",
"group_id",
"action",
"environment",
"result"
],
"Local Read Blocks": 0,
"Startup Cost": 0,
"Shared Dirtied Blocks": 0,
"Shared Written Blocks": 0,
"Local Written Blocks": 0,
"Plan Rows": 60031,
"Parallel Aware": false,
"Actual Rows": 59720,
"Parent Relationship": "Outer",
"Actual Loops": 1,
"Rows Removed by Filter": 2849
}
],
"Shared Read Blocks": 0,
"Local Hit Blocks": 0,
"Local Dirtied Blocks": 0,
"Sort Method": "external sort",
"Plan Width": 118,
"Actual Loops": 1,
"Actual Startup Time": 66.835,
"Temp Read Blocks": 950,
"Output": [
"created",
"account_id",
"group_id",
"action",
"environment",
"result"
],
"Local Read Blocks": 0,
"Shared Written Blocks": 0,
"Startup Cost": 10418.52,
"Shared Dirtied Blocks": 0,
"Sort Space Type": "Disk",
"Local Written Blocks": 0,
"Plan Rows": 60031,
"Parallel Aware": false,
"Actual Rows": 59720,
"Total Cost": 10568.6
},
"Triggers": []
}
]
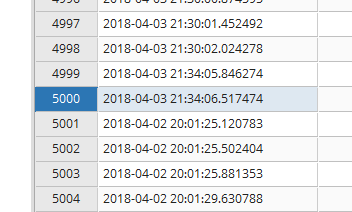
Creating a "self contained test case" is out of scope for me considering my current workload, but I'm happy to answer any questions. Additionally, I just ran "select * from tbl_recognition_logging order by created;" again and found that the results are not properly ordered.
Regards,
Rick Gentry
-----------------
Zenus, Inc.
On Tue, May 15, 2018 at 3:06 PM, Tom Lane <tgl@sss.pgh.pa.us> wrote:
Rick Gentry <rick.gentry@zenus-biometrics.com> writes:
> PostgreSQL 9.6.6 on x86_64-pc-linux-gnu, compiled by gcc (GCC) 4.8.3
> 20140911 (Red Hat 4.8.3-9), 64-bit
Hm. You might try updating to current (9.6.9), though this doesn't
sound much like any recent bug fix.
> The result set looks like some form of merge sort was being performed, but
> the system decided to skip the last few merge iterations.
>
> You're correct, the statement I've sent does not reproduce the issue. The
> actual query I'm using is much longer, but I've managed to reproduce the
> issue with "select * from tbl_recognition_logging where action='identify'
> order by created". 'action' is a text field and I see that pgAdmin 4
> highlights it like a reserved word.
Can we see EXPLAIN ANALYZE output for both the working and non-working
cases?
If the system is relying on an indexscan to produce the sort ordering,
it's possible that this traces to some kind of index corruption. But
that's purely a guess.
On the whole, I think we're going to need a self-contained test case
to get far with this.
regards, tom lane
Attachment
pgsql-bugs by date: