Thread: [PERFORM] Odd sudden performance degradation related to temp object churn
This particular db is on 9.3.15. Recently we had a serious performance degradation related to a batch job that creates 4-5 temp tables and 5 indexes. It is a really badly written job but what really confuses us is that this job has been running for years with no issue remotely approaching this one. We are also using pgpool.
The job would kick off with 20-30 of similar queries running at once. The thing normally takes only 30ms or so to run - it only operates on 1 customer at a time (yes, it's horribly written). All of a sudden the cluster started thrashing and performance seriously degraded. We tried a number of things with no success:
- Analyzed the whole database
- Turned off full logging
- Turned off synchronous commit
- Vacuumed several of the catalog tables
- Checked if we had an abnormal high amount of traffic this time - we didn't
- No abnormal disk/network issues (we would have seen much larger issues if that had been the case)
- Tried turning down the number of app nodes running
What ended up completely resolving the issue was converting the query to use ctes instead of temp tables. That means we avoided the disk writing and the catalog churn, and useless indexes. However, we are baffled as to why this could make such a big difference when we had no issue like this before, and we have seen no systematic performance degradation in our system.
Any insights would be greatly appreciated, as we are concerned not knowing the root cause.
Thanks,
Jeremy
Re: [PERFORM] Odd sudden performance degradation related to tempobject churn
From
Scott Marlowe
Date:
On Mon, Aug 14, 2017 at 1:53 PM, Jeremy Finzel <finzelj@gmail.com> wrote:
> This particular db is on 9.3.15.  Recently we had a serious performance
> degradation related to a batch job that creates 4-5 temp tables and 5
> indexes.  It is a really badly written job but what really confuses us is
> that this job has been running for years with no issue remotely approaching
> this one.  We are also using pgpool.
>
> The job would kick off with 20-30 of similar queries running at once.  The
> thing normally takes only 30ms or so to run - it only operates on 1 customer
> at a time (yes, it's horribly written).  All of a sudden the cluster started
> thrashing and performance seriously degraded.  We tried a number of things
> with no success:
>
> Analyzed the whole database
> Turned off full logging
> Turned off synchronous commit
> Vacuumed several of the catalog tables
> Checked if we had an abnormal high amount of traffic this time - we didn't
> No abnormal disk/network issues (we would have seen much larger issues if
> that had been the case)
> Tried turning down the number of app nodes running
>
> What ended up completely resolving the issue was converting the query to use
> ctes instead of temp tables.  That means we avoided the disk writing and the
> catalog churn, and useless indexes.  However, we are baffled as to why this
> could make such a big difference when we had no issue like this before, and
> we have seen no systematic performance degradation in our system.
>
> Any insights would be greatly appreciated, as we are concerned not knowing
> the root cause.

How are your disks setup? One big drive with everything on it?
Separate disks for pg_xlog and pg's data dir and the OS logging? IO
contention is one of the big killers of db performance.

Logging likely isn't your problem, but yeah you don't need to log
ERRYTHANG to see the problem either. Log long running queries temp
usage, buffer usage, query plans on slow queries, stuff like that.

You've likely hit a "tipping point" in terms of data size. Either it's
cause the query planner to make a bad decision, or you're spilling to
disk a lot more than you used to.

Be sure to log temporary stuff with log_temp_files = 0 in your
postgresql.conf and then look for temporary file in your logs. I bet
you've started spilling into the same place as your temp tables are
going, and by default that's your data directory. Adding another drive
and moving pgsql's temp table space to it might help.

Also increasing work_mem (but don't go crazy, it's per sort, so can
multiply fast on a busy server)

Also log your query plans or run explain / explain analyze on the slow
queries to see what they're doing that's so expensive.
Re: [PERFORM] Odd sudden performance degradation related to tempobject churn
From
Jeremy Finzel
Date:
On Mon, Aug 14, 2017 at 3:01 PM, Scott Marlowe <scott.marlowe@gmail.com> wrote:
How are your disks setup? One big drive with everything on it?On Mon, Aug 14, 2017 at 1:53 PM, Jeremy Finzel <finzelj@gmail.com> wrote:
> This particular db is on 9.3.15. Recently we had a serious performance
> degradation related to a batch job that creates 4-5 temp tables and 5
> indexes. It is a really badly written job but what really confuses us is
> that this job has been running for years with no issue remotely approaching
> this one. We are also using pgpool.
>
> The job would kick off with 20-30 of similar queries running at once. The
> thing normally takes only 30ms or so to run - it only operates on 1 customer
> at a time (yes, it's horribly written). All of a sudden the cluster started
> thrashing and performance seriously degraded. We tried a number of things
> with no success:
>
> Analyzed the whole database
> Turned off full logging
> Turned off synchronous commit
> Vacuumed several of the catalog tables
> Checked if we had an abnormal high amount of traffic this time - we didn't
> No abnormal disk/network issues (we would have seen much larger issues if
> that had been the case)
> Tried turning down the number of app nodes running
>
> What ended up completely resolving the issue was converting the query to use
> ctes instead of temp tables. That means we avoided the disk writing and the
> catalog churn, and useless indexes. However, we are baffled as to why this
> could make such a big difference when we had no issue like this before, and
> we have seen no systematic performance degradation in our system.
>
> Any insights would be greatly appreciated, as we are concerned not knowing
> the root cause.
Separate disks for pg_xlog and pg's data dir and the OS logging? IO
contention is one of the big killers of db performance.
It's one san volume ssd for the data and wal files. But logging and memory spilling and archived xlogs go to a local ssd disk.
Logging likely isn't your problem, but yeah you don't need to log
ERRYTHANG to see the problem either. Log long running queries temp
usage, buffer usage, query plans on slow queries, stuff like that.
You've likely hit a "tipping point" in terms of data size. Either it's
cause the query planner to make a bad decision, or you're spilling to
disk a lot more than you used to.
Be sure to log temporary stuff with log_temp_files = 0 in your
postgresql.conf and then look for temporary file in your logs. I bet
you've started spilling into the same place as your temp tables are
going, and by default that's your data directory. Adding another drive
and moving pgsql's temp table space to it might help.
We would not have competition between disk spilling and temp tables because what I described above - they are going to two different places. Also, I neglected to mention that we turned on auto-explain during this crisis, and found the query plan was good, it was just taking forever due to thrashing just seconds after we kicked off the batches. I did NOT turn on log_analyze and timing but it was enough to see there was no apparent query plan regression. Also, we had no change in the performance/plan after re-analyzing all tables.
Also increasing work_mem (but don't go crazy, it's per sort, so can
multiply fast on a busy server)
We are already up at 400MB, and this query was using memory in the low KB levels because it is very small (1 - 20 rows of data per temp table, and no expensive selects with missing indexes or anything).
Also log your query plans or run explain / explain analyze on the slow
queries to see what they're doing that's so expensive.
Yes, we did do that and there was nothing remarkable about the plan when we ran them in production. All we saw was that over time, the actual execution time (along with everything else on the entire system) started slowing down more and more as thrashing increased. But we found no evidence of a plan regression.
Thank you! Any more feedback is much appreciated.
Re: [PERFORM] Odd sudden performance degradation related to tempobject churn
From
Scott Marlowe
Date:
On Mon, Aug 14, 2017 at 2:46 PM, Jeremy Finzel <finzelj@gmail.com> wrote:
> On Mon, Aug 14, 2017 at 3:01 PM, Scott Marlowe <scott.marlowe@gmail.com>
> wrote:
>>
>> On Mon, Aug 14, 2017 at 1:53 PM, Jeremy Finzel <finzelj@gmail.com> wrote:
>> >
>> > Any insights would be greatly appreciated, as we are concerned not
>> > knowing
>> > the root cause.
>>
>> How are your disks setup? One big drive with everything on it?
>> Separate disks for pg_xlog and pg's data dir and the OS logging? IO
>> contention is one of the big killers of db performance.
>
>
> It's one san volume ssd for the data and wal files.  But logging and memory
> spilling and archived xlogs go to a local ssd disk.
>
>>
>> Logging likely isn't your problem, but yeah you don't need to log
>> ERRYTHANG to see the problem either. Log long running queries temp
>> usage, buffer usage, query plans on slow queries, stuff like that.
>>
>> You've likely hit a "tipping point" in terms of data size. Either it's
>> cause the query planner to make a bad decision, or you're spilling to
>> disk a lot more than you used to.
>>
>> Be sure to log temporary stuff with log_temp_files = 0 in your
>> postgresql.conf and then look for temporary file in your logs. I bet
>> you've started spilling into the same place as your temp tables are
>> going, and by default that's your data directory. Adding another drive
>> and moving pgsql's temp table space to it might help.
>
>
> We would not have competition between disk spilling and temp tables because
> what I described above - they are going to two different places.  Also, I
> neglected to mention that we turned on auto-explain during this crisis, and
> found the query plan was good, it was just taking forever due to thrashing
> just seconds after we kicked off the batches.  I did NOT turn on log_analyze
> and timing but it was enough to see there was no apparent query plan
> regression.  Also, we had no change in the performance/plan after
> re-analyzing all tables.

You do know that temp tables go into the default temp table space,
just like sorts, right?

Have you used something like iostat to see which volume is getting all the IO?

>
>>
>> Also increasing work_mem (but don't go crazy, it's per sort, so can
>> multiply fast on a busy server)
>
>
> We are already up at 400MB, and this query was using memory in the low KB
> levels because it is very small (1 - 20 rows of data per temp table, and no
> expensive selects with missing indexes or anything).

Ahh so it doesn't sound like it's spilling to disk then. Do the logs
say yes or no on that?

Basically use unix tools to look for where you're thrashing. iotop can
be handy too.
Re: [PERFORM] Odd sudden performance degradation related to tempobject churn
From
Scott Marlowe
Date:
Also if you're using newly loaded data the db could be setting hint
bits on the first select etc.
Re: [PERFORM] Odd sudden performance degradation related to temp object churn
From
Jerry Sievers
Date:
Scott Marlowe <scott.marlowe@gmail.com> writes:

> On Mon, Aug 14, 2017 at 2:46 PM, Jeremy Finzel <finzelj@gmail.com> wrote:
>
>> On Mon, Aug 14, 2017 at 3:01 PM, Scott Marlowe <scott.marlowe@gmail.com>
>> wrote:
>>>
>>> On Mon, Aug 14, 2017 at 1:53 PM, Jeremy Finzel <finzelj@gmail.com> wrote:
>>> >
>>> > Any insights would be greatly appreciated, as we are concerned not
>>> > knowing
>>> > the root cause.
>>>
>>> How are your disks setup? One big drive with everything on it?
>>> Separate disks for pg_xlog and pg's data dir and the OS logging? IO
>>> contention is one of the big killers of db performance.
>>
>>
>> It's one san volume ssd for the data and wal files.  But logging and memory
>> spilling and archived xlogs go to a local ssd disk.
>>
>>>
>>> Logging likely isn't your problem, but yeah you don't need to log
>>> ERRYTHANG to see the problem either. Log long running queries temp
>>> usage, buffer usage, query plans on slow queries, stuff like that.
>>>
>>> You've likely hit a "tipping point" in terms of data size. Either it's
>>> cause the query planner to make a bad decision, or you're spilling to
>>> disk a lot more than you used to.
>>>
>>> Be sure to log temporary stuff with log_temp_files = 0 in your
>>> postgresql.conf and then look for temporary file in your logs. I bet
>>> you've started spilling into the same place as your temp tables are
>>> going, and by default that's your data directory. Adding another drive
>>> and moving pgsql's temp table space to it might help.
>>
>>
>> We would not have competition between disk spilling and temp tables because
>> what I described above - they are going to two different places.  Also, I
>> neglected to mention that we turned on auto-explain during this crisis, and
>> found the query plan was good, it was just taking forever due to thrashing
>> just seconds after we kicked off the batches.  I did NOT turn on log_analyze
>> and timing but it was enough to see there was no apparent query plan
>> regression.  Also, we had no change in the performance/plan after
>> re-analyzing all tables.
>
> You do know that temp tables go into the default temp table space,
> just like sorts, right?

Not so.

This system has no defined temp_tablespace however spillage due to
sorting/hashing that exceeds work_mem goes to base/pgsql_tmp which we
have symlinked out to a local SSD drive.

We do run a few of our other systems with temp_tablespace defined and
for these the heap/index files do share same volume as other temp usage.

Thx


>
> Have you used something like iostat to see which volume is getting all the IO?
>
>>
>>>
>>> Also increasing work_mem (but don't go crazy, it's per sort, so can
>>> multiply fast on a busy server)
>>
>>
>> We are already up at 400MB, and this query was using memory in the low KB
>> levels because it is very small (1 - 20 rows of data per temp table, and no
>> expensive selects with missing indexes or anything).
>
> Ahh so it doesn't sound like it's spilling to disk then. Do the logs
> say yes or no on that?
>
> Basically use unix tools to look for where you're thrashing. iotop can
> be handy too.

--
Jerry Sievers
Postgres DBA/Development Consulting
e: postgres.consulting@comcast.net
p: 312.241.7800
Re: [PERFORM] Odd sudden performance degradation related to tempobject churn
From
Peter Geoghegan
Date:
On Mon, Aug 14, 2017 at 12:53 PM, Jeremy Finzel <finzelj@gmail.com> wrote:
> This particular db is on 9.3.15.  Recently we had a serious performance
> degradation related to a batch job that creates 4-5 temp tables and 5
> indexes.  It is a really badly written job but what really confuses us is
> that this job has been running for years with no issue remotely approaching
> this one.  We are also using pgpool.

Did you happen to notice that this occurred when you upgrading point
release? If so, what version did you move from/to?

--
Peter Geoghegan
Re: [PERFORM] Odd sudden performance degradation related to temp object churn
From
Jerry Sievers
Date:
Peter Geoghegan <pg@bowt.ie> writes:

> On Mon, Aug 14, 2017 at 12:53 PM, Jeremy Finzel <finzelj@gmail.com> wrote:
>
>> This particular db is on 9.3.15.  Recently we had a serious performance
>> degradation related to a batch job that creates 4-5 temp tables and 5
>> indexes.  It is a really badly written job but what really confuses us is
>> that this job has been running for years with no issue remotely approaching
>> this one.  We are also using pgpool.
>
> Did you happen to notice that this occurred when you upgrading point
> release? If so, what version did you move from/to?

The system was last started back in November.  Running 9.3.15.

Not aware of any host system libs or whatever change recently but will investigate.

>
> --
> Peter Geoghegan

--
Jerry Sievers
Postgres DBA/Development Consulting
e: postgres.consulting@comcast.net
p: 312.241.7800
Re: [PERFORM] Odd sudden performance degradation related to tempobject churn
From
Scott Marlowe
Date:
On Mon, Aug 14, 2017 at 4:16 PM, Jerry Sievers <gsievers19@comcast.net> wrote:
> Scott Marlowe <scott.marlowe@gmail.com> writes:
>
>> You do know that temp tables go into the default temp table space,
>> just like sorts, right?
>
> Not so.
>
> This system has no defined temp_tablespace however spillage due to
> sorting/hashing that exceeds work_mem goes to base/pgsql_tmp which we
> have symlinked out to a local SSD drive.

Which is also where temp tables are created.
Re: [PERFORM] Odd sudden performance degradation related to tempobject churn
From
Jeremy Finzel
Date:
> Not so.
>
> This system has no defined temp_tablespace however spillage due to
> sorting/hashing that exceeds work_mem goes to base/pgsql_tmp which we
> have symlinked out to a local SSD drive.
Which is also where temp tables are created.
This isn't true, at least in our environment. Just as proof, I have created a couple of temp tables, and querying the relfilenodes, they only show up under base/<dbid>/t4_<relfilenode>:
test=# CREATE TEMP TABLE foo(id int);
CREATE TABLE
test=# INSERT INTO foo SELECT * FROM generate_series(1,100);
INSERT 0 100
test=# CREATE TEMP TABLE bar();
CREATE TABLE
test=# SELECT relfilenode FROM pg_class WHERE relname IN('foo','bar');
relfilenode
-------------
20941
20944
(2 rows)
postgres@foo:/san/<cluster>/pgdata/base$ ls -l
total 44
drwx------ 2 postgres postgres 4096 Jul 7 15:19 1
drwx------ 2 postgres postgres 4096 Nov 29 2016 12408
drwx------ 2 postgres postgres 4096 Jul 14 14:00 12409
drwx------ 2 postgres postgres 12288 Jul 7 15:19 18289
drwx------ 2 postgres postgres 12288 Jul 7 15:19 18803
drwx------ 2 postgres postgres 4096 Jul 7 15:19 20613
drwx------ 2 postgres postgres 4096 Aug 15 08:06 20886
lrwxrwxrwx 1 postgres postgres 30 Jul 7 15:15 pgsql_tmp -> /local/pgsql_tmp/9.6/<cluster>
postgres@pgsnap05:/san/<cluster>/pgdata/base$ ls -l 20886 | grep '20941\|20944'
-rw------- 1 postgres postgres 8192 Aug 15 10:55 t4_20941
-rw------- 1 postgres postgres 0 Aug 15 10:55 t4_20944
postgres@pgsnap05:/san/dba_dev_d/pgdata/base$ cd pgsql_tmp
postgres@pgsnap05:/san/dba_dev_d/pgdata/base/pgsql_tmp$ ls -l
total 0
Re: [PERFORM] Odd sudden performance degradation related to tempobject churn
From
Scott Marlowe
Date:
Oh yeah, sorry. Was looking at a different system where we were using
a tablespace for temp tables.

On Tue, Aug 15, 2017 at 10:00 AM, Jeremy Finzel <finzelj@gmail.com> wrote:
>> > Not so.
>> >
>> > This system has no defined temp_tablespace however spillage due to
>> > sorting/hashing that exceeds work_mem goes to base/pgsql_tmp which we
>> > have symlinked out to a local SSD drive.
>>
>> Which is also where temp tables are created.
>
>
> This isn't true, at least in our environment.  Just as proof, I have created
> a couple of temp tables, and querying the relfilenodes, they only show up
> under base/<dbid>/t4_<relfilenode>:
>
> test=# CREATE TEMP TABLE foo(id int);
> CREATE TABLE
> test=# INSERT INTO foo SELECT * FROM generate_series(1,100);
> INSERT 0 100
> test=# CREATE TEMP TABLE bar();
> CREATE TABLE
> test=# SELECT relfilenode FROM pg_class WHERE relname IN('foo','bar');
>  relfilenode
> -------------
>        20941
>        20944
> (2 rows)
>
> postgres@foo:/san/<cluster>/pgdata/base$ ls -l
> total 44
> drwx------ 2 postgres postgres  4096 Jul  7 15:19 1
> drwx------ 2 postgres postgres  4096 Nov 29  2016 12408
> drwx------ 2 postgres postgres  4096 Jul 14 14:00 12409
> drwx------ 2 postgres postgres 12288 Jul  7 15:19 18289
> drwx------ 2 postgres postgres 12288 Jul  7 15:19 18803
> drwx------ 2 postgres postgres  4096 Jul  7 15:19 20613
> drwx------ 2 postgres postgres  4096 Aug 15 08:06 20886
> lrwxrwxrwx 1 postgres postgres    30 Jul  7 15:15 pgsql_tmp ->
> /local/pgsql_tmp/9.6/<cluster>
>
> postgres@pgsnap05:/san/<cluster>/pgdata/base$ ls -l 20886 | grep
> '20941\|20944'
> -rw------- 1 postgres postgres      8192 Aug 15 10:55 t4_20941
> -rw------- 1 postgres postgres      0 Aug 15 10:55 t4_20944
> postgres@pgsnap05:/san/dba_dev_d/pgdata/base$ cd pgsql_tmp
> postgres@pgsnap05:/san/dba_dev_d/pgdata/base/pgsql_tmp$ ls -l
> total 0


--
To understand recursion, one must first understand recursion.
Re: [PERFORM] Odd sudden performance degradation related to tempobject churn
From
Scott Marlowe
Date:
On Mon, Aug 14, 2017 at 5:10 PM, Jerry Sievers <gsievers19@comcast.net> wrote:
> Peter Geoghegan <pg@bowt.ie> writes:
>
>> On Mon, Aug 14, 2017 at 12:53 PM, Jeremy Finzel <finzelj@gmail.com> wrote:
>>
>>> This particular db is on 9.3.15.  Recently we had a serious performance
>>> degradation related to a batch job that creates 4-5 temp tables and 5
>>> indexes.  It is a really badly written job but what really confuses us is
>>> that this job has been running for years with no issue remotely approaching
>>> this one.  We are also using pgpool.
>>
>> Did you happen to notice that this occurred when you upgrading point
>> release? If so, what version did you move from/to?
>
> The system was last started back in November.  Running 9.3.15.
>
> Not aware of any host system libs or whatever change recently but will investigate.

So do iostat or iotop show you if / where your disks are working
hardest? Or is this CPU overhead that's killing performance?
Re: [PERFORM] Odd sudden performance degradation related to tempobject churn
From
Jeremy Finzel
Date:
On Tue, Aug 15, 2017 at 12:07 PM, Scott Marlowe <scott.marlowe@gmail.com> wrote:
So do iostat or iotop show you if / where your disks are working
hardest? Or is this CPU overhead that's killing performance?
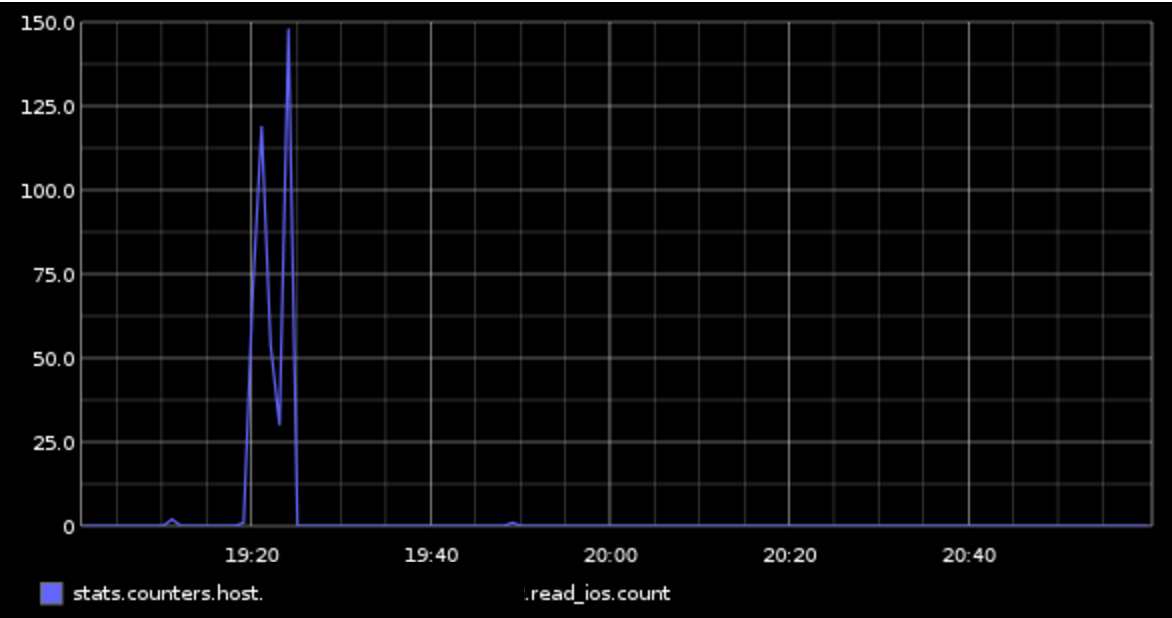
Sorry for the delayed reply. I took a look in more detail at the query plans from our problem query during this incident. There are actually 6 plans, because there were 6 unique queries. I traced one query through our logs, and found something really interesting. That is that all of the first 5 queries are creating temp tables, and all of them took upwards of 500ms each to run. The final query, however, is a simple select from the last temp table, and that query took 0.035ms! This really confirms that somehow, the issue had to do with writing to the SAN, I think. Of course this doesn't answer a whole lot, because we had no other apparent issues with write performance at all.
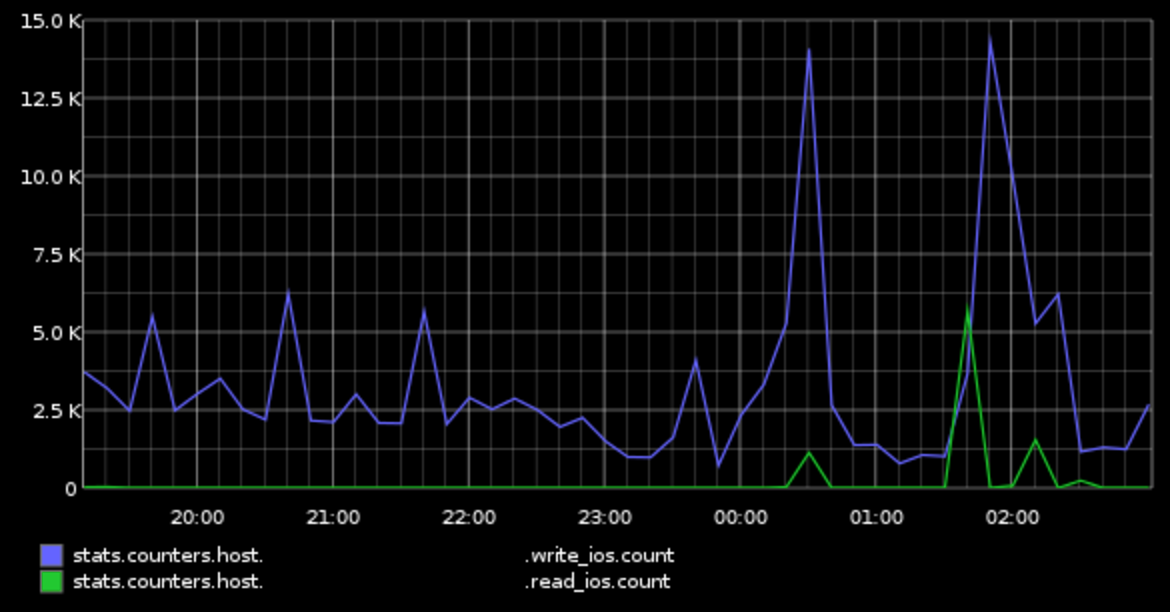
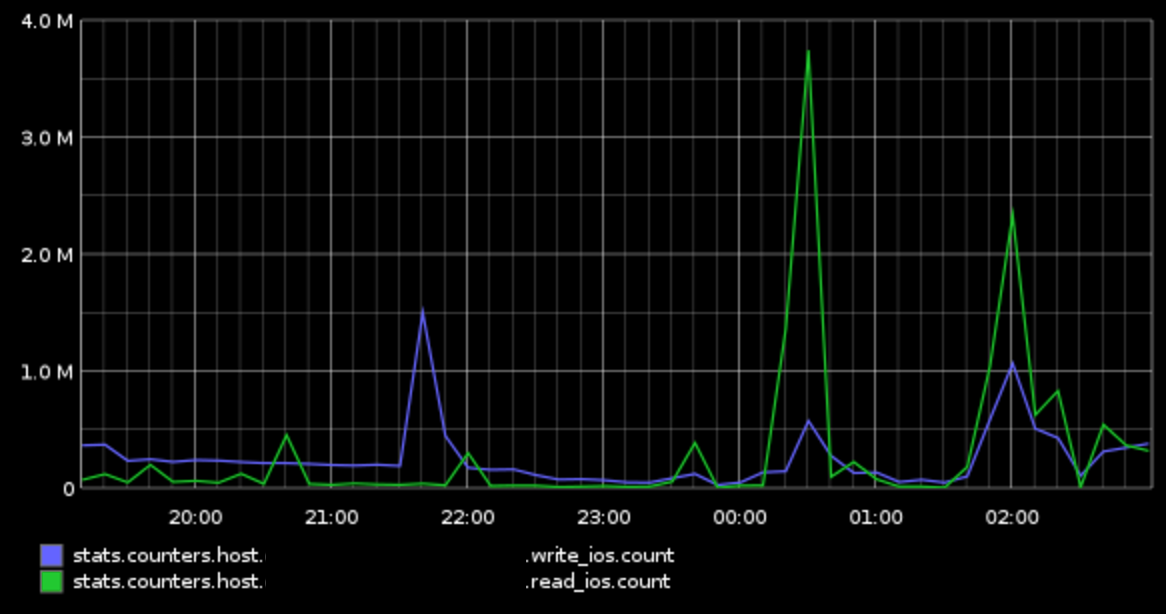
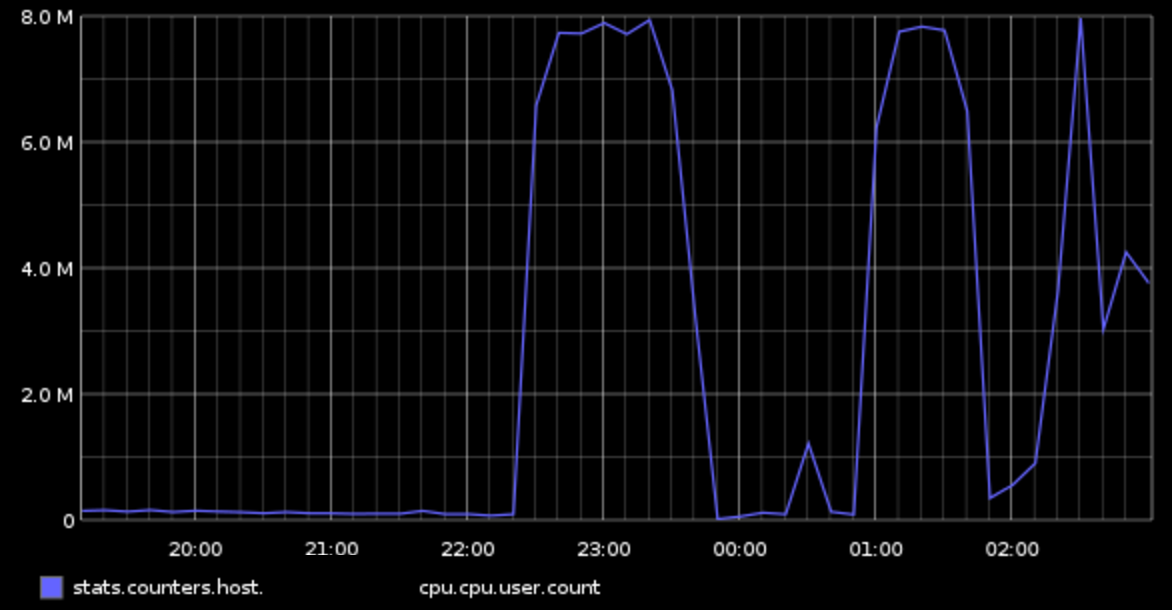
I also provide some graphs below.
7pm-3am on 8/10 (first incidents were around 10:30pm, other incidents ~1am, 2am):
Local Disk IO:
SAN IO:
CPU:
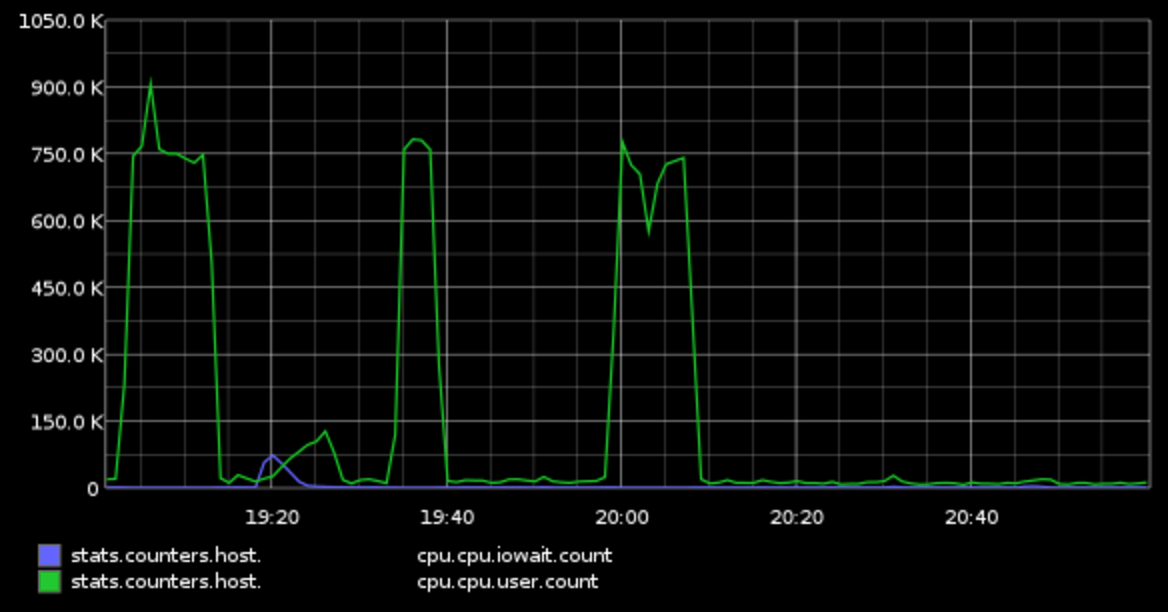
7-9pm on 8/10 (controlled attempts starting a little after 7):
CPU:
Write IO on SAN:

Read IO on Local disk:
Write IO on Local disk:

Re: [PERFORM] Odd sudden performance degradation related to tempobject churn
From
Mark Kirkwood
Date:
On 19/08/17 02:21, Jeremy Finzel wrote:
> On Tue, Aug 15, 2017 at 12:07 PM, Scott Marlowe
> <scott.marlowe@gmail.com <mailto:scott.marlowe@gmail.com>> wrote:
>
>     So do iostat or iotop show you if / where your disks are working
>     hardest? Or is this CPU overhead that's killing performance?
>
>
> Sorry for the delayed reply. I took a look in more detail at the query
> plans from our problem query during this incident. There are actually
> 6 plans, because there were 6 unique queries.  I traced one query
> through our logs, and found something really interesting. That is that
> all of the first 5 queries are creating temp tables, and all of them
> took upwards of 500ms each to run.  The final query, however, is a
> simple select from the last temp table, and that query took 0.035ms!
> This really confirms that somehow, the issue had to do with /writing
> /to the SAN, I think.  Of course this doesn't answer a whole lot,
> because we had no other apparent issues with write performance at all.
>
> I also provide some graphs below.
>
>
Hi, graphs for latency (or await etc) might be worth looking at too -
sometimes the troughs between the IO spikes are actually when the disks
have been overwhelmed with queued up pending IOs...

Also SANs are notorious for this sort of thing - typically they have a
big RAM cache that you are actually writing to, and everything is nice
and fast until your workload (along with everyone else's) fills up the
cache and then performance drops of a cliff for a while (I've seen SAN
disks with iostat utilizations of 105% <-- Lol... and await numbers that
scroll off the page in that scenario)!

regards
Mark
Re: [PERFORM] Odd sudden performance degradation related to tempobject churn
From
Mark Kirkwood
Date:
On 19/08/17 13:49, Mark Kirkwood wrote:

>
>
> On 19/08/17 02:21, Jeremy Finzel wrote:
>> On Tue, Aug 15, 2017 at 12:07 PM, Scott Marlowe
>> <scott.marlowe@gmail.com <mailto:scott.marlowe@gmail.com>> wrote:
>>
>>     So do iostat or iotop show you if / where your disks are working
>>     hardest? Or is this CPU overhead that's killing performance?
>>
>>
>> Sorry for the delayed reply. I took a look in more detail at the
>> query plans from our problem query during this incident. There are
>> actually 6 plans, because there were 6 unique queries.  I traced one
>> query through our logs, and found something really interesting. That
>> is that all of the first 5 queries are creating temp tables, and all
>> of them took upwards of 500ms each to run.  The final query, however,
>> is a simple select from the last temp table, and that query took
>> 0.035ms!  This really confirms that somehow, the issue had to do with
>> /writing /to the SAN, I think.  Of course this doesn't answer a whole
>> lot, because we had no other apparent issues with write performance
>> at all.
>>
>> I also provide some graphs below.
>>
>>
> Hi, graphs for latency (or await etc) might be worth looking at too -
> sometimes the troughs between the IO spikes are actually when the
> disks have been overwhelmed with queued up pending IOs...
>
>

Sorry - I see you *did* actually have iowait in there under your CPU
graph...which doesn't look to be showing up a lot of waiting. However
still might be well worth getting graphs showing per device waits and
utilizations.

regards

Mark