Thread: Checkpoint distribution
Hi all.
--
I’m running PostgreSQL 9.3.4 and doing stress test of the database with writing only load. The test plan does 1000 transactions per second (each of them does several updates/inserts). The problem is that checkpoint is not distributed over time well. When the checkpoint finishes, the db gets lots of I/O operations and response timings grows strongly.
My checkpoint settings looks like that:
postgres=# select name, setting from pg_catalog.pg_settings where name like 'checkpoint%' and boot_val != reset_val;
name | setting
------------------------------+---------
checkpoint_completion_target | 0.9
checkpoint_segments | 100500
checkpoint_timeout | 600
(3 rows)
postgres=#
But in the log I see that checkpoint continues less than 600*0.9 = 540 seconds:
2014-04-14 12:54:41.479 MSK,,,10517,,53468da6.2915,433,,2014-04-10 16:25:10 MSK,,0,LOG,00000,"checkpoint starting: time",,,,,,,,,""
2014-04-14 12:57:06.107 MSK,,,10517,,53468da6.2915,434,,2014-04-10 16:25:10 MSK,,0,LOG,00000,"checkpoint complete: wrote 65140 buffers (24.8%); 0 transaction log file(s) added, 0 removed, 327 recycled; write=134.217 s, sync=10.292 s, total=144.627 s; sync files=31, longest=3.332 s, average=0.331 s",,,,,,,,,»"
When the checkpoint starts (12:54:41.479) dstat says that I/O load increases:
----system---- -dsk/total- --io/total-
date/time | read writ| read writ
14-04 12:54:39| 0 15M| 0 2562
14-04 12:54:40| 0 13M| 0 2330
14-04 12:54:41| 0 97M| 0 5981
14-04 12:54:42| 0 95M| 0 8869
14-04 12:54:43| 0 147M| 0 8493
14-04 12:54:44| 0 144M| 0 8316
14-04 12:54:45| 0 176M| 0 8189
14-04 12:54:46| 0 141M| 0 8221
14-04 12:54:47| 0 143M| 0 8260
14-04 12:54:48| 0 141M| 0 7576
14-04 12:54:49| 0 173M| 0 8171
But when it finishes (12:57:06.107) the I/O load is much higher than the hardware can do:
----system---- -dsk/total- --io/total-
date/time | read writ| read writ
14-04 12:56:52| 0 33M| 0 5185
14-04 12:56:53| 0 64M| 0 5271
14-04 12:56:54| 0 65M| 0 5256
14-04 12:56:55| 0 153M| 0 15.8k
14-04 12:56:56| 0 758M| 0 18.6k
14-04 12:56:57| 0 823M| 0 4164
14-04 12:56:58| 0 843M| 0 8186
14-04 12:56:59| 0 794M| 0 15.0k
14-04 12:57:00| 0 880M| 0 5954
14-04 12:57:01| 0 862M| 0 4608
14-04 12:57:02| 0 804M| 0 7387
14-04 12:57:03| 0 849M| 0 4878
14-04 12:57:04| 0 788M| 0 20.0k
14-04 12:57:05| 0 805M| 0 6004
14-04 12:57:06| 0 143M| 0 6932
14-04 12:57:07| 0 108M| 0 6150
14-04 12:57:08| 0 42M| 0 6233
14-04 12:57:09| 0 73M| 0 6248
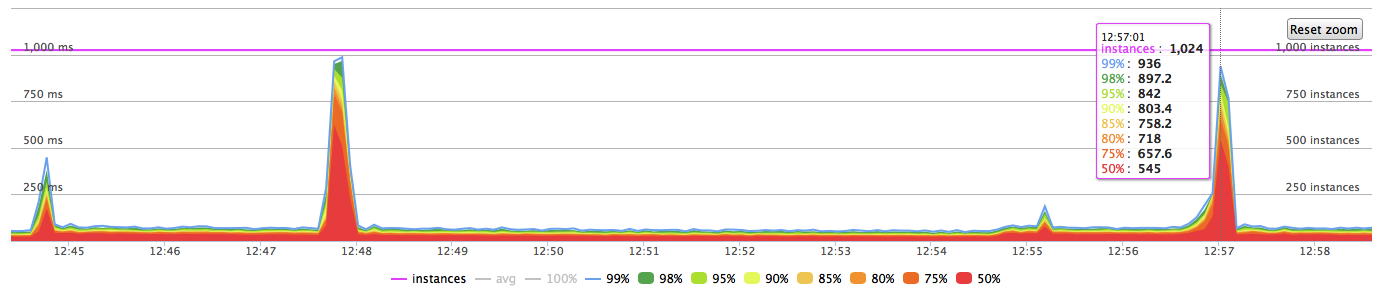
Response timings of the application at this moment look like that:
The hardware is quite good to handle this load (PGDATA lives on soft raid10 array of 8 ssd drives). I’ve done the same test with 3000 tps - the result was exactly the same. The only difference was that I/O spikes had been stronger.
So my question is why the checkpoint is not spread for 540 seconds? Is there any way to understand why I/O spike happens when the checkpoint finishes but does not happen during all of the checkpoint process? Any help would be really appropriate.
--
Vladimir
Attachment
On Mon, Apr 14, 2014 at 2:46 AM, Borodin Vladimir <root@simply.name> wrote:
Hi all.I’m running PostgreSQL 9.3.4 and doing stress test of the database with writing only load. The test plan does 1000 transactions per second (each of them does several updates/inserts). The problem is that checkpoint is not distributed over time well. When the checkpoint finishes, the db gets lots of I/O operations and response timings grows strongly.My checkpoint settings looks like that:postgres=# select name, setting from pg_catalog.pg_settings where name like 'checkpoint%' and boot_val != reset_val;name | setting------------------------------+---------checkpoint_completion_target | 0.9checkpoint_segments | 100500checkpoint_timeout | 600(3 rows)postgres=#But in the log I see that checkpoint continues less than 600*0.9 = 540 seconds:2014-04-14 12:54:41.479 MSK,,,10517,,53468da6.2915,433,,2014-04-10 16:25:10 MSK,,0,LOG,00000,"checkpoint starting: time",,,,,,,,,""2014-04-14 12:57:06.107 MSK,,,10517,,53468da6.2915,434,,2014-04-10 16:25:10 MSK,,0,LOG,00000,"checkpoint complete: wrote 65140 buffers (24.8%); 0 transaction log file(s) added, 0 removed, 327 recycled; write=134.217 s, sync=10.292 s, total=144.627 s; sync files=31, longest=3.332 s, average=0.331 s",,,,,,,,,»"
When a checkpoint starts, the checkpointer process counts up all the buffers that need to be written. Then it goes through and writes them. It paces itself by comparing how many buffers it itself has written to how many need to be written. But if a buffer that needs to be checkpointed happens to get written by some other process (the background writer, or a backend, because they need a clean buffer to read different data into), the checkpointer is not notified of this and doesn't count that buffer as being written when it computes whether it is on track. This causes it to finish early. This can be confusing, but probably doesn't cause any real problems. The reason for checkpoint_completion_target is to spread the IO out over a longer time, but if much of the checkpoint IO is really being done by the background writer, than it is already getting spread out fairly well.
When the checkpoint starts (12:54:41.479) dstat says that I/O load increases:
...
But when it finishes (12:57:06.107) the I/O load is much higher than the hardware can do:
During the writing phase of the checkpoint, PostgreSQL passes the dirty data to the OS. At the end, it then tells the OS to make sure that that data has actually reached disk. If your OS stored up too much dirty data in memory then it kind of freaks out once it is notified it needs to actually write that data to disk. The best solution for this may be to lower dirty_background_bytes or dirty_background_ratio so the OS doesn't store up so much trouble for itself.
Cheers
Jeff
14 апр. 2014 г., в 19:11, Jeff Janes <jeff.janes@gmail.com> написал(а):
--
On Mon, Apr 14, 2014 at 2:46 AM, Borodin Vladimir <root@simply.name> wrote:Hi all.I’m running PostgreSQL 9.3.4 and doing stress test of the database with writing only load. The test plan does 1000 transactions per second (each of them does several updates/inserts). The problem is that checkpoint is not distributed over time well. When the checkpoint finishes, the db gets lots of I/O operations and response timings grows strongly.My checkpoint settings looks like that:postgres=# select name, setting from pg_catalog.pg_settings where name like 'checkpoint%' and boot_val != reset_val;name | setting------------------------------+---------checkpoint_completion_target | 0.9checkpoint_segments | 100500checkpoint_timeout | 600(3 rows)postgres=#But in the log I see that checkpoint continues less than 600*0.9 = 540 seconds:2014-04-14 12:54:41.479 MSK,,,10517,,53468da6.2915,433,,2014-04-10 16:25:10 MSK,,0,LOG,00000,"checkpoint starting: time",,,,,,,,,""2014-04-14 12:57:06.107 MSK,,,10517,,53468da6.2915,434,,2014-04-10 16:25:10 MSK,,0,LOG,00000,"checkpoint complete: wrote 65140 buffers (24.8%); 0 transaction log file(s) added, 0 removed, 327 recycled; write=134.217 s, sync=10.292 s, total=144.627 s; sync files=31, longest=3.332 s, average=0.331 s",,,,,,,,,»"When a checkpoint starts, the checkpointer process counts up all the buffers that need to be written. Then it goes through and writes them. It paces itself by comparing how many buffers it itself has written to how many need to be written. But if a buffer that needs to be checkpointed happens to get written by some other process (the background writer, or a backend, because they need a clean buffer to read different data into), the checkpointer is not notified of this and doesn't count that buffer as being written when it computes whether it is on track. This causes it to finish early. This can be confusing, but probably doesn't cause any real problems. The reason for checkpoint_completion_target is to spread the IO out over a longer time, but if much of the checkpoint IO is really being done by the background writer, than it is already getting spread out fairly well.
I didn’t know that, thanks. Seems, that I have quite small shared buffers size. I will investigate this problem.
When the checkpoint starts (12:54:41.479) dstat says that I/O load increases:...But when it finishes (12:57:06.107) the I/O load is much higher than the hardware can do:During the writing phase of the checkpoint, PostgreSQL passes the dirty data to the OS. At the end, it then tells the OS to make sure that that data has actually reached disk. If your OS stored up too much dirty data in memory then it kind of freaks out once it is notified it needs to actually write that data to disk. The best solution for this may be to lower dirty_background_bytes or dirty_background_ratio so the OS doesn't store up so much trouble for itself.
Actually, I have already tuned them to different values. Test results above have been obtained with such settings for page cache:
vm.dirty_background_ratio = 5
vm.dirty_ratio = 40
vm.dirty_expire_centisecs = 100
vm.dirty_writeback_centisecs = 100
Togethrer with previous point I will try to tune os and postgres settings. Thanks.
CheersJeff
--
Vladimir
On Mon, Apr 14, 2014 at 9:42 AM, Borodin Vladimir <root@simply.name> wrote:
14 апр. 2014 г., в 19:11, Jeff Janes <jeff.janes@gmail.com> написал(а):During the writing phase of the checkpoint, PostgreSQL passes the dirty data to the OS. At the end, it then tells the OS to make sure that that data has actually reached disk. If your OS stored up too much dirty data in memory then it kind of freaks out once it is notified it needs to actually write that data to disk. The best solution for this may be to lower dirty_background_bytes or dirty_background_ratio so the OS doesn't store up so much trouble for itself.Actually, I have already tuned them to different values. Test results above have been obtained with such settings for page cache:vm.dirty_background_ratio = 5
If you have 64GB of RAM, that is 3.2GB of allowed dirty data, which is probably too much. But I think I've heard rumors that the kernel ignores settings below 5, so probably switch to dirty_background_bytes.
Cheers,
Jeff
14 апр. 2014 г., в 22:09, Jeff Janes <jeff.janes@gmail.com> написал(а):
On Mon, Apr 14, 2014 at 9:42 AM, Borodin Vladimir <root@simply.name> wrote:14 апр. 2014 г., в 19:11, Jeff Janes <jeff.janes@gmail.com> написал(а):During the writing phase of the checkpoint, PostgreSQL passes the dirty data to the OS. At the end, it then tells the OS to make sure that that data has actually reached disk. If your OS stored up too much dirty data in memory then it kind of freaks out once it is notified it needs to actually write that data to disk. The best solution for this may be to lower dirty_background_bytes or dirty_background_ratio so the OS doesn't store up so much trouble for itself.Actually, I have already tuned them to different values. Test results above have been obtained with such settings for page cache:vm.dirty_background_ratio = 5If you have 64GB of RAM, that is 3.2GB of allowed dirty data, which is probably too much. But I think I've heard rumors that the kernel ignores settings below 5, so probably switch to dirty_background_bytes.
Actually, I have even more :) 128 GB of RAM. I’ve set such settings for page cache:
# 100 MB
vm.dirty_background_bytes = 104857600
vm.dirty_ratio = 40
vm.dirty_expire_centisecs = 100
vm.dirty_writeback_centisecs = 100
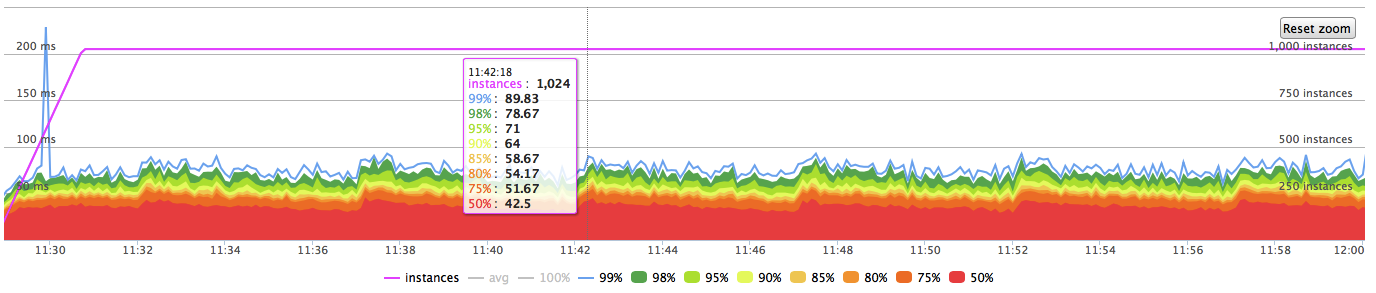
And tried 2 GB, 4 GB, 8 GB for shared_buffers size (when I wrote first letter, it was 2 GB). Shared buffers size does not matter with above page cache settings. But it really affects the distribution of checkpoint over time.
Right now test results (for 1000 tps and checkpoint every 5 minutes) look like that:
Thank you very much, Jeff.
Cheers,Jeff
--
Vladimir