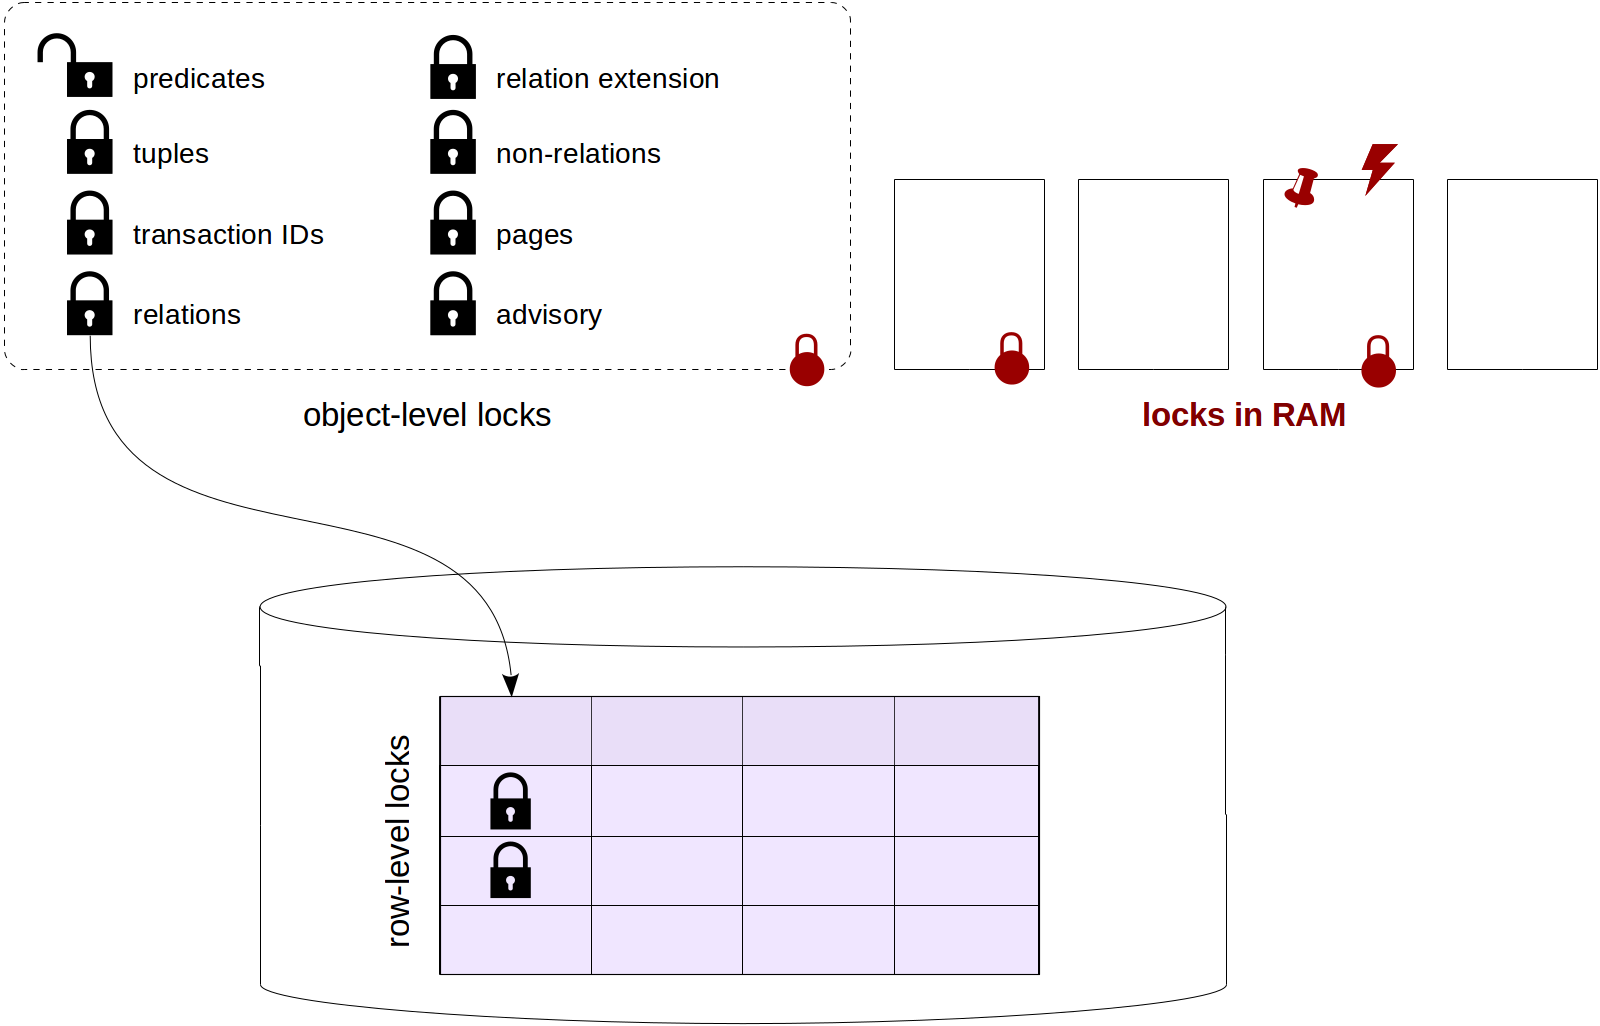
Locks in PostgreSQL: 4. Locks in memory
To remind you, we've already talked about relation-level locks, row-level locks, locks on other objects (including predicate locks) and interrelationships of different types of locks.
The following discussion of locks in RAM finishes this series of articles. We will consider spinlocks, lightweight locks and buffer pins, as well as events monitoring tools and sampling.
Spinlocks
Unlike normal, "heavy-weight", locks, to protect structures in the shared memory, more lightweight and less expensive (in overhead costs) locks are used.
The simplest of them are spinlocks. They are meant to be acquired for very short time intervals (a few processor instructions), and they protect separate memory areas from simultaneous changes.
Spinlocks are implemented based on atomic processor instructions, such as compare-and-swap. They support the only, exclusive, mode. If a lock is acquired, a waiting process performs busy waiting — the command is repeated ("spins" in a loop, hence the name) until it is a success. This makes sense since spinlocks are used in the cases where the probability of a conflict is estimated as very low.
Spinlocks do not enable detection of deadlocks (PostgreSQL developers take care of this) and provide no monitoring tools. Essentially, the only thing we can do with spinlocks is to be aware of their existence.
Lightweight locks
So-called lightweight locks (lwlocks) come next.
They get acquired for a short time that is needed to work with the data structure (such as a hash table or a list of pointers). As a rule, a lightweight lock is held briefly, but sometimes lightweight locks protect input/output operations, so in general, the time might also be considerable.
Two modes are supported: exclusive (for data modifications) and shared (only for reading). There is actually no wait queue: if a few processes wait for release of a lock, one of them will get the access in a more or less random fashion. In high-concurrency and large-load systems, this can be troublesome (for example, see this discussion).
There are no techniques to check for deadlocks, so this is left to the responsibility of developers of the core. However, lightweight locks have monitoring tools, so, unlike spinlocks, we can "see" them (I will show a bit later how to do this).
Buffer pin
Yet another type of locks, which we already touched upon in the article on the buffer cache, is a buffer pin.
Different operations, including data modifications, can be performed with a pinned buffer, but under the condition that the changes are not visible to other processes due to multiversion concurrency control. That is, we can, for instance, add a new row to the page, but cannot replace a page in the buffer with another one.
If a buffer pin hinders a process, as a rule, the latter just skips this buffer and chooses a different one. But in some cases, where exactly this buffer is needed, the process queues and "falls asleep"; the system will wake it up when the buffer is unpinned.
Monitoring can access waits related to buffer pins.
Example: buffer cache
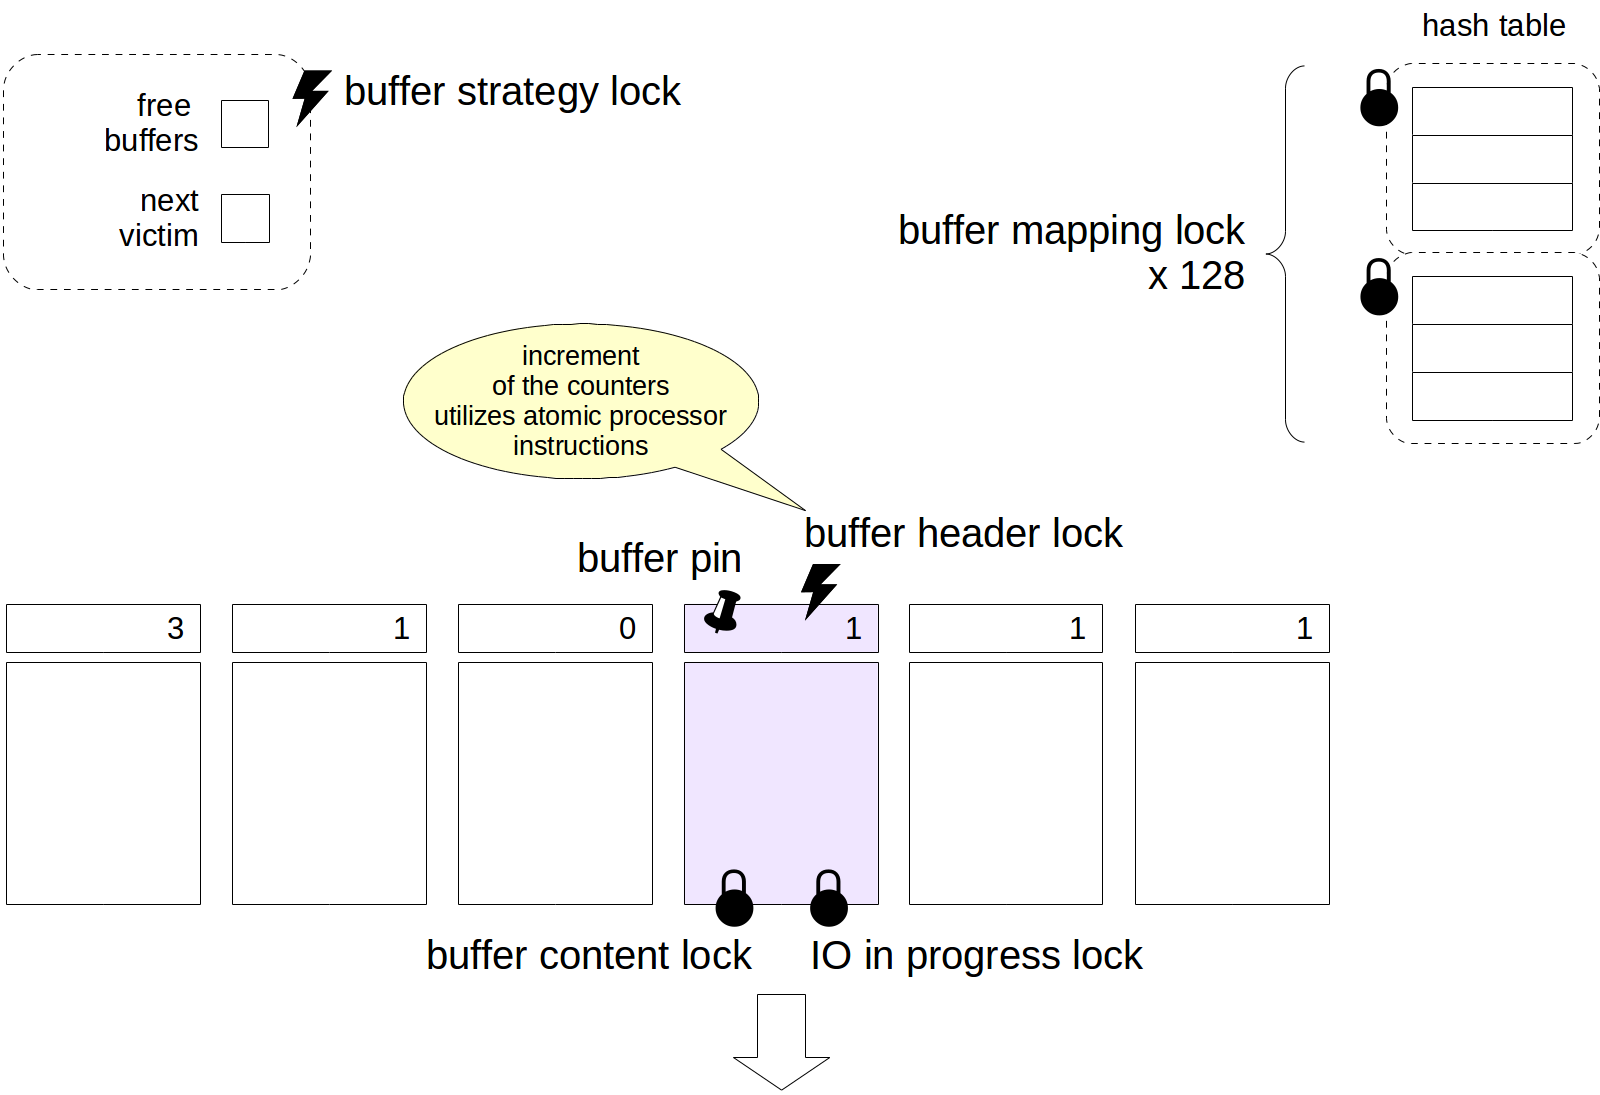
Now, in order to get some (although incomplete!) insight into how and where locks are used, let's consider the buffer cache as an example.
To access a hash table that contains links to buffers, a process must acquire a lightweight buffer mapping lock in a shared mode, and if the table needs to be updated, in an exclusive mode. To reduce the granularity, this lock is structured as a tranche that consists of 128 separate locks, each protecting its own part of the hash table.
The process gets access to the buffer header using a spinlock. Certain operations (such as a counter increment) can also be performed without explicit locking, by means of atomic processor instructions.
In order to read the contents of a buffer, a buffer content lock is needed. It is usually acquired only for the time needed to read pointers to tuples, and after that, a buffer pin provides sufficient protection. To change the contents of a buffer, this lock must be acquired in an exclusive mode.
When a buffer is read from disk (or written to disk), an IO in progress lock is also acquired, which indicates to other processes that the page is being read (or written) — they can queue up if they need to do something with this page.
Pointers to free buffers and to the next victim are protected by one buffer strategy lock spinlock.
Example: WAL buffers
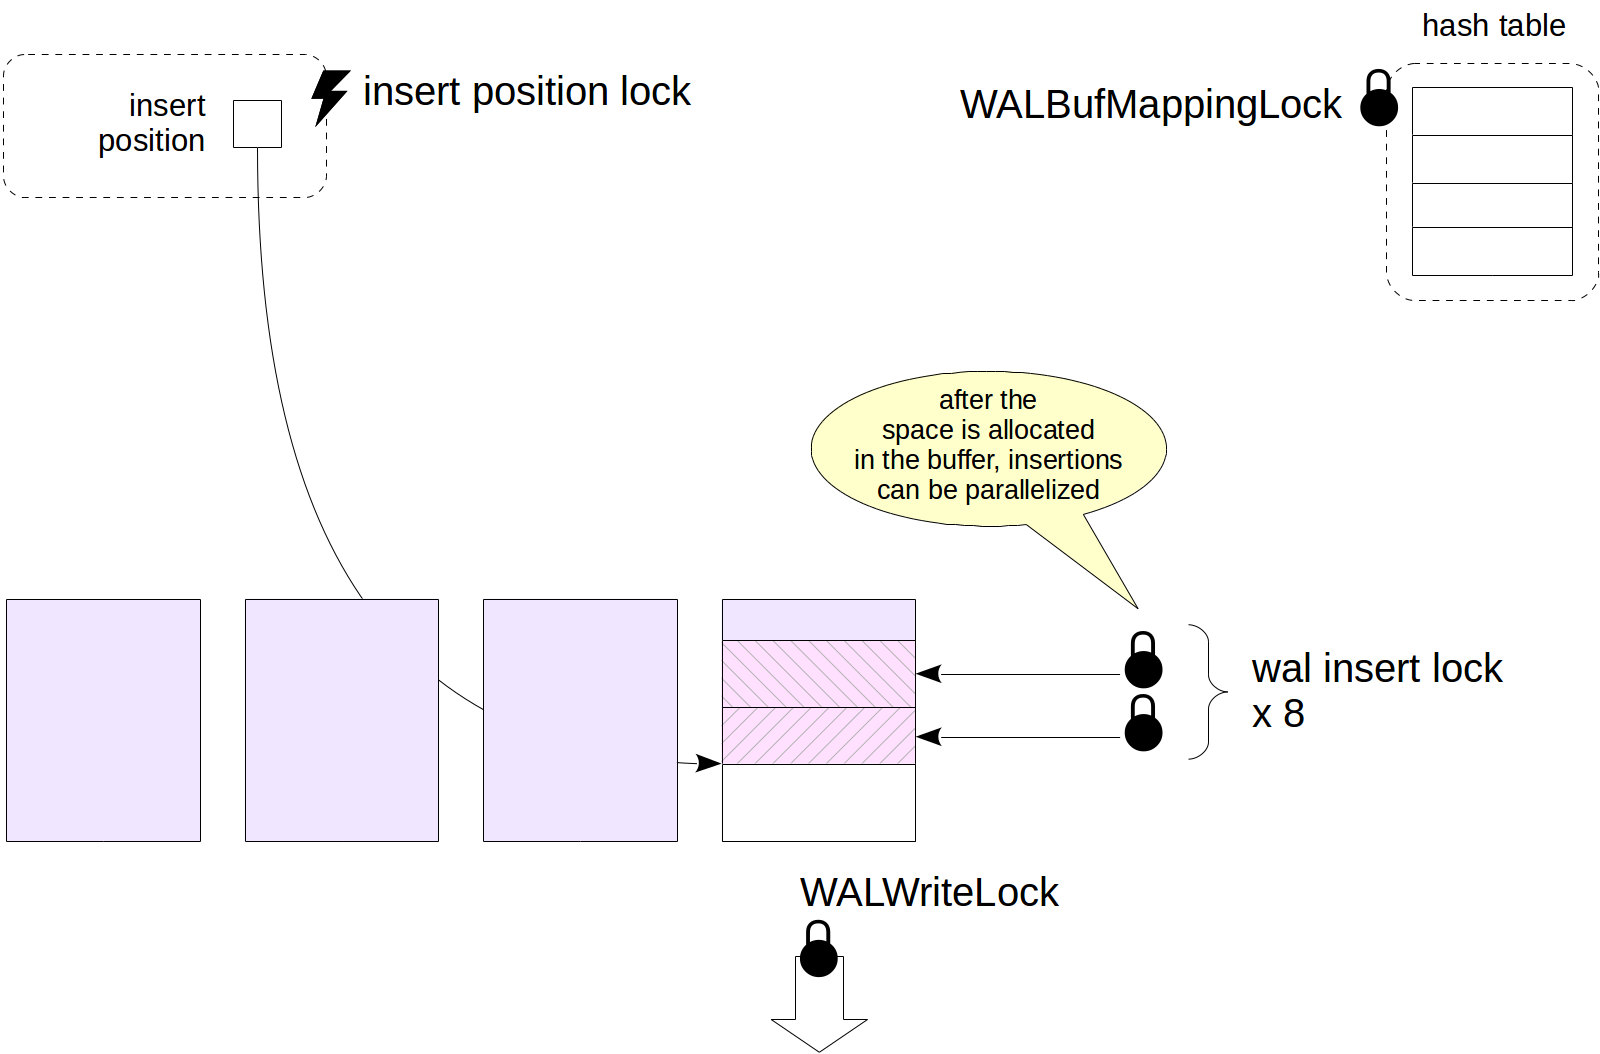
WAL buffers provide another example.
The WAL cache also uses a hash table that contains mapping of pages to buffers. Unlike for the buffer cache, this hash table is protected by the only lightweight WALBufMappingLock lock since the size of the WAL cache is smaller (usually 1/32 of the buffer cache) and access to the buffers is more regular.
Writes of pages to disk are protected by the WALWriteLock lock, so that only one process can perform this operation at a time.
To create a WAL record, the process must first allocate space in a WAL page. To do this, it acquires an insert position lock spinlock. When the space is allocated, the process copies the contents of its record to the space allocated. Copying can be performed by several processes simultaneously, therefore, the record is protected by a tranche of 8 lightweight wal insert lock locks (the process must acquire any of them).
The figure does not show all WAL-related locks, but this and previous examples must give an idea of how locks in RAM are used.
Wait events monitoring
Starting with PostgreSQL 9.6, the pg_stat_activity view has built-in events monitoring tools. When a process (system or backend) cannot do its job and waits for something, we can see this wait in the view: the wait_event_type column shows the wait type and the wait_event column shows the name of a specific wait.
Note that the view shows only waits that are properly handled in the source code. If the view does not show a wait, in general, this does not mean with 100 percent probability that the process really waits for nothing.
Unfortunately, the only available information on waits is the current information. No accumulated statistics are maintained. The only way to get the picture of waits in time is sampling the state of the view at a certain interval. No built-in tools are provided to this end, but we can use extensions, such as pg_wait_sampling.
We need to take into account the probabilistic nature of sampling. To get a more or less credible picture, the number of measurements must be pretty large. Low-frequency sampling may fail to provide a credible picture, while use of higher frequencies will increase overhead costs. For the same reason, sampling is useless to analyze short-lived sessions.
All the waits can be divided into several types.
Waits for the locks discussed make up a large category:
- Waits for locks on objects (the value of
Lockin thewait_event_typecolumn). - Waits for lightweight locks (
LWLock). - Waits for a buffer pin (
BufferPin).
But processes can also await other events:
- Waits for input/output (
IO) occur when a process needs to read or write data. - A process can wait for the data needed from a client (
Client) or another process (IPC). - Extensions can register their specific waits (
Extension).
Sometimes situations arise when a process just doesn't do any productive work. This category includes:
- Waits of a background process in its main loop (
Activity). - Waits for a timer (
Timeout).
Usually, waits like these are treated as "normal" and do not indicate any problems.
The wait type is followed by the name of a specific wait. For the complete table, see the documentation.
If the name of a wait is not defined, the process is not in the waiting state. We need to treat this point in time as unaccounted for since we are actually unaware of what exactly is happening at that moment.
However, let's watch this for ourselves.
=> SELECT pid, backend_type, wait_event_type, wait_event
FROM pg_stat_activity;
  pid  |         backend_type         | wait_event_type |     wait_event
-------+------------------------------+-----------------+---------------------
 28739 | logical replication launcher | Activity        | LogicalLauncherMain
 28736 | autovacuum launcher          | Activity        | AutoVacuumMain
 28963 | client backend               |                 |
 28734 | background writer            | Activity        | BgWriterMain
 28733 | checkpointer                 | Activity        | CheckpointerMain
 28735 | walwriter                    | Activity        | WalWriterMain
(6 rows)
It's clear that all background backend processes are idle. Empty values of wait_event_type and wait_event tell us that the process is waiting for nothing; in our example, the backend process is busy executing the query.
Sampling
To get a more or less complete picture of waits by means of sampling, we will use the pg_wait_sampling extension. We need to build it from source codes, but I will omit this part. Then we add the library name to the shared_preload_libraries parameter and restart the server.
=> ALTER SYSTEM SET shared_preload_libraries = 'pg_wait_sampling';
student$ sudo pg_ctlcluster 11 main restart
Now we install the extension in the database.
=> CREATE EXTENSION pg_wait_sampling;
The extension allows us to look through the history of waits, which is stored in a circular buffer. But what's mostly interesting to us is the waits profile, that is, the statistics accumulated since the server start.
This is roughly what we will see a few seconds later:
=> SELECT * FROM pg_wait_sampling_profile;
  pid  | event_type |        event        | queryid | count
-------+------------+---------------------+---------+-------
 29074 | Activity   | LogicalLauncherMain |       0 |   220
 29070 | Activity   | WalWriterMain       |       0 |   220
 29071 | Activity   | AutoVacuumMain      |       0 |   219
 29069 | Activity   | BgWriterMain        |       0 |   220
 29111 | Client     | ClientRead          |       0 |     3
 29068 | Activity   | CheckpointerMain    |       0 |   220
(6 rows)
Because nothing happened since the server start, most waits refer to the types Activity (backend processes wait until there is some work for them) and Client (psql waits until a user sends a request).
With the default settings (of the pg_wait_sampling.profile_period parameter), the sampling period equals 10 milliseconds, which means that values are saved 100 times a second. Therefore, to evaluate the duration of waits in seconds, we need to divide the value of count by 100.
To figure out which process the waits pertain to, let's add the pg_stat_activity view to the query:
=> SELECT p.pid, a.backend_type, a.application_name AS app,
          p.event_type, p.event, p.count
FROM pg_wait_sampling_profile p
  LEFT JOIN pg_stat_activity a ON p.pid = a.pid
ORDER BY p.pid, p.count DESC;
  pid  |         backend_type         | app  | event_type |        event         | count
-------+------------------------------+------+------------+----------------------+-------
 29068 | checkpointer                 |      | Activity   | CheckpointerMain     |   222
 29069 | background writer            |      | Activity   | BgWriterMain         |   222
 29070 | walwriter                    |      | Activity   | WalWriterMain        |   222
 29071 | autovacuum launcher          |      | Activity   | AutoVacuumMain       |   221
 29074 | logical replication launcher |      | Activity   | LogicalLauncherMain  |   222
 29111 | client backend               | psql | Client     | ClientRead           |     4
 29111 | client backend               | psql | IPC        | MessageQueueInternal |     1
(7 rows)
Let's produce some workload using pgbench and see how the picture changes.
student$ pgbench -i test
We reset the accumulated profile to zero and run the test for 30 seconds in a separate process.
=> SELECT pg_wait_sampling_reset_profile();
student$ pgbench -T 30 test
We need to execute the query while the pgbench process is not finished yet:
=> SELECT p.pid, a.backend_type, a.application_name AS app,
          p.event_type, p.event, p.count
FROM pg_wait_sampling_profile p
  LEFT JOIN pg_stat_activity a ON p.pid = a.pid
WHERE a.application_name = 'pgbench'
ORDER BY p.pid, p.count DESC;
  pid  |  backend_type  |   app   | event_type |   event    | count
-------+----------------+---------+------------+------------+-------
 29148 | client backend | pgbench | IO         | WALWrite   |     8
 29148 | client backend | pgbench | Client     | ClientRead |     1
(2 rows)
The waits of the pgbench process will certainly differ slightly depending on a particular system. In our situation, a wait for WAL writing (IO/WALWrite) is highly likely to be presented, however, most of the time the process was doing something presumably productive rather than being idle.
Lightweight locks
We always need to keep in mind that if a wait is missing when sampling, this does not mean that there was really no wait. If the wait was shorter than the sampling period (a hundredth of a second in our example), it could just fail to get into the sample.
That's why lightweight locks did not occur in the profile, but they will if the data is collected for a long time. To be able to see them for sure, we can intentionally slow down the file system, for example, by using the slowfs project, built on top of the FUSE file system.
This is what we can see on the same test if any input/output operation takes 1/10 of a second.
=> SELECT pg_wait_sampling_reset_profile();
student$ pgbench -T 30 test
=> SELECT p.pid, a.backend_type, a.application_name AS app,
          p.event_type, p.event, p.count
FROM pg_wait_sampling_profile p
  LEFT JOIN pg_stat_activity a ON p.pid = a.pid
WHERE a.application_name = 'pgbench'
ORDER BY p.pid, p.count DESC;
  pid  |  backend_type  |   app   | event_type |     event      | count
-------+----------------+---------+------------+----------------+-------
 29240 | client backend | pgbench | IO         | WALWrite       |  1445
 29240 | client backend | pgbench | LWLock     | WALWriteLock   |   803
 29240 | client backend | pgbench | IO         | DataFileExtend |    20
(3 rows)
Now the major wait of the pgbench process relates to input/output, more exactly, to WAL writes, which synchronously occur for every commit. Because (as shown in one of the above examples) a WAL write is protected by a lightweight WALWriteLock lock, this lock is also present in the profile — and it's just what we wanted to look at.
Buffer pin
To see a buffer pin, let's make use of the fact that open cursors hold the pin to faster read the next row.
Let's start a transaction, open a cursor and select one row.
=> BEGIN;
=> DECLARE c CURSOR FOR SELECT * FROM pgbench_history;
=> FETCH c;
 tid | bid |  aid  | delta |           mtime            | filler
-----+-----+-------+-------+----------------------------+--------
   9 |   1 | 35092 |   477 | 2019-09-04 16:16:18.596564 |
(1 row)
Let's check that the buffer is pinned (pinning_backends):
=> SELECT * FROM pg_buffercache
WHERE relfilenode = pg_relation_filenode('pgbench_history')
AND relforknumber = 0 \gx
-[ RECORD 1 ]----+------
bufferid         | 190
relfilenode      | 47050
reltablespace    | 1663
reldatabase      | 16386
relforknumber    | 0
relblocknumber   | 0
isdirty          | t
usagecount       | 1
pinning_backends | 1     <-- buffer is pinned 1 time
Now let's vacuum the table:
| => SELECT pg_backend_pid();
|   pg_backend_pid
|  ----------------
|            29367
|  (1 row)
| => VACUUM VERBOSE pgbench_history;
|  INFO:  vacuuming "public.pgbench_history"
|  INFO:  "pgbench_history": found 0 removable, 0 nonremovable row versions in 1 out of 1 pages
|  DETAIL:  0 dead row versions cannot be removed yet, oldest xmin: 732651
|  There were 0 unused item pointers.
| Skipped 1 page due to buffer pins, 0 frozen pages.
|  0 pages are entirely empty.
|  CPU: user: 0.00 s, system: 0.00 s, elapsed: 0.00 s.
|  VACUUM
As we can see, the page was skipped (Skipped 1 page due to buffer pins). Indeed, VACUUM cannot process it because physical deletion of tuples from a page in a pinned buffer is forbidden. But vacuuming will not wait either, and the page will be processed next time.
And now let's perform vacuuming with freezing:
| => VACUUM FREEZE VERBOSE pgbench_history;
If freezing is explicitly requested, none of the pages tracked in the all-frozen bit can be skipped; otherwise, it is impossible to reduce the maximum age of non-frozen transactions in pg_class.relfrozenxid. So, vacuuming hangs until the cursor is closed.
=> SELECT age(relfrozenxid) FROM pg_class WHERE oid = 'pgbench_history'::regclass;
 age
-----
  27
(1 row)
=> COMMIT; -- cursor closes automatically
|  INFO:  aggressively vacuuming "public.pgbench_history"
|  INFO:  "pgbench_history": found 0 removable, 26 nonremovable row versions in 1 out of 1 pages
|  DETAIL:  0 dead row versions cannot be removed yet, oldest xmin: 732651
|  There were 0 unused item pointers.
| Skipped 0 pages due to buffer pins, 0 frozen pages.
|  0 pages are entirely empty.
|  CPU: user: 0.00 s, system: 0.00 s, elapsed: 3.01 s.
|  VACUUM
=> SELECT age(relfrozenxid) FROM pg_class WHERE oid = 'pgbench_history'::regclass;
 age
-----
   0
(1 row)
And let's look into the waits profile of the second psql session, where the VACUUM commands were executed:
=> SELECT p.pid, a.backend_type, a.application_name AS app,
          p.event_type, p.event, p.count
FROM pg_wait_sampling_profile p
  LEFT JOIN pg_stat_activity a ON p.pid = a.pid
WHERE p.pid = 29367
ORDER BY p.pid, p.count DESC;
  pid  |  backend_type  | app  | event_type |   event    | count
-------+----------------+------+------------+------------+-------
 29367 | client backend | psql | BufferPin  | BufferPin  |   294
 29367 | client backend | psql | Client     | ClientRead |    10
(2 rows)
The BufferPin wait tells us that VACUUM was waiting for the buffer to get free.
And this is where we will consider discussing locks as finished. Thank you all for attentive reading and comments!