Thread: Native postgres query to examine FreeableMemory RDS alerts
I have a Cloudwatch alert on a postgres RDS instance when freeable memory drops below a certain amount. I find myself unable to really diagnose what's happening when this does happen, and wondered if there were any PG queries I might make to see what could be using so much RAM.
Wells Oliver
wells.oliver@gmail.com
wells.oliver@gmail.com
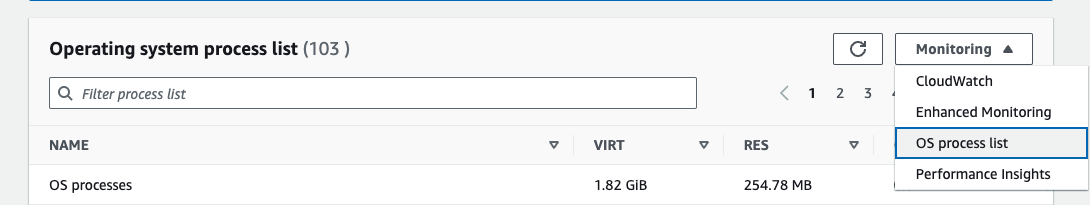
Go to your RDS instance in the console, go to the Monitoring and pull "OS process list", sort by residential memory descending.
This will show you all currently running processes (PIDs) and the amount of memory they use. You can then go to your database and pull information on what that process is doing `select * from pg_stat_activity where pid=?`

On Wed, Mar 13, 2024 at 2:26 PM Wells Oliver <wells.oliver@gmail.com> wrote:
I have a Cloudwatch alert on a postgres RDS instance when freeable memory drops below a certain amount. I find myself unable to really diagnose what's happening when this does happen, and wondered if there were any PG queries I might make to see what could be using so much RAM.--Wells Oliver
wells.oliver@gmail.com
Attachment
Perfect, thank you very much.
On Wed, Mar 13, 2024 at 11:39 AM Michael Guissine <mguissine@gmail.com> wrote:
Go to your RDS instance in the console, go to the Monitoring and pull "OS process list", sort by residential memory descending.This will show you all currently running processes (PIDs) and the amount of memory they use. You can then go to your database and pull information on what that process is doing `select * from pg_stat_activity where pid=?`On Wed, Mar 13, 2024 at 2:26 PM Wells Oliver <wells.oliver@gmail.com> wrote:I have a Cloudwatch alert on a postgres RDS instance when freeable memory drops below a certain amount. I find myself unable to really diagnose what's happening when this does happen, and wondered if there were any PG queries I might make to see what could be using so much RAM.--Wells Oliver
wells.oliver@gmail.com
Wells Oliver
wells.oliver@gmail.com
wells.oliver@gmail.com