Thread: Exact same output - pg_stat_statements
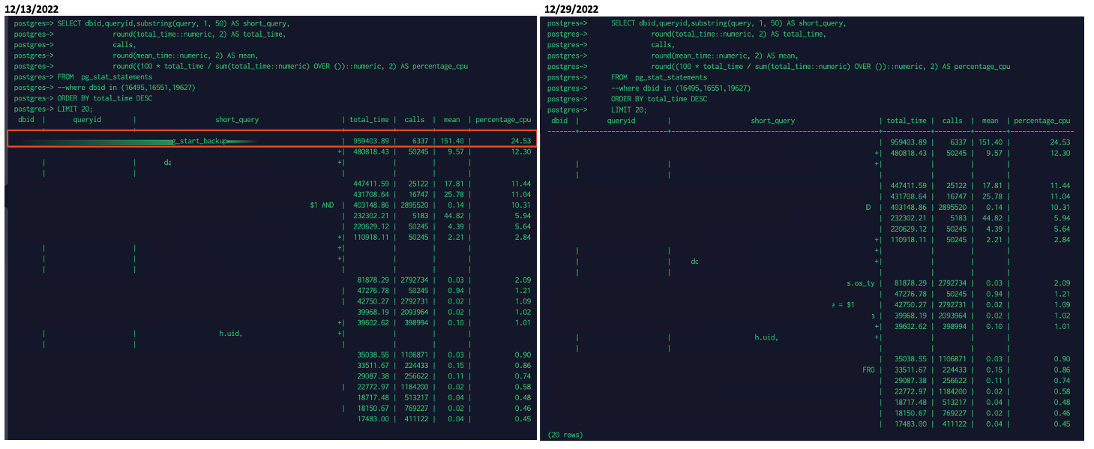
Hi, Whenever I am running the below query on one of my Azure PostgreSQL PaaS instances I am getting exact same output. I feel it shows old information but as far as i know pg_stat_statements only shows current information and not past right ? It may be a bug?
SELECT dbid,queryid,substring(query, 1, 50) AS short_query,
round(total_time::numeric, 2) AS total_time,
calls,
round(mean_time::numeric, 2) AS mean,
round((100 * total_time / sum(total_time::numeric) OVER ())::numeric, 2) AS percentage_cpu
FROM pg_stat_statements
ORDER BY total_time DESC
LIMIT 20;
round(total_time::numeric, 2) AS total_time,
calls,
round(mean_time::numeric, 2) AS mean,
round((100 * total_time / sum(total_time::numeric) OVER ())::numeric, 2) AS percentage_cpu
FROM pg_stat_statements
ORDER BY total_time DESC
LIMIT 20;
I have erased the query text from the screenshot below. but Please look at the rest of the columns which are exactly the same. How it is possible ?

Thanks.
Attachment
The screen shots are hard to see. Too small. (Imgur links might be better.)
On 12/30/22 10:04, Rushikesh socha wrote:
Hi, Whenever I am running the below query on one of my Azure PostgreSQL PaaS instances I am getting exact same output. I feel it shows old information but as far as i know pg_stat_statements only shows current information and not past right ? It may be a bug?SELECT dbid,queryid,substring(query, 1, 50) AS short_query,
round(total_time::numeric, 2) AS total_time,
calls,
round(mean_time::numeric, 2) AS mean,
round((100 * total_time / sum(total_time::numeric) OVER ())::numeric, 2) AS percentage_cpu
FROM pg_stat_statements
ORDER BY total_time DESC
LIMIT 20;I have erased the query text from the screenshot below. but Please look at the rest of the columns which are exactly the same. How it is possible ?Thanks.
--
Born in Arizona, moved to Babylonia.
Born in Arizona, moved to Babylonia.
Attachment
Just trying to show that the query output is exactly the same anytime I run.
Thanks.
On Fri, Dec 30, 2022 at 3:24 PM Ron <ronljohnsonjr@gmail.com> wrote:
The screen shots are hard to see. Too small. (Imgur links might be better.)On 12/30/22 10:04, Rushikesh socha wrote:Hi, Whenever I am running the below query on one of my Azure PostgreSQL PaaS instances I am getting exact same output. I feel it shows old information but as far as i know pg_stat_statements only shows current information and not past right ? It may be a bug?SELECT dbid,queryid,substring(query, 1, 50) AS short_query,
round(total_time::numeric, 2) AS total_time,
calls,
round(mean_time::numeric, 2) AS mean,
round((100 * total_time / sum(total_time::numeric) OVER ())::numeric, 2) AS percentage_cpu
FROM pg_stat_statements
ORDER BY total_time DESC
LIMIT 20;I have erased the query text from the screenshot below. but Please look at the rest of the columns which are exactly the same. How it is possible ?Thanks.--
Born in Arizona, moved to Babylonia.
Attachment
On Fri, Dec 30, 2022 at 11:04:59AM -0500, Rushikesh socha wrote:
> Hi, Whenever I am running the below query on one of my Azure PostgreSQL
> PaaS instances I am getting exact same output. I feel it shows old
> information but as far as i know pg_stat_statements only shows current
> information and not past right ? It may be a bug?

pg_stat_statements has all the data since last reset of stats.

So if you never reset stats, it accumulated data for howeve rlong you
are using pg.

Not really surprising that top total-time uses are the same.

If you want to sensibly use it you should call reset function every now
and then.
Best regards,

depesz
On Mon, Jan 02, 2023 at 02:34:13PM +0100, hubert depesz lubaczewski wrote:
> On Fri, Dec 30, 2022 at 11:04:59AM -0500, Rushikesh socha wrote:
> > Hi, Whenever I am running the below query on one of my Azure PostgreSQL
> > PaaS instances I am getting exact same output. I feel it shows old
> > information but as far as i know pg_stat_statements only shows current
> > information and not past right ? It may be a bug?
>
> pg_stat_statements has all the data since last reset of stats.
>
> So if you never reset stats, it accumulated data for howeve rlong you
> are using pg.
>
> Not really surprising that top total-time uses are the same.
>
> If you want to sensibly use it you should call reset function every now
> and then.

Resetting the data adds some noticeable overhead as newly added entries will
need to generate a normalize query string and so on.  What most people do is
taking regular snapshots of pg_stat_statements (and other stats) view and then
compare the snapshots.  There are a few open source projects doing that
available.
On Tue, Jan 03, 2023 at 01:52:17PM +0800, Julien Rouhaud wrote:
> Resetting the data adds some noticeable overhead as newly added entries will
> need to generate a normalize query string and so on.  What most people do is
> taking regular snapshots of pg_stat_statements (and other stats) view and then
> compare the snapshots.  There are a few open source projects doing that
> available.

Why do you assume that the cost of normalization query string will be in
any way measurable? Especially in comparison do extra cost of doin math
on potentially thousands of rows?

Best regards,

depesz


