Thread: Add the ability to limit the amount of memory that can be allocated to backends.
Add the ability to limit the amount of memory that can be allocated to backends.
Hi Hackers,

Add the ability to limit the amount of memory that can be allocated to
backends.

This builds on the work that adds backend memory allocated to
pg_stat_activity
https://www.postgresql.org/message-id/67bb5c15c0489cb499723b0340f16e10c22485ec.camel%40crunchydata.com
Both patches are attached.

Add GUC variable max_total_backend_memory.

Specifies a limit to the amount of memory (MB) that may be allocated to
backends in total (i.e. this is not a per user or per backend limit).
If unset, or set to 0 it is disabled. It is intended as a resource to
help avoid the OOM killer. A backend request that would push the total
over the limit will be denied with an out of memory error causing that
backends current query/transaction to fail. Due to the dynamic nature
of memory allocations, this limit is not exact. If within 1.5MB of the
limit and two backends request 1MB each at the same time both may be
allocated exceeding the limit. Further requests will not be allocated
until dropping below the limit. Keep this in mind when setting this
value to avoid the OOM killer. Currently, this limit does not affect
auxiliary backend processes, this list of non-affected backend
processes is open for discussion as to what should/should not be
included. Backend memory allocations are displayed in the
pg_stat_activity view.


--
Reid Thompson
Senior Software Engineer
Crunchy Data, Inc.

reid.thompson@crunchydata.com
www.crunchydata.com
Attachment
Re: Add the ability to limit the amount of memory that can be allocated to backends.
On Wed, Aug 31, 2022 at 12:50:19PM -0400, Reid Thompson wrote:
> Hi Hackers,
>
> Add the ability to limit the amount of memory that can be allocated to
> backends.
>
> This builds on the work that adds backend memory allocated to
> pg_stat_activity
> https://www.postgresql.org/message-id/67bb5c15c0489cb499723b0340f16e10c22485ec.camel%40crunchydata.com
> Both patches are attached.

You should name the patches with different prefixes, like
001,002,003  Otherwise, cfbot may try to apply them in the wrong order.
git format-patch is the usual tool for that.

> +        Specifies a limit to the amount of memory (MB) that may be allocated to

MB are just the default unit, right ?
The user should be allowed to write max_total_backend_memory='2GB'

> +        backends in total (i.e. this is not a per user or per backend limit).
> +        If unset, or set to 0 it is disabled.  A backend request that would push
> +        the total over the limit will be denied with an out of memory error
> +        causing that backends current query/transaction to fail. Due to the dynamic

backend's

> +        nature of memory allocations, this limit is not exact. If within 1.5MB of
> +        the limit and two backends request 1MB each at the same time both may be
> +        allocated exceeding the limit. Further requests will not be allocated until

allocated, and exceed the limit

> +bool
> +exceeds_max_total_bkend_mem(uint64 allocation_request)
> +{
> +    bool result = false;
> +
> +    if (MyAuxProcType != NotAnAuxProcess)
> +        return result;

The double negative is confusing, so could use a comment.

> +    /* Convert max_total_bkend_mem to bytes for comparison */
> +    if (max_total_bkend_mem &&
> +        pgstat_get_all_backend_memory_allocated() +
> +        allocation_request > (uint64)max_total_bkend_mem * 1024 * 1024)
> +    {
> +        /*
> +         * Explicitely identify the OOM being a result of this
> +         * configuration parameter vs a system failure to allocate OOM.
> +         */
> +        elog(WARNING,
> +             "request will exceed postgresql.conf defined max_total_backend_memory limit (%lu > %lu)",
> +             pgstat_get_all_backend_memory_allocated() +
> +             allocation_request, (uint64)max_total_bkend_mem * 1024 * 1024);

I think it should be ereport() rather than elog(), which is
internal-only, and not-translated.

> +               {"max_total_backend_memory", PGC_SIGHUP, RESOURCES_MEM,
> +                       gettext_noop("Restrict total backend memory allocations to this max."),
> +                       gettext_noop("0 turns this feature off."),
> +                       GUC_UNIT_MB
> +               },
> +               &max_total_bkend_mem,
> +               0, 0, INT_MAX,
> +               NULL, NULL, NULL

I think this needs a maximum like INT_MAX/1024/1024

> +uint64
> +pgstat_get_all_backend_memory_allocated(void)
> +{
...
> +    for (i = 1; i <= NumBackendStatSlots; i++)
> +    {

It's looping over every backend for each allocation.
Do you know if there's any performance impact of that ?

I think it may be necessary to track the current allocation size in
shared memory (with atomic increments?).  Maybe decrements would need to
be exactly accounted for, or otherwise Assert() that the value is not
negative.  I don't know how expensive it'd be to have conditionals for
each decrement, but maybe the value would only be decremented at
strategic times, like at transaction commit or backend shutdown.

--
Justin
Re: Add the ability to limit the amount of memory that can be allocated to backends.
At Wed, 31 Aug 2022 12:50:19 -0400, Reid Thompson <reid.thompson@crunchydata.com> wrote in
> Hi Hackers,
>
> Add the ability to limit the amount of memory that can be allocated to
> backends.

The patch seems to limit both of memory-context allocations and DSM
allocations happen on a specific process by the same budget. In the
fist place I don't think it's sensible to cap the amount of DSM
allocations by per-process budget.

DSM is used by pgstats subsystem. There can be cases where pgstat
complains for denial of DSM allocation after the budget has been
exhausted by memory-context allocations, or every command complains
for denial of memory-context allocation after once the per-process
budget is exhausted by DSM allocations. That doesn't seem reasonable.


regards.

--
Kyotaro Horiguchi
NTT Open Source Software Center
Re: Add the ability to limit the amount of memory that can be allocated to backends.
Hi,

On 8/31/22 6:50 PM, Reid Thompson wrote:
> Hi Hackers,
>
> Add the ability to limit the amount of memory that can be allocated to
> backends.

Thanks for the patch.

+ 1 on the idea.

> Specifies a limit to the amount of memory (MB) that may be allocated to
> backends in total (i.e. this is not a per user or per backend limit).
> If unset, or set to 0 it is disabled. It is intended as a resource to
> help avoid the OOM killer. A backend request that would push the total
> over the limit will be denied with an out of memory error causing that
> backends current query/transaction to fail.

I'm not sure we are choosing the right victims here (aka the ones that
are doing the request that will push the total over the limit).

Imagine an extreme case where a single backend consumes say 99% of the
limit, shouldn't it be the one to be "punished"? (and somehow forced to
give the memory back).

The problem that i see with the current approach is that a "bad" backend
could impact all the others and continue to do so.

what about punishing say the highest consumer , what do you think? (just
speaking about the general idea here, not about the implementation)

Regards,

--

Bertrand Drouvot
PostgreSQL Contributors Team
RDS Open Source Databases
Amazon Web Services: https://aws.amazon.com
Re: Add the ability to limit the amount of memory that can be allocated to backends.
On Thu, 1 Sept 2022 at 04:52, Reid Thompson
<reid.thompson@crunchydata.com> wrote:
> Add the ability to limit the amount of memory that can be allocated to
> backends.

Are you aware that relcache entries are stored in backend local memory
and that once we've added a relcache entry for a relation that we have
no current code which attempts to reduce the memory consumption used
by cache entries when there's memory pressure?

It seems to me that if we had this feature as you propose that a
backend could hit the limit and stay there just from the memory
requirements of the relation cache after some number of tables have
been accessed from the given backend. It's not hard to imagine a
situation where the palloc() would start to fail during parse, which
might make it quite infuriating for anyone trying to do something
like:

SET max_total_backend_memory TO 0;

or

ALTER SYSTEM SET max_total_backend_memory TO 0;

I think a better solution to this problem would be to have "memory
grants", where we configure some amount of "pool" memory that backends
are allowed to use for queries.  The planner would have to add the
expected number of work_mem that the given query is expected to use
and before that query starts, the executor would have to "checkout"
that amount of memory from the pool and return it when finished.  If
there is not enough memory in the pool then the query would have to
wait until enough memory is available.   This creates a deadlocking
hazard that the deadlock detector would need to be made aware of.

I know Thomas Munro has mentioned this "memory grant" or "memory pool"
feature to me previously and I think he even has some work in progress
code for it.  It's a very tricky problem, however, as aside from the
deadlocking issue, it requires working out how much memory a given
plan will use concurrently. That's not as simple as counting the nodes
that use work_mem and summing those up.

There is some discussion about the feature in [1]. I was unable to
find what Thomas mentioned on the list about this. I've included him
here in case he has any extra information to share.

David

[1] https://www.postgresql.org/message-id/flat/20220713222342.GE18011%40telsasoft.com#b4f526aa8f2c893567c1ecf069f9e6c7
Re: Add the ability to limit the amount of memory that can be allocated to backends.
On Wed, 2022-08-31 at 12:34 -0500, Justin Pryzby wrote:
> You should name the patches with different prefixes, like
> 001,002,003  Otherwise, cfbot may try to apply them in the wrong
> order.
> git format-patch is the usual tool for that.

Thanks for the pointer. My experience with git in the past has been
minimal and basic.

> > +        Specifies a limit to the amount of memory (MB) that may be
> > allocated to
>
> MB are just the default unit, right ?
> The user should be allowed to write max_total_backend_memory='2GB'

Correct. Default units are MB. Other unit types are converted to MB.

> > +        causing that backends current query/transaction to fail.
>
> backend's
> > +        allocated exceeding the limit. Further requests will not
>
> allocated, and exceed the limit
>
> > +       if (MyAuxProcType != NotAnAuxProcess)
> The double negative is confusing, so could use a comment.

> > +               elog(WARNING,
> I think it should be ereport() rather than elog(), which is
> internal-only, and not-translated.

Corrected/added the the above items. Attached patches with the corrections.

> > +               0, 0, INT_MAX,
> > +               NULL, NULL, NULL
> I think this needs a maximum like INT_MAX/1024/1024

Is this noting that we'd set a ceiling of 2048MB?

> > +       for (i = 1; i <= NumBackendStatSlots; i++)
> > +       {
>
> It's looping over every backend for each allocation.
> Do you know if there's any performance impact of that ?

I'm not very familiar with how to test performance impact, I'm open to
suggestions.  I have performed the below pgbench tests and noted the basic
tps differences in the table.

Test 1:
branch master
CFLAGS="-I/usr/include/python3.8/ " /home/rthompso/src/git/postgres/configure --silent
--prefix=/home/rthompso/src/git/postgres/install/master--with-openssl --with-tcl --with-tclconfig=/usr/lib/tcl8.6
--with-perl--with-libxml --with-libxslt --with-python --with-gssapi --with-systemd --with-ldap --enable-nls
make -s -j12 && make -s install
initdb
default postgresql.conf settings
init pgbench pgbench -U rthompso -p 5433 -h localhost -i -s 50 testpgbench
10 iterations
for ctr in {1..10}; do     { time pgbench  -p 5433 -h localhost -c 10 -j 10 -t 50000 testpgbench; } 2>&1 | tee -a
pgstatsResultsNoLimitSet;done

Test 2:
branch pg-stat-activity-backend-memory-allocated
CFLAGS="-I/usr/include/python3.8/ " /home/rthompso/src/git/postgres/configure --silent
--prefix=/home/rthompso/src/git/postgres/install/pg-stats-memory/--with-openssl --with-tcl
--with-tclconfig=/usr/lib/tcl8.6--with-perl --with-libxml --with-libxslt --with-python --with-gssapi --with-systemd
--with-ldap--enable-nls
make -s -j12 && make -s install
initdb
default postgresql.conf settings
init pgbench pgbench -U rthompso -p 5433 -h localhost -i -s 50
testpgbench
10 iterations
for ctr in {1..10}; do     { time pgbench  -p 5433 -h localhost -c 10  -j 10 -t 50000 testpgbench; } 2>&1 | tee -a
pgstatsResultsPg-stats-memory;done

Test 3:
branch dev-max-memory
CFLAGS="-I/usr/include/python3.8/ " /home/rthompso/src/git/postgres/configure --silent
--prefix=/home/rthompso/src/git/postgres/install/dev-max-memory/--with-openssl --with-tcl
--with-tclconfig=/usr/lib/tcl8.6--with-perl --with-libxml --with-libxslt --with-python --with-gssapi --with-systemd
--with-ldap--enable-nls
make -s -j12 && make -s install
initdb
default postgresql.conf settings
init pgbench pgbench -U rthompso -p 5433 -h localhost -i -s 50 testpgbench
10 iterations
for ctr in {1..10}; do     { time pgbench  -p 5433 -h localhost -c 10  -j 10 -t 50000 testpgbench; } 2>&1 | tee -a
pgstatsResultsDev-max-memory;done

Test 4:
branch dev-max-memory
CFLAGS="-I/usr/include/python3.8/ " /home/rthompso/src/git/postgres/configure --silent
--prefix=/home/rthompso/src/git/postgres/install/dev-max-memory/--with-openssl --with-tcl
--with-tclconfig=/usr/lib/tcl8.6--with-perl --with-libxml --with-libxslt --with-python --with-gssapi --with-systemd
--with-ldap--enable-nls
make -s -j12 && make -s install
initdb
non-default postgresql.conf setting for max_total_backend_memory = 100MB
init pgbench pgbench -U rthompso -p 5433 -h localhost -i -s 50 testpgbench
10 iterations
for ctr in {1..10}; do     { time pgbench  -p 5433 -h localhost -c 10  -j 10 -t 50000 testpgbench; } 2>&1 | tee -a
pgstatsResultsDev-max-memory100MB;done

Laptop
11th Gen Intel(R) Core(TM) i7-11850H @ 2.50GHz 8 Cores 16 threads
32GB RAM
SSD drive

Averages from the 10 runs and tps difference over the 10 runs

|------------------+------------------+------------------------+-------------------+------------------+-------------------+---------------+------------------|
| Test Run         | Master           | Track Memory Allocated | Diff from Master  | Max Mem off      | Diff from
Master | Max Mem 100MB | Diff from Master |
| Set 1            | Test 1           | Test 2                 |                   | Test 3           |
 | Test 4        |                  |
| latency average  | 2.43390909090909 | 2.44327272727273       |                   | 2.44381818181818 |
 | 2.6843        |                  |
| tps inc conn est | 3398.99291372727 | 3385.40984336364       | -13.583070363637  | 3385.08184309091 |
-13.9110706363631| 3729.5363413  | 330.54342757273  |
| tps exc conn est | 3399.12185727273 | 3385.52527490909       | -13.5965823636366 | 3385.22100872727 |
-13.9008485454547| 3729.7097607  | 330.58790342727  |

|------------------+------------------+------------------------+-------------------+------------------+-------------------+---------------+------------------|
| Set 2            |                  |                        |                   |                  |
 |               |                  |
| latency average  | 2.691            | 2.6895                 | 2                 | 2.69             | 3
 | 2.6827        | 4                |
| tps inc conn est | 3719.56          | 3721.7587106           | 2.1987106         | 3720.3           | .74
 | 3730.86       | 11.30            |
| tps exc conn est | 3719.71          | 3721.9268465           | 2.2168465         | 3720.47          | .76
 | 3731.02       | 11.31            |

|------------------+------------------+------------------------+-------------------+------------------+-------------------+---------------+------------------|


> I think it may be necessary to track the current allocation size in
> shared memory (with atomic increments?).  Maybe decrements would need
> to
> be exactly accounted for, or otherwise Assert() that the value is not
> negative.  I don't know how expensive it'd be to have conditionals
> for
> each decrement, but maybe the value would only be decremented at
> strategic times, like at transaction commit or backend shutdown.
>

--
Reid Thompson
Senior Software Engineer
Crunchy Data, Inc.

reid.thompson@crunchydata.com
www.crunchydata.com
Attachment
Re: Add the ability to limit the amount of memory that can be allocated to backends.
On Thu, 2022-09-01 at 11:48 +0900, Kyotaro Horiguchi wrote:
> >
> > The patch seems to limit both of memory-context allocations and DSM
> > allocations happen on a specific process by the same budget. In the
> > fist place I don't think it's sensible to cap the amount of DSM
> > allocations by per-process budget.
> >
> > DSM is used by pgstats subsystem. There can be cases where pgstat
> > complains for denial of DSM allocation after the budget has been
> > exhausted by memory-context allocations, or every command complains
> > for denial of memory-context allocation after once the per-process
> > budget is exhausted by DSM allocations. That doesn't seem
> > reasonable.
> > regards.

It's intended as a mechanism for administrators to limit total
postgresql memory consumption to avoid the OOM killer causing a crash
and restart, or to ensure that resources are available for other
processes on shared hosts, etc. It limits all types of allocations in
order to accomplish this.  Our documentation will note this, so that
administrators that have the need to set it are aware that it can
affect all non-auxiliary processes and what the effect is.
Re: Add the ability to limit the amount of memory that can be allocated to backends.
On Fri, 2022-09-02 at 09:30 +0200, Drouvot, Bertrand wrote:
> Hi,
>
> I'm not sure we are choosing the right victims here (aka the ones
> that are doing the request that will push the total over the limit).
>
> Imagine an extreme case where a single backend consumes say 99% of
> the limit, shouldn't it be the one to be "punished"? (and somehow forced
> to give the memory back).
>
> The problem that i see with the current approach is that a "bad"
> backend could impact all the others and continue to do so.
>
> what about punishing say the highest consumer , what do you think?
> (just speaking about the general idea here, not about the implementation)

Initially, we believe that punishing the detector is reasonable if we
can help administrators avoid the OOM killer/resource starvation.  But
we can and should expand on this idea.

Another thought is, rather than just failing the query/transaction we
have the affected backend do a clean exit, freeing all it's resources.


--
Reid Thompson
Senior Software Engineer
Crunchy Data, Inc.

reid.thompson@crunchydata.com
www.crunchydata.com
Re: Add the ability to limit the amount of memory that can be allocated to backends.
Greetings,

* David Rowley (dgrowleyml@gmail.com) wrote:
> On Thu, 1 Sept 2022 at 04:52, Reid Thompson
> <reid.thompson@crunchydata.com> wrote:
> > Add the ability to limit the amount of memory that can be allocated to
> > backends.
>
> Are you aware that relcache entries are stored in backend local memory
> and that once we've added a relcache entry for a relation that we have
> no current code which attempts to reduce the memory consumption used
> by cache entries when there's memory pressure?

Short answer to this is yes, and that's an issue, but it isn't this
patch's problem to deal with- that's an issue that the relcache system
needs to be changed to address.

> It seems to me that if we had this feature as you propose that a
> backend could hit the limit and stay there just from the memory
> requirements of the relation cache after some number of tables have
> been accessed from the given backend. It's not hard to imagine a
> situation where the palloc() would start to fail during parse, which
> might make it quite infuriating for anyone trying to do something
> like:

Agreed that this could happen but I don't imagine it to be super likely-
and even if it does, this is probably a better position to be in as the
backend could then be disconnected from and would then go away and its
memory free'd, unlike the current OOM-killer situation where we crash
and go through recovery.  We should note this in the documentation
though, sure, so that administrators understand how this can occur and
can take action to address it.

> I think a better solution to this problem would be to have "memory
> grants", where we configure some amount of "pool" memory that backends
> are allowed to use for queries.  The planner would have to add the
> expected number of work_mem that the given query is expected to use
> and before that query starts, the executor would have to "checkout"
> that amount of memory from the pool and return it when finished.  If
> there is not enough memory in the pool then the query would have to
> wait until enough memory is available.   This creates a deadlocking
> hazard that the deadlock detector would need to be made aware of.

Sure, that also sounds great and a query acceptance system would be
wonderful.  If someone is working on that with an expectation of it
landing before v16, great.  Otherwise, I don't see it as relevant to
the question about if we should include this feature or not, and I'm not
even sure that we'd refuse this feature even if we already had an
acceptance system as a stop-gap should we guess wrong and not realize it
until it's too late.

Thanks,

Stephen
Attachment
Re: Add the ability to limit the amount of memory that can be allocated to backends.
On Sat, Sep 03, 2022 at 11:40:03PM -0400, Reid Thompson wrote:
> > > +               0, 0, INT_MAX,
> > > +               NULL, NULL, NULL
> > I think this needs a maximum like INT_MAX/1024/1024
>
> Is this noting that we'd set a ceiling of 2048MB?

The reason is that you're later multiplying it by 1024*1024, so you need
to limit it to avoid overflowing.  Compare with
min_dynamic_shared_memory, Log_RotationSize, maintenance_work_mem,
autovacuum_work_mem.

typo: Explicitely

+                        errmsg("request will exceed postgresql.conf defined max_total_backend_memory limit (%lu >
%lu)",

I wouldn't mention postgresql.conf - it could be in
postgresql.auto.conf, or an include file, or a -c parameter.
Suggest: allocation would exceed max_total_backend_memory limit...

+               ereport(LOG, errmsg("decrease reduces reported backend memory allocated below zero; setting reported to
0"));

Suggest: deallocation would decrease backend memory below zero;

+               {"max_total_backend_memory", PGC_SIGHUP, RESOURCES_MEM,


Should this be PGC_SU_BACKEND to allow a superuser to set a higher
limit (or no limit)?

There's compilation warning under mingw cross compile due to
sizeof(long).  See d914eb347 and other recent commits which I guess is
the current way to handle this.
http://cfbot.cputube.org/reid-thompson.html

For performance test, you'd want to check what happens with a large
number of max_connections (and maybe a large number of clients).  TPS
isn't the only thing that matters.  For example, a utility command might
sometimes do a lot of allocations (or deallocations), or a
"parameterized nested loop" may loop over over many outer tuples and
reset for each.  There's also a lot of places that reset to a
"per-tuple" context.  I started looking at its performance, but nothing
to show yet.

Would you keep people copied on your replies ("reply all") ?  Otherwise
I (at least) may miss them.  I think that's what's typical on these
lists (and the list tool is smart enough not to send duplicates to
people who are direct recipients).

--
Justin
Re: Add the ability to limit the amount of memory that can be allocated to backends.
On Fri, 2022-09-09 at 12:14 -0500, Justin Pryzby wrote:
> On Sat, Sep 03, 2022 at 11:40:03PM -0400, Reid Thompson wrote:
> > > > +               0, 0, INT_MAX,
> > > > +               NULL, NULL, NULL
> > > I think this needs a maximum like INT_MAX/1024/1024
> >
> > Is this noting that we'd set a ceiling of 2048MB?
>
> The reason is that you're later multiplying it by 1024*1024, so you
> need
> to limit it to avoid overflowing.  Compare with
> min_dynamic_shared_memory, Log_RotationSize, maintenance_work_mem,
> autovacuum_work_mem.

What I originally attempted to implement is:
GUC "max_total_backend_memory" max value as INT_MAX = 2147483647 MB
(2251799812636672 bytes). And the other variables and comparisons as
bytes represented as uint64 to avoid overflow.

Is this invalid?

> typo: Explicitely

corrected

> +                        errmsg("request will exceed postgresql.conf
> defined max_total_backend_memory limit (%lu > %lu)",
>
> I wouldn't mention postgresql.conf - it could be in
> postgresql.auto.conf, or an include file, or a -c parameter.
> Suggest: allocation would exceed max_total_backend_memory limit...
>

updated

>
> +               ereport(LOG, errmsg("decrease reduces reported
> backend memory allocated below zero; setting reported to 0"));
>
> Suggest: deallocation would decrease backend memory below zero;

updated

> +               {"max_total_backend_memory", PGC_SIGHUP,
> RESOURCES_MEM,
>
>
>
> Should this be PGC_SU_BACKEND to allow a superuser to set a higher
> limit (or no limit)?

Sounds good to me. I'll update to that.
Would PGC_SUSET be too open?

> There's compilation warning under mingw cross compile due to
> sizeof(long).  See d914eb347 and other recent commits which I guess
> is
> the current way to handle this.
> http://cfbot.cputube.org/reid-thompson.html

updated %lu to %llu and changed cast from uint64 to
unsigned long long in the ereport call

> For performance test, you'd want to check what happens with a large
> number of max_connections (and maybe a large number of clients).  TPS
> isn't the only thing that matters.  For example, a utility command
> might
> sometimes do a lot of allocations (or deallocations), or a
> "parameterized nested loop" may loop over over many outer tuples and
> reset for each.  There's also a lot of places that reset to a
> "per-tuple" context.  I started looking at its performance, but
> nothing
> to show yet.

Thanks

> Would you keep people copied on your replies ("reply all") ?
> Otherwise
> I (at least) may miss them.  I think that's what's typical on these
> lists (and the list tool is smart enough not to send duplicates to
> people who are direct recipients).

Ok - will do, thanks.

--
Reid Thompson
Senior Software Engineer
Crunchy Data, Inc.

reid.thompson@crunchydata.com
www.crunchydata.com
Attachment
Re: Add the ability to limit the amount of memory that can be allocated to backends.
On Fri, 2022-09-09 at 12:14 -0500, Justin Pryzby wrote:
> On Sat, Sep 03, 2022 at 11:40:03PM -0400, Reid Thompson wrote:
> > > > + 0, 0, INT_MAX,
> > > > + NULL, NULL, NULL
> > > I think this needs a maximum like INT_MAX/1024/1024
> >
> > Is this noting that we'd set a ceiling of 2048MB?
>
> The reason is that you're later multiplying it by 1024*1024, so you
> need
> to limit it to avoid overflowing. Compare with
> min_dynamic_shared_memory, Log_RotationSize, maintenance_work_mem,
> autovacuum_work_mem.
What I originally attempted to implement is:
GUC "max_total_backend_memory" max value as INT_MAX = 2147483647 MB
(2251799812636672 bytes). And the other variables and comparisons as
bytes represented as uint64 to avoid overflow.
Is this invalid?
> typo: Explicitely
corrected
> + errmsg("request will exceed postgresql.conf
> defined max_total_backend_memory limit (%lu > %lu)",
>
> I wouldn't mention postgresql.conf - it could be in
> postgresql.auto.conf, or an include file, or a -c parameter.
> Suggest: allocation would exceed max_total_backend_memory limit...
>
updated
>
> + ereport(LOG, errmsg("decrease reduces reported
> backend memory allocated below zero; setting reported to 0"));
>
> Suggest: deallocation would decrease backend memory below zero;
updated
> + {"max_total_backend_memory", PGC_SIGHUP,
> RESOURCES_MEM,
>
>
>
> Should this be PGC_SU_BACKEND to allow a superuser to set a higher
> limit (or no limit)?
Sounds good to me. I'll update to that.
Would PGC_SUSET be too open?
> There's compilation warning under mingw cross compile due to
> sizeof(long). See d914eb347 and other recent commits which I guess
> is
> the current way to handle this.
> http://cfbot.cputube.org/reid-thompson.html
updated %lu to %llu and changed cast from uint64 to
unsigned long long in the ereport call
> For performance test, you'd want to check what happens with a large
> number of max_connections (and maybe a large number of clients). TPS
> isn't the only thing that matters. For example, a utility command
> might
> sometimes do a lot of allocations (or deallocations), or a
> "parameterized nested loop" may loop over over many outer tuples and
> reset for each. There's also a lot of places that reset to a
> "per-tuple" context. I started looking at its performance, but
> nothing
> to show yet.
Thanks
> Would you keep people copied on your replies ("reply all") ?
> Otherwise
> I (at least) may miss them. I think that's what's typical on these
> lists (and the list tool is smart enough not to send duplicates to
> people who are direct recipients).
Ok - will do, thanks.
--
Reid Thompson
Senior Software Engineer
Crunchy Data, Inc.
reid.thompson@crunchydata.com
www.crunchydata.com
patching file src/backend/utils/misc/guc.c
Hunk #1 FAILED at 3664.
1 out of 1 hunk FAILED -- saving rejects to file src/backend/utils/misc/guc.c.rej
Re: Add the ability to limit the amount of memory that can be allocated to backends.
On Thu, 2022-09-15 at 12:07 +0400, Ibrar Ahmed wrote:
>
> The patch does not apply; please rebase the patch.
>
> patching file src/backend/utils/misc/guc.c
> Hunk #1 FAILED at 3664.
> 1 out of 1 hunk FAILED -- saving rejects to file
> src/backend/utils/misc/guc.c.rej
>
> patching file src/backend/utils/misc/postgresql.conf.sample
>

rebased patches attached.

Thanks,
Reid
Attachment
Re: Add the ability to limit the amount of memory that can be allocated to backends.
Hello Reid,
could you rebase the patch again? It doesn't apply currently (http://cfbot.cputube.org/patch_40_3867.log). Thanks!
You mention, that you want to prevent the compiler from getting cute.
I don't think this comments are exactly helpful in the current state. I think probably fine to just omit them.
I don't understand the purpose of the result variable in exceeds_max_total_bkend_mem. What purpose does it serve?
I really like the simplicity of the suggestion here to prevent oom.
Regards
Arne
Sent: Thursday, September 15, 2022 4:58:19 PM
To: Ibrar Ahmed; pgsql-hackers@lists.postgresql.org
Cc: reid.thompson@crunchydata.com; Justin Pryzby
Subject: Re: Add the ability to limit the amount of memory that can be allocated to backends.
>
> The patch does not apply; please rebase the patch.
>
> patching file src/backend/utils/misc/guc.c
> Hunk #1 FAILED at 3664.
> 1 out of 1 hunk FAILED -- saving rejects to file
> src/backend/utils/misc/guc.c.rej
>
> patching file src/backend/utils/misc/postgresql.conf.sample
>
rebased patches attached.
Thanks,
Reid
Re: Add the ability to limit the amount of memory that can be allocated to backends.
Hi Arne,

On Mon, 2022-10-24 at 15:27 +0000, Arne Roland wrote:
> Hello Reid,
>
> could you rebase the patch again? It doesn't apply currently
> (http://cfbot.cputube.org/patch_40_3867.log). Thanks!

rebased patches attached.

> You mention, that you want to prevent the compiler from getting
> cute.I don't think this comments are exactly helpful in the current
> state. I think probably fine to just omit them.

I attempted to follow previous convention when adding code and these
comments have been consistently applied throughout backend_status.c
where a volatile pointer is being used.

> I don't understand the purpose of the result variable in
> exceeds_max_total_bkend_mem. What purpose does it serve?
>
> I really like the simplicity of the suggestion here to prevent oom.

If max_total_backend_memory is configured, exceeds_max_total_bkend_mem()
will return true if an allocation request will push total backend memory
allocated over the configured value.

exceeds_max_total_bkend_mem() is implemented in the various allocators
along the lines of
...snip...
        /* Do not exceed maximum allowed memory allocation */
        if (exceeds_max_total_bkend_mem('new request size'))

            return NULL;

...snip...
Do not allocate the memory requested, return NULL instead. PG already
had code in place to handle NULL returns from allocation requests.

The allocation code in aset.c, slab.c, generation.c, dsm_impl.c utilizes
 exceeds_max_total_bkend_mem()

max_total_backend_memory (integer)
Specifies a limit to the amount of memory (MB) that may be allocated
to backends in total (i.e. this is not a per user or per backend limit).
If unset, or set to 0 it is disabled. A backend request that would push
the total over the limit will be denied with an out of memory error
causing that backend's current query/transaction to fail. Due to the
dynamic nature of memory allocations, this limit is not exact. If within
1.5MB of the limit and two backends request 1MB each at the same time
both may be allocated, and exceed the limit. Further requests will not
be allocated until dropping below the limit. Keep this in mind when
setting this value. This limit does not affect auxiliary backend
processes Auxiliary process . Backend memory allocations
(backend_mem_allocated) are displayed in the pg_stat_activity view.

> I intent to play around with a lot of backends, once I get a rebased
> patch.
>
> Regards
> Arne
Attachment
Re: Add the ability to limit the amount of memory that can be allocated to backends.
On Tue, 2022-10-25 at 11:49 -0400, Reid Thompson wrote:
> Hi Arne,
>
> On Mon, 2022-10-24 at 15:27 +0000, Arne Roland wrote:
> > Hello Reid,
> >
> > could you rebase the patch again? It doesn't apply currently
> > (http://cfbot.cputube.org/patch_40_3867.log). Thanks!
>
> rebased patches attached.

Rebased to current. Add a couple changes per conversation with D
Christensen (include units in field name, group field with backend_xid
and backend_xmin fields in pg_stat_activity view, rather than between
query_id and query)

--
Reid Thompson
Senior Software Engineer
Crunchy Data, Inc.

reid.thompson@crunchydata.com
www.crunchydata.com
Attachment
Re: Add the ability to limit the amount of memory that can be allocated to backends.
On Thu, 2022-11-03 at 11:48 -0400, Reid Thompson wrote:
> On Tue, 2022-10-25 at 11:49 -0400, Reid Thompson wrote:
>
> Rebased to current. Add a couple changes per conversation with D
> Christensen (include units in field name, group field with
> backend_xid
> and backend_xmin fields in pg_stat_activity view, rather than between
> query_id and query)
>

rebased/patched to current master && current pg-stat-activity-backend-memory-allocated

--
Reid Thompson
Senior Software Engineer
Crunchy Data, Inc.

reid.thompson@crunchydata.com
www.crunchydata.com
Attachment
Re: Add the ability to limit the amount of memory that can be allocated to backends.
Hi,

On 2022-11-26 22:22:15 -0500, Reid Thompson wrote:
> rebased/patched to current master && current pg-stat-activity-backend-memory-allocated

This version fails to build with msvc, and builds with warnings on other
platforms.
https://cirrus-ci.com/build/5410696721072128
msvc:
[20:26:51.286] c:\cirrus\src\include\utils/backend_status.h(40): error C2059: syntax error: 'constant'

mingw cross:
[20:26:26.358]                  from /usr/share/mingw-w64/include/winsock2.h:23,
[20:26:26.358]                  from ../../src/include/port/win32_port.h:60,
[20:26:26.358]                  from ../../src/include/port.h:24,
[20:26:26.358]                  from ../../src/include/c.h:1306,
[20:26:26.358]                  from ../../src/include/postgres.h:47,
[20:26:26.358]                  from controldata_utils.c:18:
[20:26:26.358] ../../src/include/utils/backend_status.h:40:2: error: expected identifier before numeric constant
[20:26:26.358]    40 |  IGNORE,
[20:26:26.358]       |  ^~~~~~
[20:26:26.358] In file included from ../../src/include/postgres.h:48,
[20:26:26.358]                  from controldata_utils.c:18:
[20:26:26.358] ../../src/include/utils/backend_status.h: In function ‘pgstat_report_allocated_bytes’:
[20:26:26.358] ../../src/include/utils/backend_status.h:365:12: error: format ‘%ld’ expects argument of type ‘long
int’,but argument 3 has type ‘uint64’ {aka ‘long long unsigned int’} [-Werror=format=]

[20:26:26.358]   365 |     errmsg("Backend %d deallocated %ld bytes, exceeding the %ld bytes it is currently reporting
allocated.Setting reported to 0.",

[20:26:26.358]       |
^~~~~~~~~~~~~~~~~~~~~~~~~~~~~~~~~~~~~~~~~~~~~~~~~~~~~~~~~~~~~~~~~~~~~~~~~~~~~~~~~~~~~~~~~~~~~~~~~~~~~~~~~~~~~~~~~~~~~~~
[20:26:26.358]   366 |         MyProcPid, allocated_bytes, *my_allocated_bytes));
[20:26:26.358]       |                    ~~~~~~~~~~~~~~~
[20:26:26.358]       |                    |
[20:26:26.358]       |                    uint64 {aka long long unsigned int}

Due to windows having long be 32bit, you need to use %lld. Our custom to deal
with that is to cast the argument to errmsg as long long unsigned and use
%llu.

Btw, given that the argument is uint64, it doesn't seem correct to use %ld,
that's signed. Not that it's going to matter, but ...

Greetings,

Andres Freund
Re: Add the ability to limit the amount of memory that can be allocated to backends.
On Tue, 2022-12-06 at 10:32 -0800, Andres Freund wrote:
> Hi,
>
> On 2022-11-26 22:22:15 -0500, Reid Thompson wrote:
> > rebased/patched to current master && current pg-stat-activity-
> > backend-memory-allocated
>
> This version fails to build with msvc, and builds with warnings on
> other
> platforms.
> https://cirrus-ci.com/build/5410696721072128
> msvc:
>
> Andres Freund

updated patches

--
Reid Thompson
Senior Software Engineer
Crunchy Data, Inc.

reid.thompson@crunchydata.com
www.crunchydata.com
Attachment
Re: Add the ability to limit the amount of memory that can be allocated to backends.
On Fri, 9 Dec 2022 at 20:41, Reid Thompson
<reid.thompson@crunchydata.com> wrote:
>
> On Tue, 2022-12-06 at 10:32 -0800, Andres Freund wrote:
> > Hi,
> >
> > On 2022-11-26 22:22:15 -0500, Reid Thompson wrote:
> > > rebased/patched to current master && current pg-stat-activity-
> > > backend-memory-allocated
> >
> > This version fails to build with msvc, and builds with warnings on
> > other
> > platforms.
> > https://cirrus-ci.com/build/5410696721072128
> > msvc:
> >
> > Andres Freund
>
> updated patches

The patch does not apply on top of HEAD as in [1], please post a rebased patch:
=== Applying patches on top of PostgreSQL commit ID
92957ed98c5c565362ce665266132a7f08f6b0c0 ===
=== applying patch
./0001-Add-tracking-of-backend-memory-allocated-to-pg_stat_.patch
...
patching file src/backend/utils/mmgr/slab.c
Hunk #1 succeeded at 69 (offset 16 lines).
Hunk #2 succeeded at 414 (offset 175 lines).
Hunk #3 succeeded at 436 with fuzz 2 (offset 176 lines).
Hunk #4 FAILED at 286.
Hunk #5 succeeded at 488 (offset 186 lines).
Hunk #6 FAILED at 381.
Hunk #7 FAILED at 554.
3 out of 7 hunks FAILED -- saving rejects to file
src/backend/utils/mmgr/slab.c.rej

[1] - http://cfbot.cputube.org/patch_41_3867.log

Regards,
Vignesh
Re: Add the ability to limit the amount of memory that can be allocated to backends.
On Tue, 2023-01-03 at 16:22 +0530, vignesh C wrote:
> ....
> The patch does not apply on top of HEAD as in [1], please post a
> rebased patch:
> ...
> Regards,
> Vignesh
>

Attached is rebased patch, with some updates related to committed changes.

Thanks,
Reid

--
Reid Thompson
Senior Software Engineer
Crunchy Data, Inc.

reid.thompson@crunchydata.com
www.crunchydata.com
Attachment
Re: Add the ability to limit the amount of memory that can be allocated to backends.
Hi,

On 2023-01-05 13:44:20 -0500, Reid Thompson wrote:
> From 0a6b152e0559a250dddd33bd7d43eb0959432e0d Mon Sep 17 00:00:00 2001
> From: Reid Thompson <jreidthompson@nc.rr.com>
> Date: Thu, 11 Aug 2022 12:01:25 -0400
> Subject: [PATCH 1/2] Add tracking of backend memory allocated to
>  pg_stat_activity
>
> This new field displays the current bytes of memory allocated to the
> backend process. It is updated as memory for the process is
> malloc'd/free'd. Memory allocated to items on the freelist is included in
> the displayed value.

It doesn't actually malloc/free. It tracks palloc/pfree.


> Dynamic shared memory allocations are included only in the value displayed
> for the backend that created them, they are not included in the value for
> backends that are attached to them to avoid double counting.

As mentioned before, I don't think accounting DSM this way makes sense.


> --- a/src/backend/postmaster/autovacuum.c
> +++ b/src/backend/postmaster/autovacuum.c
> @@ -407,6 +407,9 @@ StartAutoVacLauncher(void)
>
>  #ifndef EXEC_BACKEND
>          case 0:
> +            /* Zero allocated bytes to avoid double counting parent allocation */
> +            pgstat_zero_my_allocated_bytes();
> +
>              /* in postmaster child ... */
>              InitPostmasterChild();


> @@ -1485,6 +1488,9 @@ StartAutoVacWorker(void)
>
>  #ifndef EXEC_BACKEND
>          case 0:
> +            /* Zero allocated bytes to avoid double counting parent allocation */
> +            pgstat_zero_my_allocated_bytes();
> +
>              /* in postmaster child ... */
>              InitPostmasterChild();
>
> diff --git a/src/backend/postmaster/postmaster.c b/src/backend/postmaster/postmaster.c
> index eac3450774..24278e5c18 100644
> --- a/src/backend/postmaster/postmaster.c
> +++ b/src/backend/postmaster/postmaster.c
> @@ -4102,6 +4102,9 @@ BackendStartup(Port *port)
>      {
>          free(bn);
>
> +        /* Zero allocated bytes to avoid double counting parent allocation */
> +        pgstat_zero_my_allocated_bytes();
> +
>          /* Detangle from postmaster */
>          InitPostmasterChild();


It doesn't at all seem right to call pgstat_zero_my_allocated_bytes() here,
before even InitPostmasterChild() is called. Nor does it seem right to add the
call to so many places.

Note that this is before we even delete postmaster's memory, see e.g.:
    /*
     * If the PostmasterContext is still around, recycle the space; we don't
     * need it anymore after InitPostgres completes.  Note this does not trash
     * *MyProcPort, because ConnCreate() allocated that space with malloc()
     * ... else we'd need to copy the Port data first.  Also, subsidiary data
     * such as the username isn't lost either; see ProcessStartupPacket().
     */
    if (PostmasterContext)
    {
        MemoryContextDelete(PostmasterContext);
        PostmasterContext = NULL;
    }

calling pgstat_zero_my_allocated_bytes() before we do this will lead to
undercounting memory usage, afaict.


> +/* Enum helper for reporting memory allocated bytes */
> +enum allocation_direction
> +{
> +    PG_ALLOC_DECREASE = -1,
> +    PG_ALLOC_IGNORE,
> +    PG_ALLOC_INCREASE,
> +};

What's the point of this?


> +/* ----------
> + * pgstat_report_allocated_bytes() -
> + *
> + *  Called to report change in memory allocated for this backend.
> + *
> + * my_allocated_bytes initially points to local memory, making it safe to call
> + * this before pgstats has been initialized. allocation_direction is a
> + * positive/negative multiplier enum defined above.
> + * ----------
> + */
> +static inline void
> +pgstat_report_allocated_bytes(int64 allocated_bytes, int allocation_direction)

I don't think this should take allocation_direction as a parameter, I'd make
it two different functions.


> +{
> +    uint64        temp;
> +
> +    /*
> +     * Avoid *my_allocated_bytes unsigned integer overflow on
> +     * PG_ALLOC_DECREASE
> +     */
> +    if (allocation_direction == PG_ALLOC_DECREASE &&
> +        pg_sub_u64_overflow(*my_allocated_bytes, allocated_bytes, &temp))
> +    {
> +        *my_allocated_bytes = 0;
> +        ereport(LOG,
> +                errmsg("Backend %d deallocated %lld bytes, exceeding the %llu bytes it is currently reporting
allocated.Setting reported to 0.",

> +                       MyProcPid, (long long) allocated_bytes,
> +                       (unsigned long long) *my_allocated_bytes));

We certainly shouldn't have an ereport in here. This stuff really needs to be
cheap.


> +    }
> +    else
> +        *my_allocated_bytes += (allocated_bytes) * allocation_direction;

Superfluous parens?


> +/* ----------
> + * pgstat_get_all_memory_allocated() -
> + *
> + *    Return a uint64 representing the current shared memory allocated to all
> + *    backends.  This looks directly at the BackendStatusArray, and so will
> + *    provide current information regardless of the age of our transaction's
> + *    snapshot of the status array.
> + *    In the future we will likely utilize additional values - perhaps limit
> + *    backend allocation by user/role, etc.
> + * ----------
> + */
> +uint64
> +pgstat_get_all_backend_memory_allocated(void)
> +{
> +    PgBackendStatus *beentry;
> +    int            i;
> +    uint64        all_memory_allocated = 0;
> +
> +    beentry = BackendStatusArray;
> +
> +    /*
> +     * We probably shouldn't get here before shared memory has been set up,
> +     * but be safe.
> +     */
> +    if (beentry == NULL || BackendActivityBuffer == NULL)
> +        return 0;
> +
> +    /*
> +     * We include AUX procs in all backend memory calculation
> +     */
> +    for (i = 1; i <= NumBackendStatSlots; i++)
> +    {
> +        /*
> +         * We use a volatile pointer here to ensure the compiler doesn't try
> +         * to get cute.
> +         */
> +        volatile PgBackendStatus *vbeentry = beentry;
> +        bool        found;
> +        uint64        allocated_bytes = 0;
> +
> +        for (;;)
> +        {
> +            int            before_changecount;
> +            int            after_changecount;
> +
> +            pgstat_begin_read_activity(vbeentry, before_changecount);
> +
> +            /*
> +             * Ignore invalid entries, which may contain invalid data.
> +             * See pgstat_beshutdown_hook()
> +             */
> +            if (vbeentry->st_procpid > 0)
> +                allocated_bytes = vbeentry->allocated_bytes;
> +
> +            pgstat_end_read_activity(vbeentry, after_changecount);
> +
> +            if ((found = pgstat_read_activity_complete(before_changecount,
> +                                                       after_changecount)))
> +                break;
> +
> +            /* Make sure we can break out of loop if stuck... */
> +            CHECK_FOR_INTERRUPTS();
> +        }
> +
> +        if (found)
> +            all_memory_allocated += allocated_bytes;
> +
> +        beentry++;
> +    }
> +
> +    return all_memory_allocated;
> +}
> +
> +/*
> + * Determine if allocation request will exceed max backend memory allowed.
> + * Do not apply to auxiliary processes.
> + */
> +bool
> +exceeds_max_total_bkend_mem(uint64 allocation_request)
> +{
> +    bool        result = false;
> +
> +    /* Exclude auxiliary processes from the check */
> +    if (MyAuxProcType != NotAnAuxProcess)
> +        return result;
> +
> +    /* Convert max_total_bkend_mem to bytes for comparison */
> +    if (max_total_bkend_mem &&
> +        pgstat_get_all_backend_memory_allocated() +
> +        allocation_request > (uint64) max_total_bkend_mem * 1024 * 1024)
> +    {
> +        /*
> +         * Explicitly identify the OOM being a result of this configuration
> +         * parameter vs a system failure to allocate OOM.
> +         */
> +        ereport(WARNING,
> +                errmsg("allocation would exceed max_total_memory limit (%llu > %llu)",
> +                       (unsigned long long) pgstat_get_all_backend_memory_allocated() +
> +                       allocation_request, (unsigned long long) max_total_bkend_mem * 1024 * 1024));
> +
> +        result = true;
> +    }

I think it's completely unfeasible to execute something as expensive as
pgstat_get_all_backend_memory_allocated() on every allocation. Like,
seriously, no.

And we absolutely definitely shouldn't just add CHECK_FOR_INTERRUPT() calls
into the middle of allocator code.

Greetings,

Andres Freund
Re: Add the ability to limit the amount of memory that can be allocated to backends.
On Mon, 2023-01-09 at 18:31 -0800, Andres Freund wrote:
> Hi,
>
> On 2023-01-05 13:44:20 -0500, Reid Thompson wrote:
> > This new field displays the current bytes of memory allocated to the
> > backend process. It is updated as memory for the process is
> > malloc'd/free'd. Memory allocated to items on the freelist is included in
> > the displayed value.
>
> It doesn't actually malloc/free. It tracks palloc/pfree.

I will update the message

>
> > Dynamic shared memory allocations are included only in the value displayed
> > for the backend that created them, they are not included in the value for
> > backends that are attached to them to avoid double counting.
>
> As mentioned before, I don't think accounting DSM this way makes sense.

Understood, previously you noted 'There are a few uses of DSMs that track
shared resources, with the biggest likely being the stats for relations
etc'.  I'd like to come up with a solution to address this; identifying the
long term allocations to shared state and accounting for them such that they
don't get 'lost' when the allocating backend exits.  Any guidance or
direction would be appreciated.

> > --- a/src/backend/postmaster/autovacuum.c
> > +++ b/src/backend/postmaster/autovacuum.c
> > @@ -407,6 +407,9 @@ StartAutoVacLauncher(void)
> >
> >  #ifndef EXEC_BACKEND
> >          case 0:
> > +            /* Zero allocated bytes to avoid double counting parent allocation */
> > +            pgstat_zero_my_allocated_bytes();
> > +
> >              /* in postmaster child ... */
> >              InitPostmasterChild();
>
>
>
> > @@ -1485,6 +1488,9 @@ StartAutoVacWorker(void)
> >
> >  #ifndef EXEC_BACKEND
> >          case 0:
> > +            /* Zero allocated bytes to avoid double counting parent allocation */
> > +            pgstat_zero_my_allocated_bytes();
> > +
> >              /* in postmaster child ... */
> >              InitPostmasterChild();
> >
> > diff --git a/src/backend/postmaster/postmaster.c b/src/backend/postmaster/postmaster.c
> > index eac3450774..24278e5c18 100644
> > --- a/src/backend/postmaster/postmaster.c
> > +++ b/src/backend/postmaster/postmaster.c
> > @@ -4102,6 +4102,9 @@ BackendStartup(Port *port)
> >      {
> >          free(bn);
> >
> > +        /* Zero allocated bytes to avoid double counting parent allocation */
> > +        pgstat_zero_my_allocated_bytes();
> > +
> >          /* Detangle from postmaster */
> >          InitPostmasterChild();
>
>
> It doesn't at all seem right to call pgstat_zero_my_allocated_bytes() here,
> before even InitPostmasterChild() is called. Nor does it seem right to add the
> call to so many places.
>
> Note that this is before we even delete postmaster's memory, see e.g.:
>     /*
>      * If the PostmasterContext is still around, recycle the space; we don't
>      * need it anymore after InitPostgres completes.  Note this does not trash
>      * *MyProcPort, because ConnCreate() allocated that space with malloc()
>      * ... else we'd need to copy the Port data first.  Also, subsidiary data
>      * such as the username isn't lost either; see ProcessStartupPacket().
>      */
>     if (PostmasterContext)
>     {
>         MemoryContextDelete(PostmasterContext);
>         PostmasterContext = NULL;
>     }
>
> calling pgstat_zero_my_allocated_bytes() before we do this will lead to
> undercounting memory usage, afaict.
>

OK - I'll trace back through these and see if I can better locate and reduce the
number of invocations.

> > +/* Enum helper for reporting memory allocated bytes */
> > +enum allocation_direction
> > +{
> > +    PG_ALLOC_DECREASE = -1,
> > +    PG_ALLOC_IGNORE,
> > +    PG_ALLOC_INCREASE,
> > +};
>
> What's the point of this?
>
>
> > +/* ----------
> > + * pgstat_report_allocated_bytes() -
> > + *
> > + *  Called to report change in memory allocated for this backend.
> > + *
> > + * my_allocated_bytes initially points to local memory, making it safe to call
> > + * this before pgstats has been initialized. allocation_direction is a
> > + * positive/negative multiplier enum defined above.
> > + * ----------
> > + */
> > +static inline void
> > +pgstat_report_allocated_bytes(int64 allocated_bytes, int allocation_direction)
>
> I don't think this should take allocation_direction as a parameter, I'd make
> it two different functions.

Originally it was two functions, a suggestion was made in the thread to
maybe consolidate them to a single function with a direction indicator,
hence the above.  I'm fine with converting it back to separate functions.

>
> > +    if (allocation_direction == PG_ALLOC_DECREASE &&
> > +        pg_sub_u64_overflow(*my_allocated_bytes, allocated_bytes, &temp))
> > +    {
> > +        *my_allocated_bytes = 0;
> > +        ereport(LOG,
> > +                errmsg("Backend %d deallocated %lld bytes, exceeding the %llu bytes it is currently reporting
allocated.Setting reported to 0.",
> > +                       MyProcPid, (long long) allocated_bytes,
> > +                       (unsigned long long) *my_allocated_bytes));
>
> We certainly shouldn't have an ereport in here. This stuff really needs to be
> cheap.

I will remove the ereport.

>
> > +        *my_allocated_bytes += (allocated_bytes) * allocation_direction;
>
> Superfluous parens?

I will remove these.

>
>
> > +/* ----------
> > + * pgstat_get_all_memory_allocated() -
> > + *
> > + *    Return a uint64 representing the current shared memory allocated to all
> > + *    backends.  This looks directly at the BackendStatusArray, and so will
> > + *    provide current information regardless of the age of our transaction's
> > + *    snapshot of the status array.
> > + *    In the future we will likely utilize additional values - perhaps limit
> > + *    backend allocation by user/role, etc.
> > + * ----------
>
> I think it's completely unfeasible to execute something as expensive as
> pgstat_get_all_backend_memory_allocated() on every allocation. Like,
> seriously, no.

Ok. Do we check every nth allocation/try to implement a scheme of checking
more often as we we get closer to the declared max_total_bkend_mem?

>
> And we absolutely definitely shouldn't just add CHECK_FOR_INTERRUPT() calls
> into the middle of allocator code.

I'm open to guidance/suggestions/pointers to remedying these.

> Greetings,
>
> Andres Freund
>


Thanks,
Reid
Re: Add the ability to limit the amount of memory that can be allocated to backends.
Hi,

On 2023-01-13 09:15:10 -0500, Reid Thompson wrote:
> On Mon, 2023-01-09 at 18:31 -0800, Andres Freund wrote:
> > > Dynamic shared memory allocations are included only in the value displayed
> > > for the backend that created them, they are not included in the value for
> > > backends that are attached to them to avoid double counting.
> >
> > As mentioned before, I don't think accounting DSM this way makes sense.
>
> Understood, previously you noted 'There are a few uses of DSMs that track
> shared resources, with the biggest likely being the stats for relations
> etc'.  I'd like to come up with a solution to address this; identifying the
> long term allocations to shared state and accounting for them such that they
> don't get 'lost' when the allocating backend exits.  Any guidance or
> direction would be appreciated.

Tracking it as backend memory usage doesn't seem helpful to me, particularly
because some of it is for server wide data tracking (pgstats, some
caches). But that doesn't mean you couldn't track and report it
separately.


> > > +/* ----------
> > > + * pgstat_get_all_memory_allocated() -
> > > + *
> > > + *    Return a uint64 representing the current shared memory allocated to all
> > > + *    backends.  This looks directly at the BackendStatusArray, and so will
> > > + *    provide current information regardless of the age of our transaction's
> > > + *    snapshot of the status array.
> > > + *    In the future we will likely utilize additional values - perhaps limit
> > > + *    backend allocation by user/role, etc.
> > > + * ----------
> >
> > I think it's completely unfeasible to execute something as expensive as
> > pgstat_get_all_backend_memory_allocated() on every allocation. Like,
> > seriously, no.
>
> Ok. Do we check every nth allocation/try to implement a scheme of checking
> more often as we we get closer to the declared max_total_bkend_mem?

I think it's just not acceptable to do O(connections) work as part of
something critical as memory allocation. Even if amortized imo.

What you could do is to have a single, imprecise, shared counter for the total
memory allocation, and have a backend-local "allowance". When the allowance is
used up, refill it from the shared counter (a single atomic op).

But honestly, I think we first need to have the accounting for a while before
it makes sense to go for the memory limiting patch. And I doubt a single GUC
will suffice to make this usable.


> > And we absolutely definitely shouldn't just add CHECK_FOR_INTERRUPT() calls
> > into the middle of allocator code.
>
> I'm open to guidance/suggestions/pointers to remedying these.

Well, just don't have the CHECK_FOR_INTERRUPT(). Nor the O(N) operation.

You also can't do the ereport(WARNING) there, that itself allocates memory,
and could lead to recursion in some edge cases.

Greetings,

Andres Freund
Re: Add the ability to limit the amount of memory that can be allocated to backends.
On Fri, 6 Jan 2023 at 00:19, Reid Thompson
<reid.thompson@crunchydata.com> wrote:
>
> On Tue, 2023-01-03 at 16:22 +0530, vignesh C wrote:
> > ....
> > The patch does not apply on top of HEAD as in [1], please post a
> > rebased patch:
> > ...
> > Regards,
> > Vignesh
> >
>
> Attached is rebased patch, with some updates related to committed changes.

The patch does not apply on top of HEAD as in [1], please post a rebased patch:
=== Applying patches on top of PostgreSQL commit ID
48880840f18cb75fcaecc77b5e7816b92c27157b ===
=== applying patch
./0001-Add-tracking-of-backend-memory-allocated-to-pg_stat_.patch
....
patching file src/test/regress/expected/rules.out
Hunk #2 FAILED at 1875.
Hunk #4 FAILED at 2090.
2 out of 4 hunks FAILED -- saving rejects to file
src/test/regress/expected/rules.out.rej

[1] - http://cfbot.cputube.org/patch_41_3867.log

Regards,
Vignesh
Re: Add the ability to limit the amount of memory that can be allocated to backends.
On Thu, 2023-01-19 at 16:50 +0530, vignesh C wrote:
>
> The patch does not apply on top of HEAD as in [1], please post a rebased patch:
>
> Regards,
> Vignesh

rebased patch attached

Thanks,
Reid
Attachment
Re: Add the ability to limit the amount of memory that can be allocated to backends.
Hi,

On 2023-01-23 10:48:38 -0500, Reid Thompson wrote:
> On Thu, 2023-01-19 at 16:50 +0530, vignesh C wrote:
> >
> > The patch does not apply on top of HEAD as in [1], please post a rebased patch:
> >
> > Regards,
> > Vignesh
>
> rebased patch attached

I think it's basically still waiting on author, until the O(N) cost is gone
from the overflow limit check.

Greetings,

Andres Freund
Re: Add the ability to limit the amount of memory that can be allocated to backends.
On Mon, 2023-01-23 at 12:31 -0800, Andres Freund wrote:
> Hi,
>
> I think it's basically still waiting on author, until the O(N) cost is gone
> from the overflow limit check.
>
> Greetings,
>
> Andres Freund

Yes, just a rebase. There is still work to be done per earlier in the
thread.

I do want to follow up and note re palloc/pfree vs malloc/free that the
tracking code (0001-Add-tracking-...) is not tracking palloc/pfree but is
explicitely tracking malloc/free. Not every palloc/pfree call executes the
tracking code, only those where the path followed includes malloc() or
free().  Routine palloc() calls fulfilled from the context's
freelist/emptyblocks/freeblock/etc and pfree() calls not invoking free()
avoid the tracking code.

Thanks,
Reid
Re: Add the ability to limit the amount of memory that can be allocated to backends.
Regarding the shared counter noted here,

> What you could do is to have a single, imprecise, shared counter for the total
> memory allocation, and have a backend-local "allowance". When the allowance is
> used up, refill it from the shared counter (a single atomic op).

Is there a preferred or suggested location to put variables like this?
Perhaps a current variable to use as a reference?

Thanks,
Reid
Re: Add the ability to limit the amount of memory that can be allocated to backends.
Hi,

On 2023-01-26 15:27:20 -0500, Reid Thompson wrote:
> Yes, just a rebase. There is still work to be done per earlier in the
> thread.

The tests recently started to fail:

https://cirrus-ci.com/github/postgresql-cfbot/postgresql/commitfest%2F42%2F3867


> I do want to follow up and note re palloc/pfree vs malloc/free that the
> tracking code (0001-Add-tracking-...) is not tracking palloc/pfree but is
> explicitely tracking malloc/free. Not every palloc/pfree call executes the
> tracking code, only those where the path followed includes malloc() or
> free().  Routine palloc() calls fulfilled from the context's
> freelist/emptyblocks/freeblock/etc and pfree() calls not invoking free()
> avoid the tracking code.

Sure, but we create a lot of memory contexts, so that's not a whole lot of
comfort.


I marked this as waiting on author.

Greetings,

Andres Freund
Re: Add the ability to limit the amount of memory that can be allocated to backends.
On Mon, 2023-02-13 at 16:26 -0800, Andres Freund wrote:
> Hi,
>
> The tests recently started to fail:
>
> https://cirrus-ci.com/github/postgresql-cfbot/postgresql/commitfest%2F42%2F3867
>
> I marked this as waiting on author.
>
> Greetings,
>
> Andres Freund

Patch has been rebased to master.

The memory limiting portion (patch 0002-*) has been refactored to utilize a
shared counter for total memory allocation along with backend-local
allowances that are initialized at process startup and refilled from the
central counter upon being used up. Free'd memory is accumulated and
returned to the shared counter upon meeting a threshold and/or upon process
exit. At this point arbitrarily picked 1MB as the initial allowance and
return threshold.

Thanks,
Reid
Attachment
Re: Add the ability to limit the amount of memory that can be allocated to backends.
On 2023-03-02 14:41:26 -0500, reid.thompson@crunchydata.com wrote:
> Patch has been rebased to master.

Quite a few prior review comments seem to not have been
addressed. There's not much point in posting new versions without that.

I think there's zero chance 0002 can make it into 16. If 0001 is cleaned
up, I can see a path.
Re: Add the ability to limit the amount of memory that can be allocated to backends.
Updated patches attached.


====================================================================
pg-stat-activity-backend-memory-allocated
====================================================================
DSM allocations created by a process and not destroyed prior to it's exit are
considered long lived and are tracked in global_dsm_allocated_bytes.

created 2 new system views (see below):

pg_stat_global_memory_allocation view displays datid, shared_memory_size,
shared_memory_size_in_huge_pages, global_dsm_allocated_bytes. shared_memory_size
and shared_memory_size_in_huge_pages display the calculated read only values for
these GUCs.

pg_stat_memory_allocation view
Migrated allocated_bytes out of pg_stat_activity view into this view.
pg_stat_memory_allocation also contains a breakdown of allocation by allocator
type (aset, dsm, generation, slab). View displays datid, pid, allocated_bytes,
aset_allocated_bytes, dsm_allocated_bytes, generation_allocated_bytes,
slab_allocated_bytes by process.

Reduced calls to initialize allocation counters by moving
intialization call into InitPostmasterChild.

postgres=# select * from  pg_stat_global_memory_allocation;
 datid | shared_memory_size | shared_memory_size_in_huge_pages | global_dsm_allocated_bytes
-------+--------------------+----------------------------------+----------------------------
     5 | 192MB              |                               96 |                    1048576
(1 row)


postgres=# select * from  pg_stat_memory_allocation;
 datid |  pid   | allocated_bytes | aset_allocated_bytes | dsm_allocated_bytes | generation_allocated_bytes |
slab_allocated_bytes

-------+--------+-----------------+----------------------+---------------------+----------------------------+----------------------
       | 981842 |          771512 |               771512 |                   0 |                          0 |
        0
       | 981843 |          736696 |               736696 |                   0 |                          0 |
        0
     5 | 981913 |         4274792 |              4274792 |                   0 |                          0 |
        0
       | 981838 |          107216 |               107216 |                   0 |                          0 |
        0
       | 981837 |          123600 |               123600 |                   0 |                          0 |
        0
       | 981841 |          107216 |               107216 |                   0 |                          0 |
        0
(6 rows)

postgres=# select ps.datid, ps.pid, state,application_name,backend_type, pa.* from pg_stat_activity ps join
pg_stat_memory_allocationpa on (pa.pid = ps.pid) order by  dsm_allocated_bytes, pa.pid;
 datid |  pid   | state  | application_name |         backend_type         | datid |  pid   | allocated_bytes |
aset_allocated_bytes| dsm_allocated_bytes | generation_allocated_bytes | slab_allocated_bytes

-------+--------+--------+------------------+------------------------------+-------+--------+-----------------+----------------------+---------------------+----------------------------+----------------------
       | 981837 |        |                  | checkpointer                 |       | 981837 |          123600 |
     123600 |                   0 |                          0 |                    0
       | 981838 |        |                  | background writer            |       | 981838 |          107216 |
     107216 |                   0 |                          0 |                    0
       | 981841 |        |                  | walwriter                    |       | 981841 |          107216 |
     107216 |                   0 |                          0 |                    0
       | 981842 |        |                  | autovacuum launcher          |       | 981842 |          771512 |
     771512 |                   0 |                          0 |                    0
       | 981843 |        |                  | logical replication launcher |       | 981843 |          736696 |
     736696 |                   0 |                          0 |                    0
     5 | 981913 | active | psql             | client backend               |     5 | 981913 |         5390864 |
    5382824 |                   0 |                       8040 |                    0
(6 rows)


====================================================================
dev-max-memory
====================================================================
Include shared_memory_size in max_total_backend_memory calculations.
max_total_backend_memory is reduced by shared_memory_size at startup.
Local allowance is refilled when consumed from global
max_total_bkend_mem_bytes_available.

pg_stat_global_memory_allocation view
add columns max_total_backend_memory_bytes, max_total_bkend_mem_bytes_available.
max_total_backend_memory_bytes displays a byte representation of
max_total_backend_memory. max_total_bkend_mem_bytes_available tracks the balance
of max_total_backend_memory_bytes available to backend processes.

postgres=# select * from  pg_stat_global_memory_allocation;
 datid | shared_memory_size | shared_memory_size_in_huge_pages | max_total_backend_memory_bytes |
max_total_bkend_mem_bytes_available| global_dsm_allocated_bytes

-------+--------------------+----------------------------------+--------------------------------+-------------------------------------+----------------------------
     5 | 192MB              |                               96 |                     2147483648 |
  1874633712 |                    5242880
(1 row)

postgres=# select * from pg_stat_memory_allocation ;
 datid |  pid   | allocated_bytes | aset_allocated_bytes | dsm_allocated_bytes | generation_allocated_bytes |
slab_allocated_bytes

-------+--------+-----------------+----------------------+---------------------+----------------------------+----------------------
       | 534528 |          812472 |               812472 |                   0 |                          0 |
        0
       | 534529 |          736696 |               736696 |                   0 |                          0 |
        0
     5 | 556271 |         4458088 |              4458088 |                   0 |                          0 |
        0
     5 | 534942 |         1298680 |              1298680 |                   0 |                          0 |
        0
     5 | 709283 |         7985464 |              7985464 |                   0 |                          0 |
        0
     5 | 718693 |         8809240 |              8612504 |              196736 |                          0 |
        0
     5 | 752113 |        25803192 |             25803192 |                   0 |                          0 |
        0
     5 | 659886 |         9042232 |              9042232 |                   0 |                          0 |
        0
       | 534525 |         2491088 |              2491088 |                   0 |                          0 |
        0
       | 534524 |         4465360 |              4465360 |                   0 |                          0 |
        0
       | 534527 |          107216 |               107216 |                   0 |                          0 |
        0
(11 rows)


postgres=# select ps.datid, ps.pid, state,application_name,backend_type, pa.* from pg_stat_activity ps join
pg_stat_memory_allocationpa on (pa.pid = ps.pid) order by  dsm_allocated_bytes, pa.pid;
 datid |  pid   | state  | application_name |         backend_type         | datid |  pid   | allocated_bytes |
aset_allocated_bytes| dsm_allocated_bytes | generation_allocated_bytes | slab_allocated_bytes

-------+--------+--------+------------------+------------------------------+-------+--------+-----------------+----------------------+---------------------+----------------------------+----------------------
       | 534524 |        |                  | checkpointer                 |       | 534524 |         4465360 |
    4465360 |                   0 |                          0 |                    0
       | 534525 |        |                  | background writer            |       | 534525 |         2491088 |
    2491088 |                   0 |                          0 |                    0
       | 534527 |        |                  | walwriter                    |       | 534527 |          107216 |
     107216 |                   0 |                          0 |                    0
       | 534528 |        |                  | autovacuum launcher          |       | 534528 |          812472 |
     812472 |                   0 |                          0 |                    0
       | 534529 |        |                  | logical replication launcher |       | 534529 |          736696 |
     736696 |                   0 |                          0 |                    0
     5 | 534942 | idle   | psql             | client backend               |     5 | 534942 |         1298680 |
    1298680 |                   0 |                          0 |                    0
     5 | 556271 | active | psql             | client backend               |     5 | 556271 |         4866576 |
    4858536 |                   0 |                       8040 |                    0
     5 | 659886 | active |                  | autovacuum worker            |     5 | 659886 |         8993080 |
    8993080 |                   0 |                          0 |                    0
     5 | 709283 | active |                  | autovacuum worker            |     5 | 709283 |         7928120 |
    7928120 |                   0 |                          0 |                    0
     5 | 752113 | active |                  | autovacuum worker            |     5 | 752113 |        27935608 |
   27935608 |                   0 |                          0 |                    0
     5 | 718693 | active | psql             | client backend               |     5 | 718693 |         8669976 |
    8473240 |              196736 |                          0 |                    0
(11 rows)
Attachment
Re: Add the ability to limit the amount of memory that can be allocated to backends.
Updated patches attached.

Rebased to current master.
Added additional columns to pg_stat_global_memory_allocation to summarize backend allocations by type.
Updated documentation.
Corrected some issues noted in review by John Morris.
Added code re EXEC_BACKEND for dev-max-memory branch.
Attachment
Re: Add the ability to limit the amount of memory that can be allocated to backends.
Re: Add the ability to limit the amount of memory that can be allocated to backends.
On Wed, 2023-04-19 at 23:28 +0000, Arne Roland wrote:
> > Thank you! I just tried our benchmark and got a performance
> > degration > of around 28 %, which is way better than the last
> > patch.
> >
> > The simple query select * from generate_series(0, 10000000) shows >
> > roughly 18.9 % degradation on my test server.
> >
> > By raising initial_allocation_allowance and >
> > allocation_allowance_refill_qty I can get it to 16 % degradation.
> > So > most of the degradation seems to be independent from raising
> > the > allowance.
> >
> > I think we probably should investigate this further.
> >
> > Regards
> > Arne
> >

Hi Arne,

Thanks for the feedback.

I'm plannning to look at this.

Is your benchmark something that I could utilize? I.E. is it a set of
scripts or a standard test from somewhere that I can duplicate?

Thanks,
Reid
Re: Add the ability to limit the amount of memory that can be allocated to backends.
On Wed, 2023-05-17 at 23:07 -0400, reid.thompson@crunchydata.com wrote:
> Thanks for the feedback.
>
> I'm plannning to look at this.
>
> Is your benchmark something that I could utilize? I.E. is it a set of
> scripts or a standard test from somewhere that I can duplicate?
>
> Thanks,
> Reid
>
Hi Arne,

Followup to the above.

I experimented on my system regarding
"The simple query select * from generate_series(0, 10000000) shows roughly 18.9 % degradation on my test server."

My laptop:
32GB ram
11th Gen Intel(R) Core(TM) i7-11850H 8 cores/16 threads @ 2.50GHz (Max Turbo Frequency. 4.80 GHz ; Cache. 24 MB)
SSD -> Model: KXG60ZNV1T02 NVMe KIOXIA 1024GB (nvme)

I updated to latest master and rebased my patch branches.

I wrote a script to check out, build, install, init, and startup
master, patch 1, patch 1+2, patch 1+2 as master, pg-stats-memory,
dev-max-memory, and dev-max-memory-unset configured with

../../configure --silent --prefix=/home/rthompso/src/git/postgres/install/${dir} --with-openssl --with-tcl
--with-tclconfig=/usr/lib/tcl8.6--with-perl --with-libxml --with-libxslt --with-python --with-gssapi --with-systemd
--with-ldap--enable-nls

where $dir in  master, pg-stats-memory, and dev-max-memory,
dev-max-memory-unset.

The only change made to the default postgresql.conf was to have the
script add to the dev-max-memory instance the line
"max_total_backend_memory = 2048" before startup.
I did find one change in patch 2 that I pushed back into patch 1, this
should only impact the pg-stats-memory instance.

my .psqlrc turns timing on

I created a script where I can pass two instances to be compared.
It invokes
   psql -At -d postgres $connstr -P pager=off -c 'select * from generate_series(0, 10000000)'
100 times on each of the 2 instances and calculates the AVG time and SD
for the 100 runs.  It then uses the AVG from each instance to calculate
the percentage difference.

Depending on the instance, my results differ from master from
negligible to ~5.5%.  Comparing master to itself had up to a ~2%
variation. See below.

------------------------
12 runs comparing dev-max-memory 2048 VS master
Shows ~3% to 5.5% variation

Calculate average runtime percentage difference between VER dev-max-memory 2048 and VER master
1307.14 -> VER dev-max-memory 2048
1240.74 -> VER master
5.21218% difference
--
Calculate average runtime percentage difference between VER dev-max-memory 2048 and VER master
1315.99 -> VER dev-max-memory 2048
1245.64 -> VER master
5.4926% difference
--
Calculate average runtime percentage difference between VER dev-max-memory 2048 and VER master
1317.39 -> VER dev-max-memory 2048
1265.33 -> VER master
4.03141% difference
--
Calculate average runtime percentage difference between VER dev-max-memory 2048 and VER master
1313.52 -> VER dev-max-memory 2048
1256.69 -> VER master
4.42221% difference
--
Calculate average runtime percentage difference between VER dev-max-memory 2048 and VER master
1329.98 -> VER dev-max-memory 2048
1253.75 -> VER master
5.90077% difference
--
Calculate average runtime percentage difference between VER dev-max-memory 2048 and VER master
1314.47 -> VER dev-max-memory 2048
1245.6 -> VER master
5.38032% difference
--
Calculate average runtime percentage difference between VER dev-max-memory 2048 and VER master
1309.7 -> VER dev-max-memory 2048
1258.55 -> VER master
3.98326% difference
--
Calculate average runtime percentage difference between VER dev-max-memory 2048 and VER master
1322.16 -> VER dev-max-memory 2048
1248.94 -> VER master
5.69562% difference
--
Calculate average runtime percentage difference between VER dev-max-memory 2048 and VER master
1320.15 -> VER dev-max-memory 2048
1261.41 -> VER master
4.55074% difference
--
Calculate average runtime percentage difference between VER dev-max-memory 2048 and VER master
1345.22 -> VER dev-max-memory 2048
1280.96 -> VER master
4.8938% difference
--
Calculate average runtime percentage difference between VER dev-max-memory 2048 and VER master
1296.03 -> VER dev-max-memory 2048
1257.06 -> VER master
3.05277% difference
--
Calculate average runtime percentage difference between VER dev-max-memory 2048 and VER master
1319.5 -> VER dev-max-memory 2048
1252.34 -> VER master
5.22272% difference

----------------------------
12 showing dev-max-memory-unset VS master
Shows ~2.5% to 5% variation

Calculate average runtime percentage difference between VER dev-max-memory unset and VER master
1300.93 -> VER dev-max-memory unset
1235.12 -> VER master
5.18996% difference
--
Calculate average runtime percentage difference between VER dev-max-memory unset and VER master
1293.57 -> VER dev-max-memory unset
1263.93 -> VER master
2.31789% difference
--
Calculate average runtime percentage difference between VER dev-max-memory unset and VER master
1303.05 -> VER dev-max-memory unset
1258.11 -> VER master
3.50935% difference
--
Calculate average runtime percentage difference between VER dev-max-memory unset and VER master
1302.14 -> VER dev-max-memory unset
1256.51 -> VER master
3.56672% difference
--
Calculate average runtime percentage difference between VER dev-max-memory unset and VER master
1299.22 -> VER dev-max-memory unset
1282.74 -> VER master
1.27655% difference
--
Calculate average runtime percentage difference between VER dev-max-memory unset and VER master
1334.06 -> VER dev-max-memory unset
1263.77 -> VER master
5.41144% difference
--
Calculate average runtime percentage difference between VER dev-max-memory unset and VER master
1319.92 -> VER dev-max-memory unset
1262.35 -> VER master
4.45887% difference
--
Calculate average runtime percentage difference between VER dev-max-memory unset and VER master
1318.01 -> VER dev-max-memory unset
1257.16 -> VER master
4.7259% difference
--
Calculate average runtime percentage difference between VER dev-max-memory unset and VER master
1316.88 -> VER dev-max-memory unset
1257.63 -> VER master
4.60282% difference
--
Calculate average runtime percentage difference between VER dev-max-memory unset and VER master
1320.33 -> VER dev-max-memory unset
1282.12 -> VER master
2.93646% difference
--
Calculate average runtime percentage difference between VER dev-max-memory unset and VER master
1306.91 -> VER dev-max-memory unset
1246.12 -> VER master
4.76218% difference
--
Calculate average runtime percentage difference between VER dev-max-memory unset and VER master
1320.65 -> VER dev-max-memory unset
1258.78 -> VER master
4.79718% difference
-------------------------------

12 showing pg-stat-activity-only VS master
Shows ~<1% to 2.5% variation

Calculate average runtime percentage difference between VER pg-stat-activity-backend-memory-allocated and VER master
1252.65 -> VER pg-stat-activity-backend-memory-allocated
1245.36 -> VER master
0.583665% difference
--
Calculate average runtime percentage difference between VER pg-stat-activity-backend-memory-allocated and VER master
1294.75 -> VER pg-stat-activity-backend-memory-allocated
1277.55 -> VER master
1.33732% difference
--
Calculate average runtime percentage difference between VER pg-stat-activity-backend-memory-allocated and VER master
1264.11 -> VER pg-stat-activity-backend-memory-allocated
1257.57 -> VER master
0.518702% difference
--
Calculate average runtime percentage difference between VER pg-stat-activity-backend-memory-allocated and VER master
1267.44 -> VER pg-stat-activity-backend-memory-allocated
1251.31 -> VER master
1.28079% difference
--
Calculate average runtime percentage difference between VER pg-stat-activity-backend-memory-allocated and VER master
1270.05 -> VER pg-stat-activity-backend-memory-allocated
1250.1 -> VER master
1.58324% difference
--
Calculate average runtime percentage difference between VER pg-stat-activity-backend-memory-allocated and VER master
1298.92 -> VER pg-stat-activity-backend-memory-allocated
1265.04 -> VER master
2.64279% difference
--
Calculate average runtime percentage difference between VER pg-stat-activity-backend-memory-allocated and VER master
1280.99 -> VER pg-stat-activity-backend-memory-allocated
1263.51 -> VER master
1.37394% difference
--
Calculate average runtime percentage difference between VER pg-stat-activity-backend-memory-allocated and VER master
1273.23 -> VER pg-stat-activity-backend-memory-allocated
1275.53 -> VER master
-0.18048% difference
--
Calculate average runtime percentage difference between VER pg-stat-activity-backend-memory-allocated and VER master
1261.2 -> VER pg-stat-activity-backend-memory-allocated
1263.04 -> VER master
-0.145786% difference
--
Calculate average runtime percentage difference between VER pg-stat-activity-backend-memory-allocated and VER master
1289.73 -> VER pg-stat-activity-backend-memory-allocated
1289.02 -> VER master
0.0550654% difference
--
Calculate average runtime percentage difference between VER pg-stat-activity-backend-memory-allocated and VER master
1287.57 -> VER pg-stat-activity-backend-memory-allocated
1279.42 -> VER master
0.634985% difference
--
Calculate average runtime percentage difference between VER pg-stat-activity-backend-memory-allocated and VER master
1272.01 -> VER pg-stat-activity-backend-memory-allocated
1259.22 -> VER master
1.01058% difference
----------------------------------

I also did 12 runs master VS master
Shows, ~1% to 2% variation

Calculate average runtime percentage difference between VER master and VER master
1239.6 -> VER master
1263.73 -> VER master
-1.92783% difference
--
Calculate average runtime percentage difference between VER master and VER master
1253.82 -> VER master
1252.5 -> VER master
0.105334% difference
--
Calculate average runtime percentage difference between VER master and VER master
1256.05 -> VER master
1258.97 -> VER master
-0.232205% difference
--
Calculate average runtime percentage difference between VER master and VER master
1264.8 -> VER master
1248.94 -> VER master
1.26186% difference
--
Calculate average runtime percentage difference between VER master and VER master
1265.08 -> VER master
1275.43 -> VER master
-0.814797% difference
--
Calculate average runtime percentage difference between VER master and VER master
1260.95 -> VER master
1288.81 -> VER master
-2.1853% difference
--
Calculate average runtime percentage difference between VER master and VER master
1260.46 -> VER master
1252.86 -> VER master
0.604778% difference
--
Calculate average runtime percentage difference between VER master and VER master
1253.49 -> VER master
1255.25 -> VER master
-0.140309% difference
--
Calculate average runtime percentage difference between VER master and VER master
1277.5 -> VER master
1267.42 -> VER master
0.792166% difference
--
Calculate average runtime percentage difference between VER master and VER master
1266.2 -> VER master
1283.12 -> VER master
-1.32741% difference
--
Calculate average runtime percentage difference between VER master and VER master
1245.78 -> VER master
1246.78 -> VER master
-0.0802388% difference
--
Calculate average runtime percentage difference between VER master and VER master
1255.15 -> VER master
1276.73 -> VER master
-1.70466% difference
Re: Add the ability to limit the amount of memory that can be allocated to backends.
On Mon, 2023-05-22 at 08:42 -0400, reid.thompson@crunchydata.com wrote:
> On Wed, 2023-05-17 at 23:07 -0400, reid.thompson@crunchydata.com wrote:
> > Thanks for the feedback.
> >
> > I'm plannning to look at this.
> >
> > Is your benchmark something that I could utilize? I.E. is it a set of
> > scripts or a standard test from somewhere that I can duplicate?
> >
> > Thanks,
> > Reid
> >

Attach patches updated to master.
Pulled from patch 2 back to patch 1 a change that was also pertinent to patch 1.
Attachment
Re: Add the ability to limit the amount of memory that can be allocated to backends.
On Mon, 2023-05-22 at 08:42 -0400, reid.thompson@crunchydata.com wrote:

More followup to the above.
>
> I experimented on my system regarding
> "The simple query select * from generate_series(0, 10000000) shows roughly 18.9 % degradation on my test server."
>
> My laptop:
> 32GB ram
> 11th Gen Intel(R) Core(TM) i7-11850H 8 cores/16 threads @ 2.50GHz (Max Turbo Frequency. 4.80 GHz ; Cache. 24 MB)
> SSD -> Model: KXG60ZNV1T02 NVMe KIOXIA 1024GB (nvme)

Hi

Ran through a few more tests on my system varying the
initial_allocation_allowance and allocation_allowance_refill_qty from the
current 1MB to 2, 4, 6, 8, 10 mb.  Also realized that in my last tests/email I
had posted percent difference rather than percent change. Turns out for the
numbers that were being compared they're essentially the same, but I'm
providing both for this set of tests.  Ten runs for each comparison. Compared
dev-max-memory set, dev-max-memory unset, master, and pg-stat-activity-backend-memory-allocated
against master at each allocation value;

Again, the test invokes
   psql -At -d postgres $connstr -P pager=off -c 'select * from generate_series(0, 10000000)'
100 times on each of the 2 instances and calculates the AVG time and SD
for the 100 runs.  It then uses the AVG from each instance to calculate
the percentage difference/change.

These tests contain one code change not yet pushed to pgsql-hackers. In
AllocSetReset() do not enter pgstat_report_allocated_bytes_decrease if no
memory has been freed.

Will format and post some pgbench test result in a separate email.

Percent difference:


───────┬───────────────────────────────────────────────────────────────────────────────────────────────────────────────────────────────────────────────
       │ Results: difference-dev-max-memory-set VS master

───────┼───────────────────────────────────────────────────────────────────────────────────────────────────────────────────────────────────────────────
   1   │ 1MB allocation        2MB allocation        4MB allocation          6MB allocation        8MB allocation
10MB allocation
   2   │ 4.2263%   difference  3.03961%  difference  0.0585808%  difference  2.92451%  difference  3.34694%  difference
2.67771%  difference
   3   │ 3.55709%  difference  3.92339%  difference  2.29144%    difference  3.2156%   difference  2.06153%  difference
2.86217%  difference
   4   │ 2.04389%  difference  2.91866%  difference  3.73463%    difference  2.86161%  difference  3.60992%  difference
3.07293%  difference
   5   │ 3.1306%   difference  3.64773%  difference  2.38063%    difference  1.84845%  difference  4.87375%  difference
4.16953%  difference
   6   │ 3.12556%  difference  3.34537%  difference  2.99052%    difference  2.60538%  difference  2.14825%  difference
1.95454%  difference
   7   │ 2.20615%  difference  2.12861%  difference  2.85282%    difference  2.43336%  difference  2.31389%  difference
3.21563%  difference
   8   │ 1.9954%   difference  3.61371%  difference  3.35543%    difference  3.49821%  difference  3.41526%  difference
8.25753%  difference
   9   │ 2.46845%  difference  2.57784%  difference  3.13067%    difference  3.67681%  difference  2.89139%  difference
3.6067%   difference
  10   │ 3.60092%  difference  2.16164%  difference  3.9976%     difference  2.6144%   difference  4.27892%  difference
2.68998%  difference
  11   │ 2.55454%  difference  2.39073%  difference  3.09631%    difference  3.24292%  difference  1.9107%   difference
1.76182%  difference
  12   │
  13   │ 28.9089/10            29.74729/10           27.888631/10            28.92125/10           30.85055/10
34.26854/10
  14   │ 2.89089               2.974729              2.7888631               2.892125              3.085055
3.426854

───────┴───────────────────────────────────────────────────────────────────────────────────────────────────────────────────────────────────────────────

───────┬───────────────────────────────────────────────────────────────────────────────────────────────────────────────────────────────────────────────
       │ Results: difference-dev-max-memory-unset VS master

───────┼───────────────────────────────────────────────────────────────────────────────────────────────────────────────────────────────────────────────
   1   │ 1MB allocation        2MB allocation        4MB allocation          6MB allocation        8MB allocation
10MB allocation
   2   │ 3.96616%  difference  3.05528%  difference  0.563267%   difference  1.12075%  difference  3.52398%  difference
3.25641%   difference
   3   │ 3.11387%  difference  3.12499%  difference  1.1133%     difference  4.86997%  difference  2.11481%  difference
1.11668%   difference
   4   │ 3.14506%  difference  2.06193%  difference  3.36034%    difference  2.80644%  difference  2.37822%  difference
3.07669%   difference
   5   │ 2.81052%  difference  3.18499%  difference  2.70705%    difference  2.27847%  difference  2.78506%  difference
3.02919%   difference
   6   │ 2.9765%   difference  3.44165%  difference  2.62039%    difference  4.61596%  difference  2.27937%  difference
3.89676%   difference
   7   │ 3.201%    difference  1.35838%  difference  2.40578%    difference  3.95695%  difference  2.25983%  difference
4.17585%   difference
   8   │ 5.35191%  difference  3.96434%  difference  4.32891%    difference  3.62715%  difference  2.17503%  difference
0.620856%  difference
   9   │ 3.44241%  difference  2.9754%   difference  3.03765%    difference  1.48104%  difference  1.53958%  difference
3.14598%   difference
  10   │ 10.1155%  difference  4.21062%  difference  1.64416%    difference  1.51458%  difference  2.92131%  difference
2.95603%   difference
  11   │ 3.11011%  difference  4.31318%  difference  2.01991%    difference  4.71192%  difference  2.37039%  difference
4.25241%   difference
  12   │
  13   │ 41.23304/10           31.69076/10           23.800757/10            30.98323/10           24.34758/10
29.526856/10
  14   │ 4.123304              3.169076              2.3800757               3.098323              2.434758
2.9526856

───────┴───────────────────────────────────────────────────────────────────────────────────────────────────────────────────────────────────────────────

───────┬───────────────────────────────────────────────────────────────────────────────────────────────────────────────────────────────────────────────
       │ Results: difference-master VS master

───────┼───────────────────────────────────────────────────────────────────────────────────────────────────────────────────────────────────────────────
   1   │ 1MB allocation          2MB allocation          4MB allocation           6MB allocation         8MB allocation
        10MB allocation
   2   │ 0.0734782%  difference  0.0955457%  difference  0.0521627%   difference  2.32643%   difference  0.286493%
difference 1.26977%    difference
   3   │ 0.547862%   difference  1.19087%    difference  0.276915%    difference  0.334332%  difference  0.260545%
difference 0.108956%   difference
   4   │ 0.0714666%  difference  0.931605%   difference  0.753996%    difference  0.457174%  difference  0.215904%
difference 1.43979%    difference
   5   │ 0.269737%   difference  0.848613%   difference  0.222909%    difference  0.315927%  difference  0.290408%
difference 0.248591%   difference
   6   │ 1.04231%    difference  0.367444%   difference  0.699571%    difference  0.29266%   difference  0.844548%
difference 0.273776%   difference
   7   │ 0.0584984%  difference  0.15094%    difference  0.0721539%   difference  0.594991%  difference  1.80223%
difference 0.500557%   difference
   8   │ 0.355129%   difference  1.19517%    difference  0.201835%    difference  1.2351%    difference  0.266004%
difference 0.80893%    difference
   9   │ 0.0811794%  difference  1.16184%    difference  1.01913%     difference  0.149087%  difference  0.402931%
difference 0.125788%   difference
  10   │ 0.950973%   difference  0.154471%   difference  0.42623%     difference  0.874816%  difference  0.157934%
difference 0.225433%   difference
  11   │ 0.501783%   difference  0.308357%   difference  0.279147%    difference  0.122458%  difference  0.538141%
difference 0.865846%   difference
  12   │
  13   │ 3.952417/10             6.404856/10             4.00405/10               6.702975/10            5.065138/10
        5.867437/10
  14   │ 0.3952417               0.6404856               0.400405                 0.6702975              0.5065138
        0.5867437

───────┴───────────────────────────────────────────────────────────────────────────────────────────────────────────────────────────────────────────────

───────┬───────────────────────────────────────────────────────────────────────────────────────────────────────────────────────────────────────────────
       │ Results: difference-pg-stat-activity-backend-memory-allocated VS master

───────┼───────────────────────────────────────────────────────────────────────────────────────────────────────────────────────────────────────────────
   1   │ 1MB allocation          2MB allocation          4MB allocation          6MB allocation         8MB allocation
       10MB allocation
   2   │ 2.04788%    difference  0.50705%    difference  0.504772%   difference  0.136316%  difference  0.590087%
difference 1.33931%    difference
   3   │ 1.21173%    difference  0.3309%     difference  0.482685%   difference  1.67956%   difference  0.175478%
difference 0.969286%   difference
   4   │ 0.0680972%  difference  0.295211%   difference  0.867547%   difference  1.12959%   difference  0.193756%
difference 0.714178%   difference
   5   │ 0.91525%    difference  1.42408%    difference  1.49059%    difference  0.641652%  difference  1.34265%
difference 0.378394%   difference
   6   │ 2.46448%    difference  2.67081%    difference  0.63824%    difference  0.650301%  difference  0.481858%
difference 1.65711%    difference
   7   │ 1.31021%    difference  0.0548831%  difference  1.23217%    difference  2.11691%   difference  0.31629%
difference 3.85858%    difference
   8   │ 1.61458%    difference  0.46042%    difference  0.724742%   difference  0.172952%  difference  1.33157%
difference 0.556898%   difference
   9   │ 1.65063%    difference  0.59815%    difference  1.42473%    difference  0.725576%  difference  0.229639%
difference 0.875489%   difference
  10   │ 1.78567%    difference  1.45652%    difference  0.6317%     difference  1.99146%   difference  0.999521%
difference 1.85291%    difference
  11   │ 0.391318%   difference  1.13216%    difference  0.138291%   difference  0.531084%  difference  0.680197%
difference 1.63162%    difference
  12   │
  13   │ 13.459845/10            8.930184/10             8.135467/10             9.775401/10            6.341046/10
       13.83377/10
  14   │ 1.3459845               0.8930184               0.8135467               0.9775401              0.6341046
       1.3833775

───────┴───────────────────────────────────────────────────────────────────────────────────────────────────────────────────────────────────────────────


Percent change:


───────┬───────────────────────────────────────────────────────────────────────────────────────────────────────────────────────────────────────────────
       │ Results: change-dev-max-memory-set VS master

───────┼───────────────────────────────────────────────────────────────────────────────────────────────────────────────────────────────────────────────
   1   │ 1MB allocation        2MB allocation        4MB allocation          6MB allocation        8MB allocation
10MB allocation
   2   │ 4.13884%  change      2.99411%  change      0.0585636%  change      2.88237%  change      3.29185%  change
2.64233%  change
   3   │ 3.49493%  change      3.84791%  change      2.26549%    change      3.16472%  change      2.0405%   change
2.82179%  change
   4   │ 2.02322%  change      2.87668%  change      3.66617%    change      2.82124%  change      3.54592%  change
3.02643%  change
   5   │ 3.08235%  change      3.5824%   change      2.35263%    change      1.83153%  change      4.75781%  change
4.08438%  change
   6   │ 3.07746%  change      3.29033%  change      2.94646%    change      2.57188%  change      2.12542%  change
1.93562%  change
   7   │ 2.18208%  change      2.10619%  change      2.8127%     change      2.40411%  change      2.28743%  change
3.16474%  change
   8   │ 1.97569%  change      3.54957%  change      3.30007%    change      3.43808%  change      3.35792%  change
7.93011%  change
   9   │ 2.43836%  change      2.54504%  change      3.08242%    change      3.61044%  change      2.85019%  change
3.54281%  change
  10   │ 3.53724%  change      2.13852%  change      3.91926%    change      2.58067%  change      4.18929%  change
2.65428%  change
  11   │ 2.52233%  change      2.36249%  change      3.0491%     change      3.19118%  change      1.89262%  change
1.74644%  change
  12   │
  13   │ 28.4725/10            29.29324/10           27.452864/10            28.49622/10           30.33895/10
33.54893/10
  14   │ 2.84725               2.929324              2.7452864               2.849622              3.033895
3.354893

───────┴───────────────────────────────────────────────────────────────────────────────────────────────────────────────────────────────────────────────

───────┬───────────────────────────────────────────────────────────────────────────────────────────────────────────────────────────────────────────────
       │ Results: change-dev-max-memory-unset VS master

───────┼───────────────────────────────────────────────────────────────────────────────────────────────────────────────────────────────────────────────
   1   │ 1MB allocation        2MB allocation        4MB allocation          6MB allocation        8MB allocation
10MB allocation
   2   │ 3.88903%  change      3.00931%  change      0.564858%   change      1.11451%  change      3.46296%  change
3.20424%   change
   3   │ 3.06613%  change      3.07691%  change      1.10714%    change      4.75421%  change      2.09268%  change
1.11048%   change
   4   │ 3.09637%  change      2.04089%  change      3.30482%    change      2.7676%   change      2.35028%  change
3.03008%   change
   5   │ 2.77157%  change      3.13506%  change      2.6709%     change      2.2528%   change      2.74681%  change
2.984%     change
   6   │ 2.93285%  change      3.38343%  change      2.5865%     change      4.51183%  change      2.25368%  change
3.82229%   change
   7   │ 3.15057%  change      1.34921%  change      2.37719%    change      3.88018%  change      2.23458%  change
4.09044%   change
   8   │ 5.21243%  change      3.88728%  change      4.23719%    change      3.56254%  change      2.15163%  change
0.62279%   change
   9   │ 3.38416%  change      2.93178%  change      2.99221%    change      1.47015%  change      1.52782%  change
3.09726%   change
  10   │ 10.6543%  change      4.1238%   change      1.63075%    change      1.5032%   change      2.87926%  change
2.91298%   change
  11   │ 3.06248%  change      4.22213%  change      1.99972%    change      4.60347%  change      2.34263%  change
4.16388%   change
  12   │
  13   │ 41.21989/10           31.1598/10            23.471278/10            30.42049/10           24.04233/10
29.03844/10
  14   │ 4.121989              3.11598               2.3471278               3.042049              2.404233
2.903844

───────┴───────────────────────────────────────────────────────────────────────────────────────────────────────────────────────────────────────────────

───────┬───────────────────────────────────────────────────────────────────────────────────────────────────────────────────────────────────────────────
       │ Results: change-master VS master

───────┼───────────────────────────────────────────────────────────────────────────────────────────────────────────────────────────────────────────────
   1   │ 1MB allocation          2MB allocation          4MB allocation           6MB allocation         8MB allocation
        10MB allocation
   2   │ 0.0734512%  change      0.0955%     change      0.0521763%   change      2.35381%   change      0.286904%
change     1.27789%    change
   3   │ 0.549367%   change      1.18382%    change      0.276532%    change      0.333774%  change      0.260206%
change     0.108897%   change
   4   │ 0.0714411%  change      0.927286%   change      0.751164%    change      0.456132%  change      0.216137%
change     1.4295%     change
   5   │ 0.269374%   change      0.845028%   change      0.222661%    change      0.315429%  change      0.29083%
change     0.2489%     change
   6   │ 1.0369%     change      0.368121%   change      0.702026%    change      0.292232%  change      0.840997%
change     0.273402%   change
   7   │ 0.0584813%  change      0.151054%   change      0.07218%     change      0.596766%  change      1.78613%
change     0.499307%   change
   8   │ 0.355761%   change      1.18807%    change      0.201631%    change      1.22752%   change      0.265651%
change     0.805671%   change
   9   │ 0.0812124%  change      1.16863%    change      1.02435%     change      0.149198%  change      0.402121%
change     0.125709%   change
  10   │ 0.955516%   change      0.154351%   change      0.425324%    change      0.871006%  change      0.158059%
change     0.225179%   change
  11   │ 0.500527%   change      0.307882%   change      0.278758%    change      0.122533%  change      0.539593%
change     0.862113%   change
  12   │
  13   │ 3.952031/10             6.389742/10             4.006802/10              6.7184/10              5.046628/10
        5.856568/10
  14   │ 0.3952031               0.6389742               0.4006802                0.67184                0.5046628
        0.5856568

───────┴───────────────────────────────────────────────────────────────────────────────────────────────────────────────────────────────────────────────

───────┬───────────────────────────────────────────────────────────────────────────────────────────────────────────────────────────────────────────────
       │ Results: change-pg-stat-activity-backend-memory-allocated VS master

───────┼───────────────────────────────────────────────────────────────────────────────────────────────────────────────────────────────────────────────
   1   │ 1MB allocation          2MB allocation          4MB allocation          6MB allocation         8MB allocation
       10MB allocation
   2   │ 2.02713%    change      0.505768%   change      0.506049%   change      0.136223%  change      0.591833%
change     1.3304%     change
   3   │ 1.20444%    change      0.331448%   change      0.481523%   change      1.66557%   change      0.175325%
change     0.974006%   change
   4   │ 0.068074%   change      0.294776%   change      0.8638%     change      1.12325%   change      0.193568%
change     0.711637%   change
   5   │ 0.91108%    change      1.41401%    change      1.47956%    change      0.6396%    change      1.33369%
change     0.377679%   change
   6   │ 2.43448%    change      2.63562%    change      0.636209%   change      0.648194%  change      0.4807%
change     1.64349%    change
   7   │ 1.30168%    change      0.054868%   change      1.22463%    change      2.09474%   change      0.316791%
change     3.93449%    change
   8   │ 1.60165%    change      0.461483%   change      0.722126%   change      0.173102%  change      1.32277%
change     0.555352%   change
   9   │ 1.63712%    change      0.599944%   change      1.41466%    change      0.722953%  change      0.229375%
change     0.871673%   change
  10   │ 1.76986%    change      1.44599%    change      0.629711%   change      1.97183%   change      0.99455%
change     1.8359%     change
  11   │ 0.392085%   change      1.12579%    change      0.138195%   change      0.532498%  change      0.677892%
change     1.61841%    change
  12   │
  13   │ 13.347599/10            8.869697/10             8.096463/10             9.70796/10             6.316494/10
       13.853037/10
  14   │ 1.3347599               0.8869697               0.8096463               0.970796               0.6316494
       1.385303

───────┴───────────────────────────────────────────────────────────────────────────────────────────────────────────────────────────────────────────────
Re: Add the ability to limit the amount of memory that can be allocated to backends.
On 22/5/2023 22:59, reid.thompson@crunchydata.com wrote:
> Attach patches updated to master.
> Pulled from patch 2 back to patch 1 a change that was also pertinent to patch 1.
+1 to the idea, have doubts on the implementation.

I have a question. I see the feature triggers ERROR on the exceeding of
the memory limit. The superior PG_CATCH() section will handle the error.
As I see, many such sections use memory allocations. What if some
routine, like the CopyErrorData(), exceeds the limit, too? In this case,
we could repeat the error until the top PG_CATCH(). Is this correct
behaviour? Maybe to check in the exceeds_max_total_bkend_mem() for
recursion and allow error handlers to slightly exceed this hard limit?

Also, the patch needs to be rebased.

--
regards,
Andrey Lepikhov
Postgres Professional
Re: Add the ability to limit the amount of memory that can be allocated to backends.
On 29/9/2023 09:52, Andrei Lepikhov wrote:
> On 22/5/2023 22:59, reid.thompson@crunchydata.com wrote:
>> Attach patches updated to master.
>> Pulled from patch 2 back to patch 1 a change that was also pertinent
>> to patch 1.
> +1 to the idea, have doubts on the implementation.
>
> I have a question. I see the feature triggers ERROR on the exceeding of
> the memory limit. The superior PG_CATCH() section will handle the error.
> As I see, many such sections use memory allocations. What if some
> routine, like the CopyErrorData(), exceeds the limit, too? In this case,
> we could repeat the error until the top PG_CATCH(). Is this correct
> behaviour? Maybe to check in the exceeds_max_total_bkend_mem() for
> recursion and allow error handlers to slightly exceed this hard limit?
By the patch in attachment I try to show which sort of problems I'm
worrying about. In some PП_CATCH() sections we do CopyErrorData
(allocate some memory) before aborting the transaction. So, the
allocation error can move us out of this section before aborting. We
await for soft ERROR message but will face more hard consequences.

--
regards,
Andrey Lepikhov
Postgres Professional
Attachment
Re: Add the ability to limit the amount of memory that can be allocated to backends.
Greetings,

* Andrei Lepikhov (a.lepikhov@postgrespro.ru) wrote:
> On 29/9/2023 09:52, Andrei Lepikhov wrote:
> > On 22/5/2023 22:59, reid.thompson@crunchydata.com wrote:
> > > Attach patches updated to master.
> > > Pulled from patch 2 back to patch 1 a change that was also pertinent
> > > to patch 1.
> > +1 to the idea, have doubts on the implementation.
> >
> > I have a question. I see the feature triggers ERROR on the exceeding of
> > the memory limit. The superior PG_CATCH() section will handle the error.
> > As I see, many such sections use memory allocations. What if some
> > routine, like the CopyErrorData(), exceeds the limit, too? In this case,
> > we could repeat the error until the top PG_CATCH(). Is this correct
> > behaviour? Maybe to check in the exceeds_max_total_bkend_mem() for
> > recursion and allow error handlers to slightly exceed this hard limit?

> By the patch in attachment I try to show which sort of problems I'm worrying
> about. In some PП_CATCH() sections we do CopyErrorData (allocate some
> memory) before aborting the transaction. So, the allocation error can move
> us out of this section before aborting. We await for soft ERROR message but
> will face more hard consequences.

While it's an interesting idea to consider making exceptions to the
limit, and perhaps we'll do that (or have some kind of 'reserve' for
such cases), this isn't really any different than today, is it?  We
might have a malloc() failure in the main path, end up in PG_CATCH() and
then try to do a CopyErrorData() and have another malloc() failure.

If we can rearrange the code to make this less likely to happen, by
doing a bit more work to free() resources used in the main path before
trying to do new allocations, then, sure, let's go ahead and do that,
but that's independent from this effort.

Thanks!

Stephen
Attachment
Re: Add the ability to limit the amount of memory that can be allocated to backends.
On 19/10/2023 02:00, Stephen Frost wrote:
> Greetings,
>
> * Andrei Lepikhov (a.lepikhov@postgrespro.ru) wrote:
>> On 29/9/2023 09:52, Andrei Lepikhov wrote:
>>> On 22/5/2023 22:59, reid.thompson@crunchydata.com wrote:
>>>> Attach patches updated to master.
>>>> Pulled from patch 2 back to patch 1 a change that was also pertinent
>>>> to patch 1.
>>> +1 to the idea, have doubts on the implementation.
>>>
>>> I have a question. I see the feature triggers ERROR on the exceeding of
>>> the memory limit. The superior PG_CATCH() section will handle the error.
>>> As I see, many such sections use memory allocations. What if some
>>> routine, like the CopyErrorData(), exceeds the limit, too? In this case,
>>> we could repeat the error until the top PG_CATCH(). Is this correct
>>> behaviour? Maybe to check in the exceeds_max_total_bkend_mem() for
>>> recursion and allow error handlers to slightly exceed this hard limit?
>
>> By the patch in attachment I try to show which sort of problems I'm worrying
>> about. In some PП_CATCH() sections we do CopyErrorData (allocate some
>> memory) before aborting the transaction. So, the allocation error can move
>> us out of this section before aborting. We await for soft ERROR message but
>> will face more hard consequences.
>
> While it's an interesting idea to consider making exceptions to the
> limit, and perhaps we'll do that (or have some kind of 'reserve' for
> such cases), this isn't really any different than today, is it?  We
> might have a malloc() failure in the main path, end up in PG_CATCH() and
> then try to do a CopyErrorData() and have another malloc() failure.
>
> If we can rearrange the code to make this less likely to happen, by
> doing a bit more work to free() resources used in the main path before
> trying to do new allocations, then, sure, let's go ahead and do that,
> but that's independent from this effort.

I agree that rearranging efforts can be made independently. The code in
the letter above was shown just as a demo of the case I'm worried about.
IMO, the thing that should be implemented here is a recursion level for
the memory limit. If processing the error, we fall into recursion with
this limit - we should ignore it.
I imagine custom extensions that use PG_CATCH() and allocate some data
there. At least we can raise the level of error to FATAL.

--
regards,
Andrey Lepikhov
Postgres Professional
Re: Add the ability to limit the amount of memory that can be allocated to backends.
Greetings,

* Andrei Lepikhov (a.lepikhov@postgrespro.ru) wrote:
> On 19/10/2023 02:00, Stephen Frost wrote:
> > * Andrei Lepikhov (a.lepikhov@postgrespro.ru) wrote:
> > > On 29/9/2023 09:52, Andrei Lepikhov wrote:
> > > > On 22/5/2023 22:59, reid.thompson@crunchydata.com wrote:
> > > > > Attach patches updated to master.
> > > > > Pulled from patch 2 back to patch 1 a change that was also pertinent
> > > > > to patch 1.
> > > > +1 to the idea, have doubts on the implementation.
> > > >
> > > > I have a question. I see the feature triggers ERROR on the exceeding of
> > > > the memory limit. The superior PG_CATCH() section will handle the error.
> > > > As I see, many such sections use memory allocations. What if some
> > > > routine, like the CopyErrorData(), exceeds the limit, too? In this case,
> > > > we could repeat the error until the top PG_CATCH(). Is this correct
> > > > behaviour? Maybe to check in the exceeds_max_total_bkend_mem() for
> > > > recursion and allow error handlers to slightly exceed this hard limit?
> >
> > > By the patch in attachment I try to show which sort of problems I'm worrying
> > > about. In some PП_CATCH() sections we do CopyErrorData (allocate some
> > > memory) before aborting the transaction. So, the allocation error can move
> > > us out of this section before aborting. We await for soft ERROR message but
> > > will face more hard consequences.
> >
> > While it's an interesting idea to consider making exceptions to the
> > limit, and perhaps we'll do that (or have some kind of 'reserve' for
> > such cases), this isn't really any different than today, is it?  We
> > might have a malloc() failure in the main path, end up in PG_CATCH() and
> > then try to do a CopyErrorData() and have another malloc() failure.
> >
> > If we can rearrange the code to make this less likely to happen, by
> > doing a bit more work to free() resources used in the main path before
> > trying to do new allocations, then, sure, let's go ahead and do that,
> > but that's independent from this effort.
>
> I agree that rearranging efforts can be made independently. The code in the
> letter above was shown just as a demo of the case I'm worried about.
> IMO, the thing that should be implemented here is a recursion level for the
> memory limit. If processing the error, we fall into recursion with this
> limit - we should ignore it.
> I imagine custom extensions that use PG_CATCH() and allocate some data
> there. At least we can raise the level of error to FATAL.

Ignoring such would defeat much of the point of this effort- which is to
get to a position where we can say with some confidence that we're not
going to go over some limit that the user has set and therefore not
allow ourselves to end up getting OOM killed.  These are all the same
issues that already exist today on systems which don't allow overcommit
too, there isn't anything new here in regards to these risks, so I'm not
really keen to complicate this to deal with issues that are already
there.

Perhaps once we've got the basics in place then we could consider
reserving some space for handling such cases..  but I don't think it'll
actually be very clean and what if we have an allocation that goes
beyond what that reserved space is anyway?  Then we're in the same spot
again where we have the choice of either failing the allocation in a
less elegant way than we might like to handle that error, or risk
getting outright kill'd by the kernel.  Of those choices, sure seems
like failing the allocation is the better way to go.

Thanks,

Stephen
Attachment
Re: Add the ability to limit the amount of memory that can be allocated to backends.
Hi,

On 2023-10-19 18:06:10 -0400, Stephen Frost wrote:
> Ignoring such would defeat much of the point of this effort- which is to
> get to a position where we can say with some confidence that we're not
> going to go over some limit that the user has set and therefore not
> allow ourselves to end up getting OOM killed.

I think that is a good medium to long term goal. I do however think that we'd
be better off merging the visibility of memory allocations soon-ish and
implement the limiting later. There's a lot of hairy details to get right for
the latter, and even just having visibility will be a huge improvement.

I think even patch 1 is doing too much at once. I doubt the DSM stuff is
quite right.

I'm unconvinced it's a good idea to split the different types of memory
contexts out. That just exposes too much implementation detail stuff without a
good reason.

I think the overhead even just the tracking implies right now is likely too
high and needs to be optimized. It should be a single math operation, not
tracking things in multiple fields. I don't think pg_sub_u64_overflow() should
be in the path either, that suddenly adds conditional branches.  You really
ought to look at the difference in assembly for the hot functions.

Greetings,

Andres Freund
Re: Add the ability to limit the amount of memory that can be allocated to backends.
Greetings,

* Andres Freund (andres@anarazel.de) wrote:
> On 2023-10-19 18:06:10 -0400, Stephen Frost wrote:
> > Ignoring such would defeat much of the point of this effort- which is to
> > get to a position where we can say with some confidence that we're not
> > going to go over some limit that the user has set and therefore not
> > allow ourselves to end up getting OOM killed.
>
> I think that is a good medium to long term goal. I do however think that we'd
> be better off merging the visibility of memory allocations soon-ish and
> implement the limiting later. There's a lot of hairy details to get right for
> the latter, and even just having visibility will be a huge improvement.

I agree that having the visibility will be a great improvement and
perhaps could go in separately, but I don't know that I agree that the
limits are going to be that much of an issue.  In any case, there's been
work ongoing on this and that'll be posted soon.  I was just trying to
address the general comment raised in this sub-thread here.

> I think even patch 1 is doing too much at once. I doubt the DSM stuff is
> quite right.

Getting DSM right has certainly been tricky, along with other things,
but we've been working towards, and continue to work towards, getting
everything to line up nicely between memory context allocations of
various types and the amounts which are being seen as malloc'd/free'd.
There's been parts of this also reworked to allow us to see per-backend
reservations as well as total reserved and to get those numbers able to
be matched up inside of a given transaction using the statistics system.

> I'm unconvinced it's a good idea to split the different types of memory
> contexts out. That just exposes too much implementation detail stuff without a
> good reason.

DSM needs to be independent anyway ... as for the others, perhaps we
could combine them, though that's pretty easily done later and for now
it's been useful to see them split out as we've been working on the
patch.

> I think the overhead even just the tracking implies right now is likely too
> high and needs to be optimized. It should be a single math operation, not
> tracking things in multiple fields. I don't think pg_sub_u64_overflow() should
> be in the path either, that suddenly adds conditional branches.  You really
> ought to look at the difference in assembly for the hot functions.

This has been improved in the most recent work and we'll have that
posted soon, probably best to hold off from larger review of this right
now- as mentioned, I was just trying to address the specific question in
this sub-thread since a new patch is coming soon.

Thanks,

Stephen
Attachment
Re: Add the ability to limit the amount of memory that can be allocated to backends.
On 20/10/2023 05:06, Stephen Frost wrote:
> Greetings,
>
> * Andrei Lepikhov (a.lepikhov@postgrespro.ru) wrote:
>> On 19/10/2023 02:00, Stephen Frost wrote:
>>> * Andrei Lepikhov (a.lepikhov@postgrespro.ru) wrote:
>>>> On 29/9/2023 09:52, Andrei Lepikhov wrote:
>>>>> On 22/5/2023 22:59, reid.thompson@crunchydata.com wrote:
>>>>>> Attach patches updated to master.
>>>>>> Pulled from patch 2 back to patch 1 a change that was also pertinent
>>>>>> to patch 1.
>>>>> +1 to the idea, have doubts on the implementation.
>>>>>
>>>>> I have a question. I see the feature triggers ERROR on the exceeding of
>>>>> the memory limit. The superior PG_CATCH() section will handle the error.
>>>>> As I see, many such sections use memory allocations. What if some
>>>>> routine, like the CopyErrorData(), exceeds the limit, too? In this case,
>>>>> we could repeat the error until the top PG_CATCH(). Is this correct
>>>>> behaviour? Maybe to check in the exceeds_max_total_bkend_mem() for
>>>>> recursion and allow error handlers to slightly exceed this hard limit?
>>>
>>>> By the patch in attachment I try to show which sort of problems I'm worrying
>>>> about. In some PП_CATCH() sections we do CopyErrorData (allocate some
>>>> memory) before aborting the transaction. So, the allocation error can move
>>>> us out of this section before aborting. We await for soft ERROR message but
>>>> will face more hard consequences.
>>>
>>> While it's an interesting idea to consider making exceptions to the
>>> limit, and perhaps we'll do that (or have some kind of 'reserve' for
>>> such cases), this isn't really any different than today, is it?  We
>>> might have a malloc() failure in the main path, end up in PG_CATCH() and
>>> then try to do a CopyErrorData() and have another malloc() failure.
>>>
>>> If we can rearrange the code to make this less likely to happen, by
>>> doing a bit more work to free() resources used in the main path before
>>> trying to do new allocations, then, sure, let's go ahead and do that,
>>> but that's independent from this effort.
>>
>> I agree that rearranging efforts can be made independently. The code in the
>> letter above was shown just as a demo of the case I'm worried about.
>> IMO, the thing that should be implemented here is a recursion level for the
>> memory limit. If processing the error, we fall into recursion with this
>> limit - we should ignore it.
>> I imagine custom extensions that use PG_CATCH() and allocate some data
>> there. At least we can raise the level of error to FATAL.
>
> Ignoring such would defeat much of the point of this effort- which is to
> get to a position where we can say with some confidence that we're not
> going to go over some limit that the user has set and therefore not
> allow ourselves to end up getting OOM killed.  These are all the same
> issues that already exist today on systems which don't allow overcommit
> too, there isn't anything new here in regards to these risks, so I'm not
> really keen to complicate this to deal with issues that are already
> there.
>
> Perhaps once we've got the basics in place then we could consider
> reserving some space for handling such cases..  but I don't think it'll
> actually be very clean and what if we have an allocation that goes
> beyond what that reserved space is anyway?  Then we're in the same spot
> again where we have the choice of either failing the allocation in a
> less elegant way than we might like to handle that error, or risk
> getting outright kill'd by the kernel.  Of those choices, sure seems
> like failing the allocation is the better way to go.

I've got your point.
The only issue I worry about is the uncertainty and clutter that can be
created by this feature. In the worst case, when we have a complex error
stack (including the extension's CATCH sections, exceptions in stored
procedures, etc.), the backend will throw the memory limit error
repeatedly. Of course, one failed backend looks better than a
surprisingly killed postmaster, but the mix of different error reports
and details looks terrible and challenging to debug in the case of
trouble. So, may we throw a FATAL error if we reach this limit while
handling an exception?

--
regards,
Andrey Lepikhov
Postgres Professional
Re: Add the ability to limit the amount of memory that can be allocated to backends.
Greetings,

* Andrei Lepikhov (a.lepikhov@postgrespro.ru) wrote:
> The only issue I worry about is the uncertainty and clutter that can be
> created by this feature. In the worst case, when we have a complex error
> stack (including the extension's CATCH sections, exceptions in stored
> procedures, etc.), the backend will throw the memory limit error repeatedly.

I'm not seeing what additional uncertainty or clutter there is- this is,
again, exactly the same as what happens today on a system with
overcommit disabled and I don't feel like we get a lot of complaints
about this today.

> Of course, one failed backend looks better than a surprisingly killed
> postmaster, but the mix of different error reports and details looks
> terrible and challenging to debug in the case of trouble. So, may we throw a
> FATAL error if we reach this limit while handling an exception?

I don't see why we'd do that when we can do better- we just fail
whatever the ongoing query or transaction is and allow further requests
on the same connection.  We already support exactly that and it works
really rather well and I don't see why we'd throw that away because
there's a different way to get an OOM error.

If you want to make the argument that we should throw FATAL on OOM when
handling an exception, that's something you could argue independently of
this effort already today, but I don't think you'll get agreement that
it's an improvement.

Thanks,

Stephen
Attachment
Re: Add the ability to limit the amount of memory that can be allocated to backends.
On 20/10/2023 19:39, Stephen Frost wrote:
Greetings,
> * Andrei Lepikhov (a.lepikhov@postgrespro.ru) wrote:
>> The only issue I worry about is the uncertainty and clutter that can be
>> created by this feature. In the worst case, when we have a complex error
>> stack (including the extension's CATCH sections, exceptions in stored
>> procedures, etc.), the backend will throw the memory limit error repeatedly.
>
> I'm not seeing what additional uncertainty or clutter there is- this is,
> again, exactly the same as what happens today on a system with
> overcommit disabled and I don't feel like we get a lot of complaints
> about this today.

Maybe I missed something or see this feature from an alternate point of
view (as an extension developer), but overcommit is more useful so far:
it kills a process.
It means that after restart, the backend/background worker will have an
initial internal state. With this limit enabled, we need to remember
that each function call can cause an error, and we have to remember it
using static PG_CATCH sections where we must rearrange local variables
to the initial (?) state. So, it complicates development.
Of course, this limit is a good feature, but from my point of view, it
would be better to kill a memory-consuming backend instead of throwing
an error. At least for now, we don't have a technique to repeat query
planning with chances to build a more effective plan.

--
regards,
Andrei Lepikhov
Postgres Professional
Re: Add the ability to limit the amount of memory that can be allocated to backends.
Hi,

On 2023-10-24 09:39:42 +0700, Andrei Lepikhov wrote:
> On 20/10/2023 19:39, Stephen Frost wrote:
> Greetings,
> > * Andrei Lepikhov (a.lepikhov@postgrespro.ru) wrote:
> > > The only issue I worry about is the uncertainty and clutter that can be
> > > created by this feature. In the worst case, when we have a complex error
> > > stack (including the extension's CATCH sections, exceptions in stored
> > > procedures, etc.), the backend will throw the memory limit error repeatedly.
> >
> > I'm not seeing what additional uncertainty or clutter there is- this is,
> > again, exactly the same as what happens today on a system with
> > overcommit disabled and I don't feel like we get a lot of complaints
> > about this today.
>
> Maybe I missed something or see this feature from an alternate point of view
> (as an extension developer), but overcommit is more useful so far: it kills
> a process.

In case of postgres it doesn't just kill one postgres, it leads to *all*
connections being terminated.


> It means that after restart, the backend/background worker will have an
> initial internal state. With this limit enabled, we need to remember that
> each function call can cause an error, and we have to remember it using
> static PG_CATCH sections where we must rearrange local variables to the
> initial (?) state. So, it complicates development.

You need to be aware of errors being thrown regardless this feature, as
out-of-memory errors can be encountered today already. There also are many
other kinds of errors that can be thrown.

Greetings,

Andres Freund
Re: Add the ability to limit the amount of memory that can be allocated to backends.
Here is an updated patch for tracking Postgres memory usage.
In this new patch, Postgres “reserves” memory, first by updating process-private counters, and then eventually by updating global counters. If the new GUC variable “max_total_memory” is set, reservations exceeding the limit are turned down and treated as though the kernel had reported an out of memory error.
Postgres memory reservations come from multiple sources.
- Malloc calls made by the Postgres memory allocators.
- Static shared memory created by the postmaster at server startup,
- Dynamic shared memory created by the backends.
- A fixed amount (1Mb) of “initial” memory reserved whenever a process starts up.
Each process also maintains an accurate count of its actual memory allocations. The process-private variable “my_memory” holds the total allocations for that process. Since there can be no contention, each process updates its own counters very efficiently.
Pgstat now includes global memory counters. These shared memory counters represent the sum of all reservations made by all Postgres processes. For efficiency, these global counters are only updated when new reservations exceed a threshold, currently 1 Mb for each process. Consequently, the global reservation counters are approximate totals which may differ from the actual allocation totals by up to 1 Mb per process.
The max_total_memory limit is checked whenever the global counters are updated. There is no special error handling if a memory allocation exceeds the global limit. That allocation returns a NULL for malloc style allocations or an ENOMEM for shared memory allocations. Postgres has existing mechanisms for dealing with out of memory conditions.
For sanity checking, pgstat now includes the pg_backend_memory_allocation view showing memory allocations made by the backend process. This view includes a scan of the top memory context, so it compares memory allocations reported through pgstat with actual allocations. The two should match.
Two other views were created as well. pg_stat_global_memory_tracking shows how much server memory has been reserved overall and how much memory remains to be reserved. pg_stat_memory_reservation iterates through the memory reserved by each server process. Both of these views use pgstat’s “snapshot” mechanism to ensure consistent values within a transaction.
Performance-wise, there was no measurable impact with either pgbench or a simple “SELECT * from series” query.
Attachment
Re: Add the ability to limit the amount of memory that can be allocated to backends.
Hi,

On 2023-10-31 17:11:26 +0000, John Morris wrote:
> Postgres memory reservations come from multiple sources.
>
>   *   Malloc calls made by the Postgres memory allocators.
>   *   Static shared memory created by the postmaster at server startup,
>   *   Dynamic shared memory created by the backends.
>   *   A fixed amount (1Mb) of “initial” memory reserved whenever a process starts up.
>
> Each process also maintains an accurate count of its actual memory
> allocations. The process-private variable “my_memory” holds the total
> allocations for that process. Since there can be no contention, each process
> updates its own counters very efficiently.

I think this will introduce measurable overhead in low concurrency cases and
very substantial overhead / contention when there is a decent amount of
concurrency.  This makes all memory allocations > 1MB contend on a single
atomic.  Massive amount of energy have been spent writing multi-threaded
allocators that have far less contention than this - the current state is to
never contend on shared resources on any reasonably common path. This gives
away one of the few major advantages our process model has away.

The patch doesn't just introduce contention when limiting is enabled - it
introduces it even when memory usage is just tracked. It makes absolutely no
sense to have a single contended atomic in that case - just have a per-backend
variable in shared memory that's updated. It's *WAY* cheaper to compute the
overall memory usage during querying than to keep a running total in shared
memory.


> Pgstat now includes global memory counters. These shared memory counters
> represent the sum of all reservations made by all Postgres processes. For
> efficiency, these global counters are only updated when new reservations
> exceed a threshold, currently 1 Mb for each process. Consequently, the
> global reservation counters are approximate totals which may differ from the
> actual allocation totals by up to 1 Mb per process.

I see that you added them to the "cumulative" stats system - that doesn't
immediately makes sense to me - what you're tracking here isn't an
accumulating counter, it's something showing the current state, right?


> The max_total_memory limit is checked whenever the global counters are
> updated. There is no special error handling if a memory allocation exceeds
> the global limit. That allocation returns a NULL for malloc style
> allocations or an ENOMEM for shared memory allocations. Postgres has
> existing mechanisms for dealing with out of memory conditions.

I still think it's extremely unwise to do tracking of memory and limiting of
memory in one patch.  You should work towards and acceptable patch that just
tracks memory usage in an as simple and low overhead way as possible. Then we
later can build on that.


> For sanity checking, pgstat now includes the pg_backend_memory_allocation
> view showing memory allocations made by the backend process. This view
> includes a scan of the top memory context, so it compares memory allocations
> reported through pgstat with actual allocations. The two should match.

Can't you just do this using the existing pg_backend_memory_contexts view?


> Performance-wise, there was no measurable impact with either pgbench or a
> simple “SELECT * from series” query.

That seems unsurprising - allocations aren't a major part of the work there,
you'd have to regress by a lot to see memory allocator changes to show a
significant performance decrease.


> diff --git a/src/test/regress/expected/opr_sanity.out b/src/test/regress/expected/opr_sanity.out
> index 7a6f36a6a9..6c813ec465 100644
> --- a/src/test/regress/expected/opr_sanity.out
> +++ b/src/test/regress/expected/opr_sanity.out
> @@ -468,9 +468,11 @@ WHERE proallargtypes IS NOT NULL AND
>    ARRAY(SELECT proallargtypes[i]
>          FROM generate_series(1, array_length(proallargtypes, 1)) g(i)
>          WHERE proargmodes IS NULL OR proargmodes[i] IN ('i', 'b', 'v'));
> - oid | proname | proargtypes | proallargtypes | proargmodes
> ------+---------+-------------+----------------+-------------
> -(0 rows)
> + oid  |             proname              | proargtypes |      proallargtypes       |    proargmodes
> +------+----------------------------------+-------------+---------------------------+-------------------
> + 9890 | pg_stat_get_memory_reservation   |             | {23,23,20,20,20,20,20,20} | {i,o,o,o,o,o,o,o}
> + 9891 | pg_get_backend_memory_allocation |             | {23,23,20,20,20,20,20}    | {i,o,o,o,o,o,o}
> +(2 rows)

This indicates that your pg_proc entries are broken, they need to fixed rather
than allowed here.

Greetings,

Andres Freund
Re: Add the ability to limit the amount of memory that can be allocated to backends.
Greetings,

* Andres Freund (andres@anarazel.de) wrote:
> On 2023-10-31 17:11:26 +0000, John Morris wrote:
> > Postgres memory reservations come from multiple sources.
> >
> >   *   Malloc calls made by the Postgres memory allocators.
> >   *   Static shared memory created by the postmaster at server startup,
> >   *   Dynamic shared memory created by the backends.
> >   *   A fixed amount (1Mb) of “initial” memory reserved whenever a process starts up.
> >
> > Each process also maintains an accurate count of its actual memory
> > allocations. The process-private variable “my_memory” holds the total
> > allocations for that process. Since there can be no contention, each process
> > updates its own counters very efficiently.
>
> I think this will introduce measurable overhead in low concurrency cases and
> very substantial overhead / contention when there is a decent amount of
> concurrency.  This makes all memory allocations > 1MB contend on a single
> atomic.  Massive amount of energy have been spent writing multi-threaded
> allocators that have far less contention than this - the current state is to
> never contend on shared resources on any reasonably common path. This gives
> away one of the few major advantages our process model has away.

We could certainly adjust the size of each reservation to reduce the
frequency of having to hit the atomic.  Specific suggestions about how
to benchmark and see the regression that's being worried about here
would be great.  Certainly my hope has generally been that when we do a
larger allocation, it's because we're about to go do a bunch of work,
meaning that hopefully the time spent updating the atomic is minor
overall.

> The patch doesn't just introduce contention when limiting is enabled - it
> introduces it even when memory usage is just tracked. It makes absolutely no
> sense to have a single contended atomic in that case - just have a per-backend
> variable in shared memory that's updated. It's *WAY* cheaper to compute the
> overall memory usage during querying than to keep a running total in shared
> memory.

Agreed that we should avoid the contention when limiting isn't being
used, certainly easy to do so, and had actually intended to but that
seems to have gotten lost along the way.  Will fix.

Other than that change inside update_global_reservation though, the code
for reporting per-backend memory usage and querying it does work as
you're outlining above inside the stats system.

That said- I just want to confirm that you would agree that querying the
amount of memory used by every backend, to add it all up to enforce an
overall limit, surely isn't something we're going to want to do during
an allocation and that having a global atomic for that is better, right?

> > Pgstat now includes global memory counters. These shared memory counters
> > represent the sum of all reservations made by all Postgres processes. For
> > efficiency, these global counters are only updated when new reservations
> > exceed a threshold, currently 1 Mb for each process. Consequently, the
> > global reservation counters are approximate totals which may differ from the
> > actual allocation totals by up to 1 Mb per process.
>
> I see that you added them to the "cumulative" stats system - that doesn't
> immediately makes sense to me - what you're tracking here isn't an
> accumulating counter, it's something showing the current state, right?

Yes, this is current state, not an accumulation.

> > The max_total_memory limit is checked whenever the global counters are
> > updated. There is no special error handling if a memory allocation exceeds
> > the global limit. That allocation returns a NULL for malloc style
> > allocations or an ENOMEM for shared memory allocations. Postgres has
> > existing mechanisms for dealing with out of memory conditions.
>
> I still think it's extremely unwise to do tracking of memory and limiting of
> memory in one patch.  You should work towards and acceptable patch that just
> tracks memory usage in an as simple and low overhead way as possible. Then we
> later can build on that.

Frankly, while tracking is interesting, the limiting is the feature
that's needed more urgently imv.  We could possibly split it up but
there's an awful lot of the same code that would need to be changed and
that seems less than ideal.  Still, we'll look into this.

> > For sanity checking, pgstat now includes the pg_backend_memory_allocation
> > view showing memory allocations made by the backend process. This view
> > includes a scan of the top memory context, so it compares memory allocations
> > reported through pgstat with actual allocations. The two should match.
>
> Can't you just do this using the existing pg_backend_memory_contexts view?

Not and get a number that you can compare to the local backend number
due to the query itself happening and performing allocations and
creating new contexts.  We wanted to be able to show that we are
accounting correctly and exactly matching to what the memory context
system is tracking.

> > - oid | proname | proargtypes | proallargtypes | proargmodes
> > ------+---------+-------------+----------------+-------------
> > -(0 rows)
> > + oid  |             proname              | proargtypes |      proallargtypes       |    proargmodes
> > +------+----------------------------------+-------------+---------------------------+-------------------
> > + 9890 | pg_stat_get_memory_reservation   |             | {23,23,20,20,20,20,20,20} | {i,o,o,o,o,o,o,o}
> > + 9891 | pg_get_backend_memory_allocation |             | {23,23,20,20,20,20,20}    | {i,o,o,o,o,o,o}
> > +(2 rows)
>
> This indicates that your pg_proc entries are broken, they need to fixed rather
> than allowed here.

Agreed, will fix.

Thanks!

Stephen
Attachment
Re: Add the ability to limit the amount of memory that can be allocated to backends.
Hi,

On 2023-11-06 13:02:50 -0500, Stephen Frost wrote:
> > > The max_total_memory limit is checked whenever the global counters are
> > > updated. There is no special error handling if a memory allocation exceeds
> > > the global limit. That allocation returns a NULL for malloc style
> > > allocations or an ENOMEM for shared memory allocations. Postgres has
> > > existing mechanisms for dealing with out of memory conditions.
> >
> > I still think it's extremely unwise to do tracking of memory and limiting of
> > memory in one patch.  You should work towards and acceptable patch that just
> > tracks memory usage in an as simple and low overhead way as possible. Then we
> > later can build on that.
>
> Frankly, while tracking is interesting, the limiting is the feature
> that's needed more urgently imv.

I agree that we need limiting, but that the tracking needs to be very robust
for that to be usable.


> We could possibly split it up but there's an awful lot of the same code that
> would need to be changed and that seems less than ideal.  Still, we'll look
> into this.

Shrug. IMO keeping them together just makes it very likely that neither goes
in.


> > > For sanity checking, pgstat now includes the pg_backend_memory_allocation
> > > view showing memory allocations made by the backend process. This view
> > > includes a scan of the top memory context, so it compares memory allocations
> > > reported through pgstat with actual allocations. The two should match.
> >
> > Can't you just do this using the existing pg_backend_memory_contexts view?
>
> Not and get a number that you can compare to the local backend number
> due to the query itself happening and performing allocations and
> creating new contexts.  We wanted to be able to show that we are
> accounting correctly and exactly matching to what the memory context
> system is tracking.

I think creating a separate view for this will be confusing for users, without
really much to show for. Excluding the current query would be useful for other
cases as well, why don't we provide a way to do that with
pg_backend_memory_contexts?

Greetings,

Andres Freund
Re: Add the ability to limit the amount of memory that can be allocated to backends.
Greetings,

* Andres Freund (andres@anarazel.de) wrote:
> On 2023-11-06 13:02:50 -0500, Stephen Frost wrote:
> > > > The max_total_memory limit is checked whenever the global counters are
> > > > updated. There is no special error handling if a memory allocation exceeds
> > > > the global limit. That allocation returns a NULL for malloc style
> > > > allocations or an ENOMEM for shared memory allocations. Postgres has
> > > > existing mechanisms for dealing with out of memory conditions.
> > >
> > > I still think it's extremely unwise to do tracking of memory and limiting of
> > > memory in one patch.  You should work towards and acceptable patch that just
> > > tracks memory usage in an as simple and low overhead way as possible. Then we
> > > later can build on that.
> >
> > Frankly, while tracking is interesting, the limiting is the feature
> > that's needed more urgently imv.
>
> I agree that we need limiting, but that the tracking needs to be very robust
> for that to be usable.

Is there an issue with the tracking in the patch that you saw?  That's
certainly an area that we've tried hard to get right and to match up to
numbers from the rest of the system, such as the memory context system.

> > We could possibly split it up but there's an awful lot of the same code that
> > would need to be changed and that seems less than ideal.  Still, we'll look
> > into this.
>
> Shrug. IMO keeping them together just makes it very likely that neither goes
> in.

I'm happy to hear your support for the limiting part of this- that's
encouraging.

> > > > For sanity checking, pgstat now includes the pg_backend_memory_allocation
> > > > view showing memory allocations made by the backend process. This view
> > > > includes a scan of the top memory context, so it compares memory allocations
> > > > reported through pgstat with actual allocations. The two should match.
> > >
> > > Can't you just do this using the existing pg_backend_memory_contexts view?
> >
> > Not and get a number that you can compare to the local backend number
> > due to the query itself happening and performing allocations and
> > creating new contexts.  We wanted to be able to show that we are
> > accounting correctly and exactly matching to what the memory context
> > system is tracking.
>
> I think creating a separate view for this will be confusing for users, without
> really much to show for. Excluding the current query would be useful for other
> cases as well, why don't we provide a way to do that with
> pg_backend_memory_contexts?

Both of these feel very much like power-user views, so I'm not terribly
concerned about users getting confused.  That said, we could possibly
drop this as a view and just have the functions which are then used in
the regression tests to catch things should the numbers start to
diverge.

Having a way to get the memory contexts which don't include the
currently running query might be interesting too but is rather
independent of what this patch is trying to do.  The only reason we
collected up the memory-context info is as a cross-check to the tracking
that we're doing and while the existing memory-context view is just fine
for a lot of other things, it doesn't work for that specific need.

Thanks,

Stephen
Attachment
Re: Add the ability to limit the amount of memory that can be allocated to backends.
Hi,

On 2023-11-07 15:55:48 -0500, Stephen Frost wrote:
> * Andres Freund (andres@anarazel.de) wrote:
> > On 2023-11-06 13:02:50 -0500, Stephen Frost wrote:
> > > > > The max_total_memory limit is checked whenever the global counters are
> > > > > updated. There is no special error handling if a memory allocation exceeds
> > > > > the global limit. That allocation returns a NULL for malloc style
> > > > > allocations or an ENOMEM for shared memory allocations. Postgres has
> > > > > existing mechanisms for dealing with out of memory conditions.
> > > >
> > > > I still think it's extremely unwise to do tracking of memory and limiting of
> > > > memory in one patch.  You should work towards and acceptable patch that just
> > > > tracks memory usage in an as simple and low overhead way as possible. Then we
> > > > later can build on that.
> > >
> > > Frankly, while tracking is interesting, the limiting is the feature
> > > that's needed more urgently imv.
> >
> > I agree that we need limiting, but that the tracking needs to be very robust
> > for that to be usable.
>
> Is there an issue with the tracking in the patch that you saw?  That's
> certainly an area that we've tried hard to get right and to match up to
> numbers from the rest of the system, such as the memory context system.

There's some details I am pretty sure aren't right - the DSM tracking piece
seems bogus to me. But beyond that: I don't know. There's enough other stuff
in the patch that it's hard to focus on that aspect. That's why I'd like to
merge a patch doing just that, so we actually can collect numbers. If any of
the developers of the patch had focused on polishing that part instead of
focusing on the limiting, it'd have been ready to be merged a while ago, maybe
even in 16.  I think the limiting piece is unlikely to be ready for 17.

Greetings,

Andres Freund
Re: Add the ability to limit the amount of memory that can be allocated to backends.
hi.

+static void checkAllocations();
should be "static void checkAllocations(void);" ?

PgStatShared_Memtrack there is a lock, but seems not initialized, and
not used. Can you expand on it?
So in view  pg_stat_global_memory_tracking, column
"total_memory_reserved" is a point of time, total memory the whole
server reserved/malloced? will it change every time you call it?
the function pg_stat_get_global_memory_tracking provolatile => 's'.
should be a VOLATILE function?


pg_stat_get_memory_reservation, pg_stat_get_global_memory_tracking
should be proretset => 'f'.
+{ oid => '9891',
+  descr => 'statistics: memory utilized by current backend',
+  proname => 'pg_get_backend_memory_allocation', prorows => '1',
proisstrict => 'f',
+  proretset => 't', provolatile => 's', proparallel => 'r',


you declared
+void pgstat_backend_memory_reservation_cb(void);
but seems there is no definition.


this part is unnecessary since you already declared
src/include/catalog/pg_proc.dat?
+/* SQL Callable functions */
+extern Datum pg_stat_get_memory_reservation(PG_FUNCTION_ARGS);
+extern Datum pg_get_backend_memory_allocation(PG_FUNCTION_ARGS);
+extern Datum pg_stat_get_global_memory_tracking(PG_FUNCTION_ARGS);

The last sentence is just a plain link, no explanation. something is missing?
     <para>
+      Reports how much memory remains available to the server. If a
+      backend process attempts to allocate more memory than remains,
+      the process will fail with an out of memory error, resulting in
+      cancellation of the process's active query/transaction.
+      If memory is not being limited (ie. max_total_memory is zero or not set),
+      this column returns NULL.
+      <xref linkend="guc-max-total-memory"/>.
+     </para></entry>
+     </row>
+
+      <row>
+       <entry role="catalog_table_entry"><para role="column_definition">
+        <structfield>static_shared_memory</structfield> <type>bigint</type>
+       </para>
+      <para>
+       Reports how much static shared memory (non-DSM shared memory)
is being used by
+       the server. Static shared memory is configured by the postmaster at
+       at server startup.
+       <xref linkend="guc-max-total-memory"/>.
+      </para></entry>
+      </row>
Re: Add the ability to limit the amount of memory that can be allocated to backends.
Hello!

Earlier in this thread, the pgbench results were published, where with a strong memory limit of 100MB
a significant, about 10%, decrease in TPS was observed [1].

Using dedicated server with 12GB RAM and methodology described in [3], i performed five series
of measurements for the patches from the [2].
The series were like this:
1) unpatched 16th version at the REL_16_BETA1 (e0b82fc8e83) as close to [2] in time.
2) patched REL_16_BETA1 at e0b82fc8e83 with undefined max_total_backend_memory GUC (with default value = 0).
3) patched REL_16_BETA1 with max_total_backend_memory = 16GB
4) the same with max_total_backend_memory = 8GB
5) and again with max_total_backend_memory = 200MB

Measurements with max_total_backend_memory = 100MB were not be carried out,
with limit 100MB the server gave an error on startup:
FATAL:  configured max_total_backend_memory 100MB is <= shared_memory_size 143MB
So i used 200MB to retain all other GUCs the same.

Pgbench gave the following results:
1) and 2) almost the same: ~6350 TPS. See orange and green
distributions on the attached graph.png respectively.
3) and 4) identical to each other (~6315 TPS) and a bit slower than 1) and 2) by ~0,6%.
See blue and yellow distributions respectively.
5) is slightly slower (~6285 TPS) than 3) and 4) by another 0,5%. (grey distribution)
The standard error in all series was ~0.2%. There is a raw data in the raw_data.txt.

With the best wishes,

--
Anton A. Melnikov
Postgres Professional: http://www.postgrespro.com
The Russian Postgres Company


[1] https://www.postgresql.org/message-id/3178e9a1b7acbcf023fafed68ca48d76afc07907.camel%40crunchydata.com
[2] https://www.postgresql.org/message-id/4edafedc0f8acb12a2979088ac1317bd7dd42145.camel%40crunchydata.com
[3] https://www.postgresql.org/message-id/1d3a7d8f-cb7c-4468-a578-d8a1194ea2de%40postgrespro.ru
Attachment
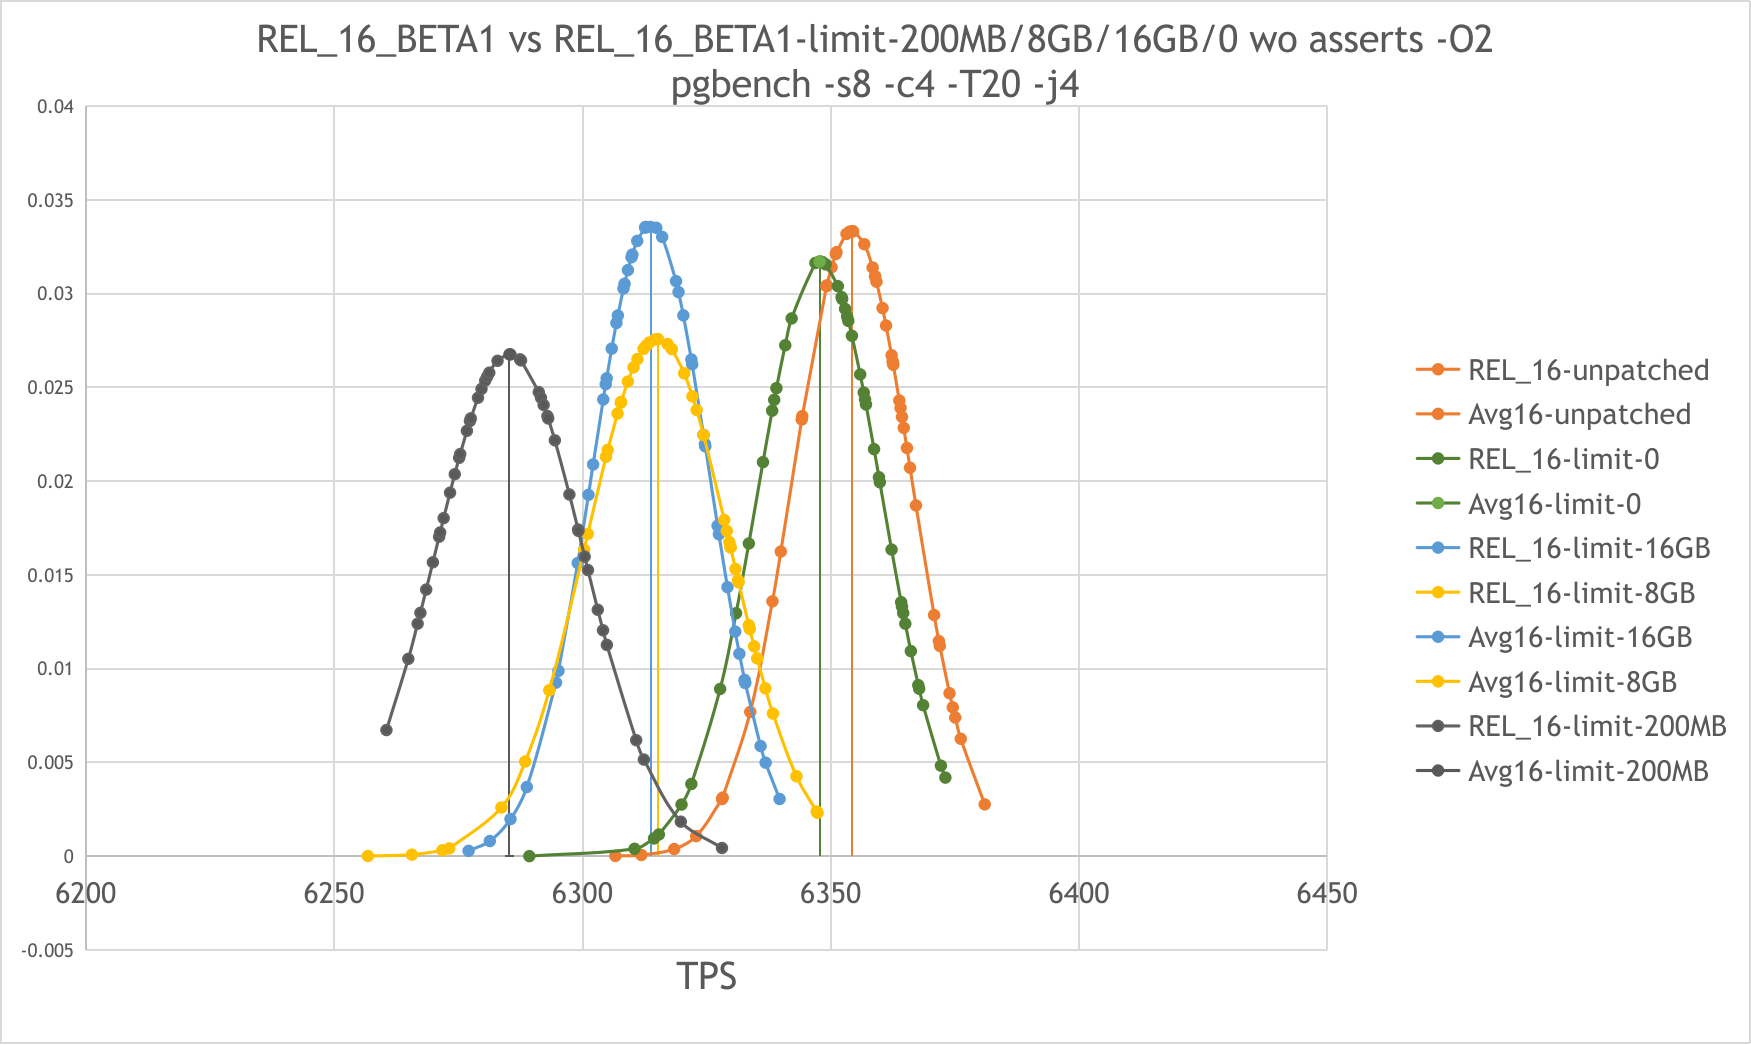
Re: Add the ability to limit the amount of memory that can be allocated to backends.
On 12/26/23 11:49, Anton A. Melnikov wrote:
> Hello!
>
> Earlier in this thread, the pgbench results were published, where with a
> strong memory limit of 100MB
> a significant, about 10%, decrease in TPS was observed [1].
>
> Using dedicated server with 12GB RAM and methodology described in [3], i
> performed five series
> of measurements for the patches from the [2].

Can you share some info about the hardware? For example the CPU model,
number of cores, and so on. 12GB RAM is not quite huge, so presumably it
was a small machine.

> The series were like this:
> 1) unpatched 16th version at the REL_16_BETA1 (e0b82fc8e83) as close to
> [2] in time.
> 2) patched REL_16_BETA1 at e0b82fc8e83 with undefined
> max_total_backend_memory GUC (with default value = 0).
> 3) patched REL_16_BETA1 with max_total_backend_memory = 16GB
> 4) the same with max_total_backend_memory = 8GB
> 5) and again with max_total_backend_memory = 200MB
>

OK

> Measurements with max_total_backend_memory = 100MB were not be carried out,
> with limit 100MB the server gave an error on startup:
> FATAL:  configured max_total_backend_memory 100MB is <=
> shared_memory_size 143MB
> So i used 200MB to retain all other GUCs the same.
>

I'm not very familiar with the patch yet, but this seems a bit strange.
Why should shared_buffers be included this limit?

> Pgbench gave the following results:
> 1) and 2) almost the same: ~6350 TPS. See orange and green
> distributions on the attached graph.png respectively.
> 3) and 4) identical to each other (~6315 TPS) and a bit slower than 1)
> and 2) by ~0,6%.
> See blue and yellow distributions respectively.
> 5) is slightly slower (~6285 TPS) than 3) and 4) by another 0,5%. (grey
> distribution)
> The standard error in all series was ~0.2%. There is a raw data in the
> raw_data.txt.
>

I think 6350 is a pretty terrible number, especially for scale 8, which
is maybe 150MB of data. I think that's a pretty clear sign the system
was hitting some other bottleneck, which can easily mask regressions in
the memory allocation code. AFAICS the pgbench runs were regular r/w
benchmarks, so I'd bet it was hitting I/O, and possibly even subject to
some random effects at that level.

I think what would be interesting are runs with

   pgbench -M prepared -S -c $N -j $N

i.e. read-only tests (to not hit I/O), and $N being sufficiently large
to maybe also show some concurrency/locking bottlenecks, etc.

I may do some benchmarks if I happen to find a bit of time, but maybe
you could collect such numbers too?

The other benchmark that might be interesting is more OLAP, with low
concurrency but backends allocating a lot of memory.


regards

--
Tomas Vondra
EnterpriseDB: http://www.enterprisedb.com
The Enterprise PostgreSQL Company
Re: Add the ability to limit the amount of memory that can be allocated to backends.
Hi,

I wanted to take a look at the patch, and I noticed it's broken since
3d51cb5197 renamed a couple pgstat functions in August. I plan to maybe
do some benchmarks etc. preferably on current master, so here's a
version fixing that minor bitrot.

As for the patch, I only skimmed through the thread so far, to get some
idea of what the approach and goals are, etc. I didn't look at the code
yet, so can't comment on that.

However, at pgconf.eu a couple week ago I had quite a few discussions
about such "backend memory limit" could/should work in principle, and
I've been thinking about ways to implement this. So let me share some
thoughts about how this patch aligns with that ...

(FWIW it's not my intent to hijack or derail this patch in any way, but
there's a couple things I think we should do differently.)

I'm 100% on board with having a memory limit "above" work_mem. It's
really annoying that we have no way to restrict the amount of memory a
backend can allocate for complex queries, etc.

But I find it a bit strange that we aim to introduce a "global" memory
limit for all backends combined first. I'm not against having that too,
but it's not the feature I usually wish to have. I need some protection
against runaway backends, that happen to allocate a lot memory.

Similarly, I'd like to be able to have different limits depending on
what the backend does - a backend doing OLAP may naturally need more
memory, while a backend doing OLTP may have a much tighter limit.

But with a single global limit none of this is possible. It may help
reducing the risk of unexpected OOM issues (not 100%, but useful), but
it can't limit the impact to the one backend - if memory starts runnning
out, it will affect all other backends a bit randomly (depending on the
order in which the backends happen to allocate memory). And it does not
consider what workloads the backends execute.

Let me propose a slightly different architecture that I imagined while
thinking about this. It's not radically differrent from what the patch
does, but it focuses on the local accounting first. I believe it's
possible to extend this to enforce the global limit too.

FWIW I haven't tried implementing this - I don't want to "hijack" this
thread and do my own thing. I can take a stab at a PoC if needed.

Firstly, I'm not quite happy with how all the memory contexts have to
do their own version of the accounting and memory checking. I think we
should move that into a new abstraction which I call "memory pool".
It's very close to "memory context" but it only deals with allocating
blocks, not the chunks requested by palloc() etc. So when someone does
palloc(), that may be AllocSetAlloc(). And instead of doing malloc()
that would do MemoryPoolAlloc(blksize), and then that would do all the
accounting and checks, and then do malloc().

This may sound like an unnecessary indirection, but the idea is that a
single memory pool would back many memory contexts (perhaps all for
a given backend). In principle we might even establish separate memory
pools for different parts of the memory context hierarchy, but I'm not
sure we need that.

I can imagine the pool could also cache blocks for cases when we create
and destroy contexts very often, but glibc should already does that for
us, I believe.

For me, the accounting and memory context is the primary goal. I wonder
if we considered this context/pool split while working on the accounting
for hash aggregate, but I think we were too attached to doing all of it
in the memory context hierarchy.

Of course, this memory pool is per backend, and so would be the memory
accounting and limit enforced by it. But I can imagine extending to do
a global limit similar to what the current patch does - using a counter
in shared memory, or something. I haven't reviewed what's the overhead
or how it handles cases when a backend terminates in some unexpected
way. But whatever the current patch does, memory pool could do too.


Secondly, I think there's an annoying issue with the accounting at the
block level - it makes it problematic to use low limit values. We double
the block size, so we may quickly end up with a block size a couple MBs,
which means the accounting granularity gets very coarse.

I think it'd be useful to introduce a "backpressure" between the memory
pool and the memory context, depending on how close we are to the limit.
For example if the limit is 128MB and the backend allocated 16MB so far,
we're pretty far away from the limit. So if the backend requests 8MB
block, that's fine and the memory pool should malloc() that. But if we
already allocated 100MB, maybe we should be careful and not allow 8MB
blocks - the memory pool should be allowed to override this and return
just 1MB block. Sure, this would have to be optional, and not all places
can accept a smaller block than requested (when the chunk would not fit
into the smaller block). It would require a suitable memory pool API
and more work in the memory contexts, but it seems pretty useful.
Certainly not something for v1.

regards

--
Tomas Vondra
EnterpriseDB: http://www.enterprisedb.com
The Enterprise PostgreSQL Company
Attachment
Re: Add the ability to limit the amount of memory that can be allocated to backends.
Hi!

Thanks for your interest and reply!

On 26.12.2023 20:28, Tomas Vondra wrote:

> Can you share some info about the hardware? For example the CPU model,
> number of cores, and so on. 12GB RAM is not quite huge, so presumably it
> was a small machine.
>

It is HP ProLanit 2x socket server. 2x6 cores Intel(R) Xeon(R) CPU X5675 @ 3.07GHz,
2x12GB RAM, RAID from SSD drives.
Linux 5.10.0-21-amd64 #1 SMP Debian 5.10.162-1 (2023-01-21) x86_64 GNU/Linux

One cpu was disabled and some tweaks was made as Andres advised to avoid
NUMA and other side effects.

Full set of the configuration commands for server was like that:
numactl --cpunodebind=0 --membind=0 --physcpubind=1,3,5,7,9,11 bash
sudo cpupower frequency-set -g performance
sudo cpupower idle-set -D0
echo 3059000 | sudo tee /sys/devices/system/cpu/cpu*/cpufreq/scaling_min_freq
(Turbo Boost and hyperthreading was disabled in BIOS.)

> I think what would be interesting are runs with
>
>     pgbench -M prepared -S -c $N -j $N
>
> i.e. read-only tests (to not hit I/O), and $N being sufficiently large
> to maybe also show some concurrency/locking bottlenecks, etc.
>
> I may do some benchmarks if I happen to find a bit of time, but maybe
> you could collect such numbers too?

Firstly, i repeated the same -c and -j values in read-only mode as you advised.
As one can see in the read-only.png, the absolute TPS value has increased
significantly, by about 13 times.
Patched version with limit 200Mb was slightly slower than with limit 0 by ~2%.
The standard error in all series was ~0.5%.
Since the deviation has increased in comparison with rw test
the difference between unpatched version and patched ones with
limits 0, 8Gb and 16Gb is not sensible.
There is a raw data in the raw_data-read-only.txt.


> I think 6350 is a pretty terrible number, especially for scale 8, which
> is maybe 150MB of data. I think that's a pretty clear sign the system
> was hitting some other bottleneck, which can easily mask regressions in
> the memory allocation code. AFAICS the pgbench runs were regular r/w
> benchmarks, so I'd bet it was hitting I/O, and possibly even subject to
> some random effects at that level.
>

To avoid possible I/O bottleneck i followed these steps:
- gave all 24G mem to cpu 0 rather than 12G as in [1];
- created a ramdisk of 12G size;
- disable swap like that:
numactl --cpunodebind=0 --physcpubind=1,3,5,7,9,11 bash
sudo swapoff -a
sudo mkdir /mnt/ramdisk
sudo mount -t tmpfs -o rw,size=12G tmpfs /mnt/ramdisk

The inst dir, data dir and log file were all on ramdisk.

Pgbench in rw mode gave the following results:
- the difference between unpatched version and patched ones with
limits 0 and 16Gb almost the same: ~7470+-0.2% TPS.
  (orange, green and blue distributions on the RW-ramdisk.png respectively)
- patched version with limit 8GB is slightly slower than three above;
  (yellow distribution)
- patched version with limit 200MB slower than the first three
   by a measurable value ~0,4% (~7440 TPS);
  (black distribution)
  The standard error in all series was ~0.2%. There is a raw data in the
  raw_data-rw-ramdisk.txt


For the sake of completeness i'm going to repeat read-only measurements
with ramdisk. Аnd perform some tests with increased -c and -j values
as you advised to find the possible point where concurrency/blocking
bottlenecks start to play a role. And do this, of cause, for the last
version of the patch. Thanks for rebased it!

In general, i don't observe any considerable degradation in performance
from this patch of several or even 10%, which were mentioned in [2].


With the best regards,

--
Anton A. Melnikov
Postgres Professional: http://www.postgrespro.com
The Russian Postgres Company

[1] https://www.postgresql.org/message-id/1d3a7d8f-cb7c-4468-a578-d8a1194ea2de%40postgrespro.ru
[2] https://www.postgresql.org/message-id/3178e9a1b7acbcf023fafed68ca48d76afc07907.camel%40crunchydata.com
Attachment
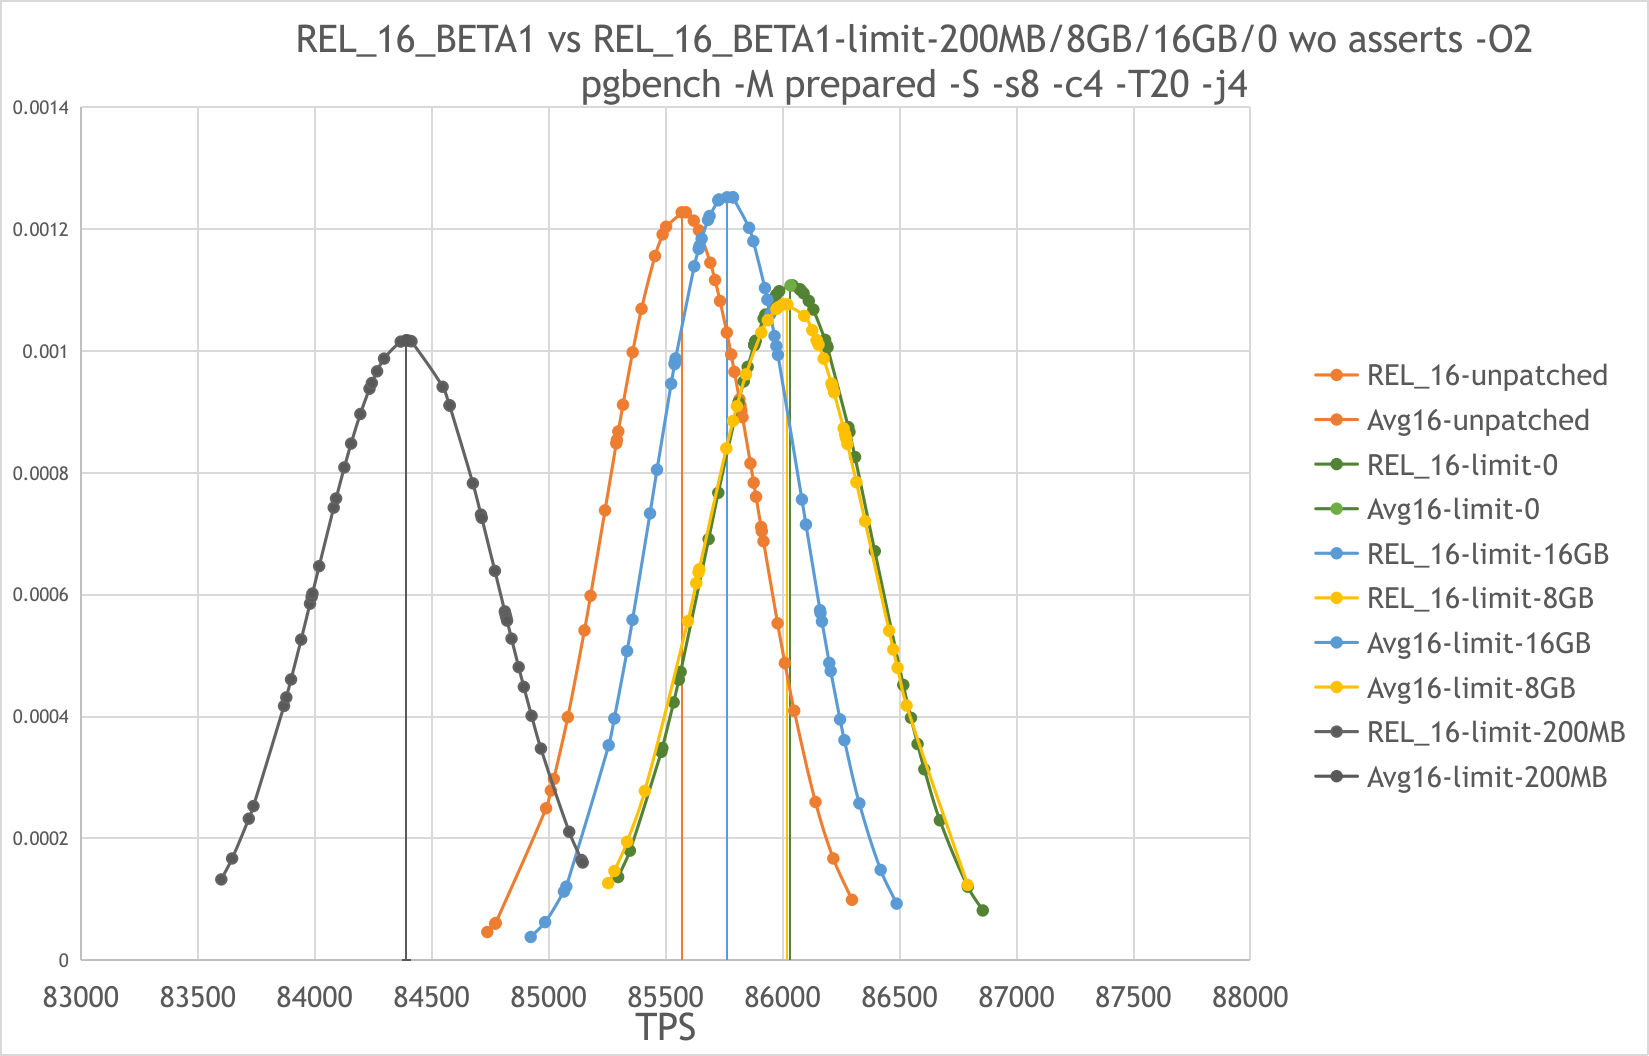
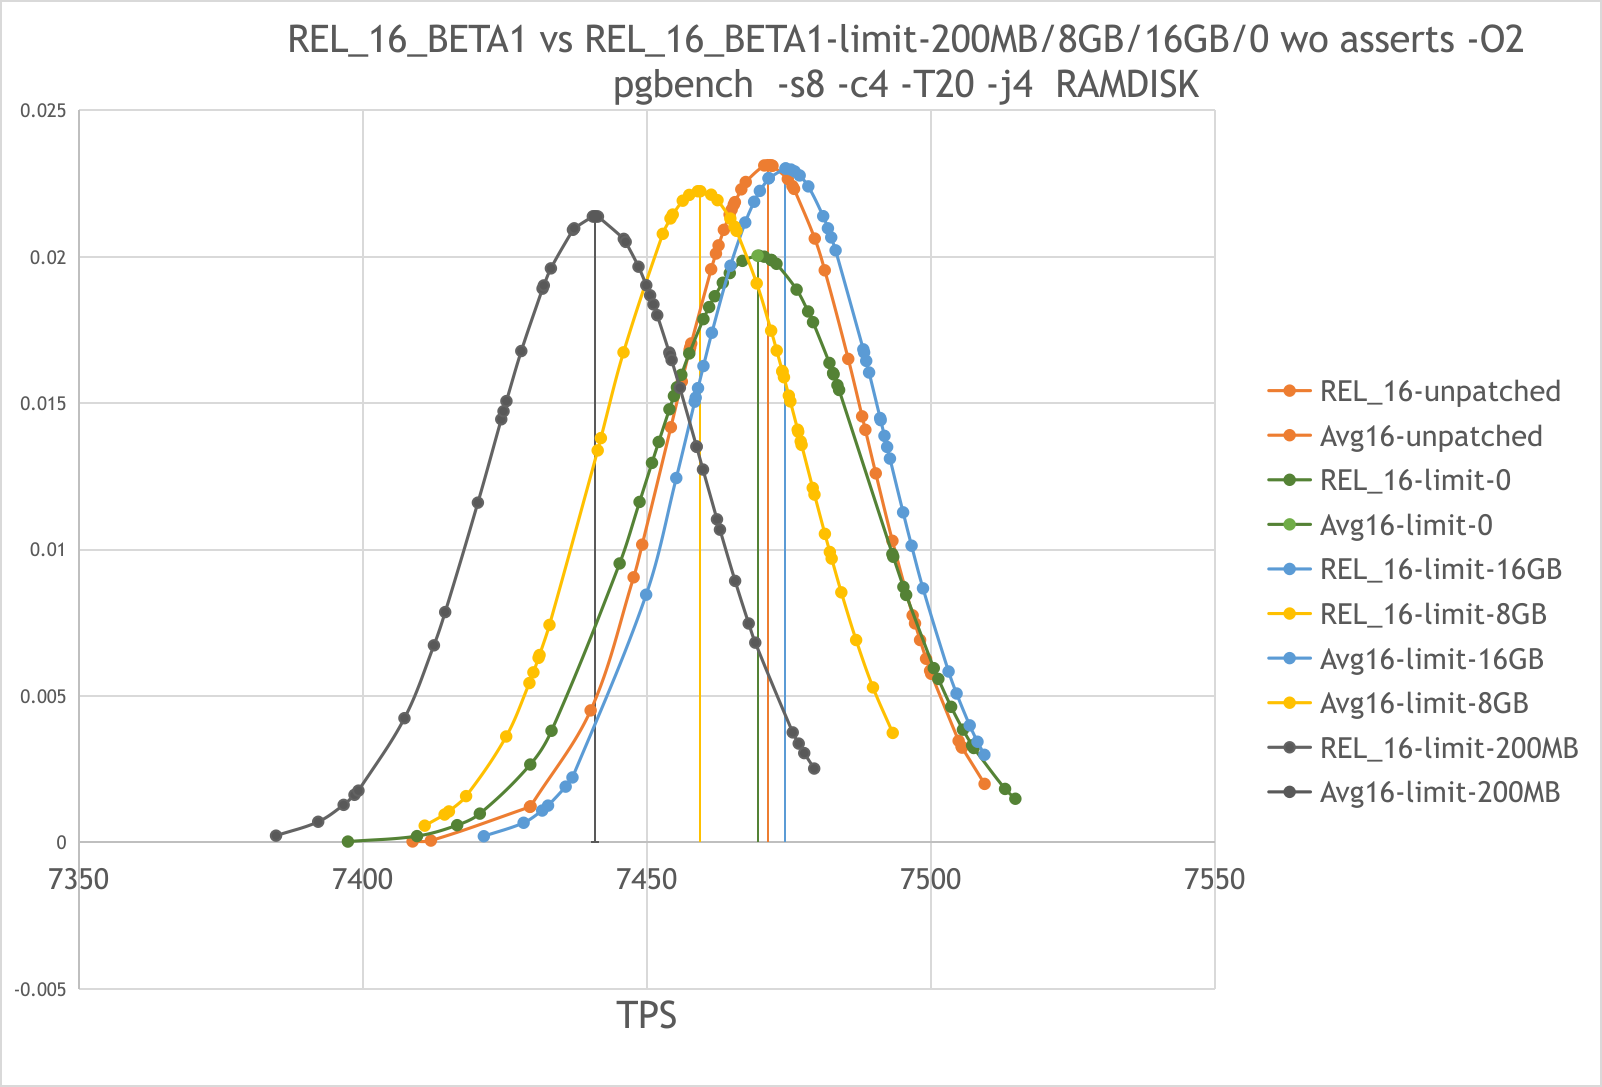
Re: Add the ability to limit the amount of memory that can be allocated to backends.
Hi,

I took a closer look at this patch over the last couple days, and I did
a bunch of benchmarks to see how expensive the accounting is. The good
news is that I haven't observed any overhead - I did two simple tests,
that I think would be particularly sensitive to this:

1) regular "pgbench -S" with scale 10, so tiny and not hitting I/O

2) "select count(*) from generate_series(1,N)" where N is either 10k or
1M, which should be enough to cause a fair number of allocations

And I tested this on three branches - master (no patches applied),
patched (but limit=0, so just accounting) and patched-limit  (with limit
set to 4.5GB, so high enough not to be hit).

Attached are script and raw results for both benchmarks from two
machines, i5 (small, 4C) and xeon (bigger, 16C/32C), and a PDF showing
the results as candlestick charts (with 1 and 2 sigma intervals). AFAICS
there's no measurable difference between master and patched builds.
Which is good, clearly the local allowance makes the overhead negligible
(at least in these benchmarks).


Now, for the patch itself - I already said some of the stuff about a
month ago [1], but I'll repeat some of it for the sake of completeness
before I get to comments about the code etc.

Firstly, I agree with the goal of having a way to account for memory
used by the backends, and also ability to enforce some sort of limit.
It's difficult to track the memory at the OS level (interpreting RSS
values is not trivial), and work_mem is not sufficient to enforce a
backend-level limit, not even talking about a global limit.

But as I said earlier, it seems quite strange to start by introducing
some sort of global limit, combining memory for all backends. I do
understand that the intent is to have such global limit in order to
prevent issues with the OOM killer and/or not to interfere with other
stuff running on the same machine. And while I'm not saying we should
not have such limit, every time I wished to have a memory limit it was a
backend-level one. Ideally a workmem-like limit that would "adjust" the
work_mem values used by the optimizer (but that's not what this patch
aims to do), or at least a backstop in case something goes wrong (say, a
memory leak, OLTP application issuing complex queries, etc.).

The accounting and infrastructure introduced by the patch seems to be
suitable for both types of limits (global and per-backend), but then it
goes for the global limit first. It may seem simpler to implement, but
in practice there's a bunch of problems mentioned earlier, but ignored.

For example, I really don't believe it's OK to just report the error in
the first backend that happens to hit the limit. Bertrand mentioned that
[2], asking about a situation when a runaway process allocates 99% of
memory. The response to that was

> Initially, we believe that punishing the detector is reasonable if we
> can help administrators avoid the OOM killer/resource starvation.  But
> we can and should expand on this idea.

which I find rather unsatisfactory. Belief is not an argument, and it
relies on the assumption that this helps the administrator to avoid the
OOM killer etc. ISTM it can easily mean the administrator can't even
connect to the database, run a query (to inspect the new system views),
etc. because any of that would hit the memory limit. That seems more
like a built-in DoS facility ...

If this was up to me, I'd probably start with the per-backend limit. But
that's my personal opinion.

Now, some comments about the code etc. Stephen was promising a new patch
version in October [6], but that didn't happen yet, so I looked at the
patches I rebased in December.


0001
----

1) I don't see why we should separate memory by context type - without
knowing which exact backends are using the memory, this seems pretty
irrelevant/useless. Either it's private or shared memory, I don't think
the accounting should break this into more counters. Also, while I'm not
aware of anyone proposing a new memory context type, I doubt we'd want
to add more and more counters if that happens.

suggestion: only two counters, for local and shared memory

If we absolutely want to have per-type counters, we should not mix the
private memory and shared memory ones.


2) I have my doubts about the tracking of shared memory. It seems weird
to count them only into the backend that allocated them, and transfer
them to "global" on process exit. Surely we should know which shared
memory is meant to be long-lived from the start, no?

For example, it's not uncommon that an extension allocates a chunk of
shared memory to store some sort of global state (e.g. BDR/pglogical
does that, I'm sure other extensions do that). But the process that
allocates the shared memory keeps running. AFAICS this would be tracked
as backend DSM memory, which I'm not sure this is what we want ...

And I'm not alone in thinking this should work differently - [3], [4].


3) We limit the floor of allocation counters to zero.

This seems really weird. Why would it be necessary? I mean, how could we
get a negative amount of memory? Seems like it might easily mask issues
with incorrect accounting, or something.


4) pg_stat_memory_allocation

Maybe pg_stat_memory_usage would be a better name ...


5) The comments/docs repeatedly talk about "dynamic nature" and that it
makes the values not exact:

> Due to the dynamic nature of memory allocations the allocated bytes
> values may not be exact but should be sufficient for the intended
> purposes.

I don't understand what "dynamic nature" refers to, and why would it
make the values not exact. Presumably this refers to the "allowance" but
how is that "dynamic nature"?

This definitely needs to explain this better, with some basic estimate
how how accurate the values are expected to be.


6) The SGML docs keep recommending to use pg_size_pretty(). I find that
unnecessary, no other docs reporting values in bytes do that.


7) I see no reason to include shared_memory_size_mb in the view, and
same for shared_memory_size_in_huge_pages. It has little to do with
"allocated" memory, IMO. And a value in "MB" goes directly against the
suggestion to use pg_size_pretty().

suggestion: drop this from the view


8) In a lot of places we do

    context->mem_allocated += blksize;
    pgstat_report_allocated_bytes_increase(blksize, PG_ALLOC_ASET);

Maybe we should integrate the two types of accounting, wrap them into a
single function call, or something? This makes it very simple to forget
updating one of those places. AFAIC the patch tries to minimize the
number of updates of the new shared counters, but with the allowance
that should not be an issue I think.


9) This seems wrong. Why would it be OK to ever overflow? Isn't that a
sign of incorrect accounting?

    /* Avoid allocated_bytes unsigned integer overflow on decrease */
    if (pg_sub_u64_overflow(*my_allocated_bytes, proc_allocated_bytes,
&temp))
    {
        /* On overflow, set allocated bytes and allocator type bytes to
zero */
        *my_allocated_bytes = 0;
        *my_aset_allocated_bytes = 0;
        *my_dsm_allocated_bytes = 0;
        *my_generation_allocated_bytes = 0;
        *my_slab_allocated_bytes = 0;
    }

9) How could any of these values be negative? It's all capped to 0 and
also stored in uint64. Seems pretty useless.

+SELECT
+    datid > 0, pg_size_bytes(shared_memory_size) >= 0,
shared_memory_size_in_huge_pages >= -1, global_dsm_allocated_bytes >= 0
+FROM
+    pg_stat_global_memory_allocation;
+ ?column? | ?column? | ?column? | ?column?
+----------+----------+----------+----------
+ t        | t        | t        | t
+(1 row)
+
+-- ensure that pg_stat_memory_allocation view exists
+SELECT
+    pid > 0, allocated_bytes >= 0, aset_allocated_bytes >= 0,
dsm_allocated_bytes >= 0, generation_allocated_bytes >= 0,
slab_allocated_bytes >= 0


0003
----

1) The commit message says:

> Further requests will not be allocated until dropping below the limit.
> Keep this in mind when setting this value.

The SGML docs have a similar "keep this in mind" suggestion in relation
to the 1MB local allowance. I find this pretty useless, as it doesn't
really say what to do with the information / what it means. I mean,
should I set the value higher, or what am I supposed to do? This needs
to be understandable for average user reading the SGML docs, who is
unlikely to know the implementation details.


2) > This limit does not affect auxiliary backend processes.

This seems pretty unfortunate, because in the cases where I actually saw
OOM killer to intervene, it was often because of auxiliary processes
allocating a lot of memory (say, autovacuum with maintenance_work_mem
set very high, etc.).

In a way, not excluding these auxiliary processes from the limit seems
to go against the idea of preventing the OOM killer.


3) I don't think the patch ever explains what the "local allowance" is,
how the refill works, why it's done this way, etc. I do think I
understand that now, but I had to go through the thread, That's not
really how it should be. There should be an explanation of how this
works somewhere (comment in mcxt.c? separate README?).


4) > doc/src/sgml/monitoring.sgml

Not sure why this removes the part about DSM being included only in the
backend that created it.


5) > total_bkend_mem_bytes_available

The "bkend" name is strange (to save 2 characters), and the fact how it
combines local and shared memory seems confusing too.


6)
+ /*
+ * Local counter to manage shared memory allocations. At backend
startup, set to
+ * initial_allocation_allowance via pgstat_init_allocated_bytes().
Decrease as
+ * memory is malloc'd. When exhausted, atomically refill if available from
+ * ProcGlobal->max_total_bkend_mem via exceeds_max_total_bkend_mem().
+ */
+uint64        allocation_allowance = 0;

But this allowance is for shared memory too, and shared memory is not
allocated using malloc.


7) There's a lot of new global variables. Maybe it'd be better to group
them into a struct, or something?


8) Why does pgstat_set_allocated_bytes_storage need the new return?


9) Unnecessary changes in src/backend/utils/hash/dynahash.c (whitespace,
new comment that seems not very useful)


10) Shouldn't we have a new malloc wrapper that does the check? That way
we wouldn't need to have the call in every memory context place calling
malloc.


11) I'm not sure about the ereport() calls after hitting the limit.
Adres thinks it might lead to recursion [4], but Stephen [5] seems to
think this does not really make the situation worse. I'm not sure about
that, though - I agree the ENOMEM can already happen, but but maybe
having a limit (which clearly needs to be more stricter than the limit
used by kernel for OOM) would be more likely to hit?

12) In general, I agree with Andres [4] that we'd be better of to focus
on the accounting part, see how it works in practice, and then add some
ability to limit memory after a while.


regards


[1]
https://www.postgresql.org/message-id/4fb99fb7-8a6a-2828-dd77-e2f1d75c7dd0%40enterprisedb.com

[2]
https://www.postgresql.org/message-id/3b9b90c6-f4ae-a7df-6519-847ea9d5fe1e%40amazon.com

[3]
https://www.postgresql.org/message-id/20230110023118.qqbjbtyecofh3uvd%40awork3.anarazel.de

[4]
https://www.postgresql.org/message-id/20230113180411.rdqbrivz5ano2uat%40awork3.anarazel.de

[5]
https://www.postgresql.org/message-id/ZTArWsctGn5fEVPR%40tamriel.snowman.net

[6]
https://www.postgresql.org/message-id/ZTGycSYuFrsixv6q%40tamriel.snowman.net


--
Tomas Vondra
EnterpriseDB: http://www.enterprisedb.com
The Enterprise PostgreSQL Company
Attachment
Re: Add the ability to limit the amount of memory that can be allocated to backends.
Hi,

> I took a closer look at this patch over the last couple days, and I did
> a bunch of benchmarks to see how expensive the accounting is. The good
> news is that I haven't observed any overhead - I did two simple tests,
> that I think would be particularly sensitive to this:
>
> [...]

Just wanted to let you know that v20231226 doesn't apply. The patch
needs love from somebody interested in it.

Best regards,
Aleksander Alekseev (wearing a co-CFM hat)
Re: Add the ability to limit the amount of memory that can be allocated to backends.
On 12.03.2024 16:30, Aleksander Alekseev wrote:

> Just wanted to let you know that v20231226 doesn't apply. The patch
> needs love from somebody interested in it.

Thanks for pointing to this!
Here is a version updated for the current master.

With the best regards,

--
Anton A. Melnikov
Postgres Professional: http://www.postgrespro.com
The Russian Postgres Company
Attachment
Re: Add the ability to limit the amount of memory that can be allocated to backends.
On 13.03.2024 10:41, Anton A. Melnikov wrote:

> Here is a version updated for the current master.
>

During patch updating i mistakenly added double counting of deallocatated blocks.
That's why the tests in the patch tester failed.
Fixed it and squashed fix 0002 with 0001.
Here is fixed version.

With the best wishes!

--
Anton A. Melnikov
Postgres Professional: http://www.postgrespro.com
The Russian Postgres Company
Attachment
Re: Add the ability to limit the amount of memory that can be allocated to backends.
Hello Anton,

14.03.2024 23:36, Anton A. Melnikov wrote:
> On 13.03.2024 10:41, Anton A. Melnikov wrote:
>
>> Here is a version updated for the current master.
>>
>
> During patch updating i mistakenly added double counting of deallocatated blocks.
> That's why the tests in the patch tester failed.
> Fixed it and squashed fix 0002 with 0001.
> Here is fixed version.

Please try the following with the patches applied:
echo "shared_buffers = '1MB'
max_total_backend_memory = '10MB'" > /tmp/extra.config

CPPFLAGS="-Og" ./configure --enable-tap-tests --enable-debug --enable-cassert ...
TEMP_CONFIG=/tmp/extra.config make check

It fails for me as follows:
...
# postmaster did not respond within 60 seconds, examine ".../src/test/regress/log/postmaster.log" for the reason
...
src/test/regress/log/postmaster.log contains:
...
TRAP: failed Assert("ret != NULL"), File: "mcxt.c", Line: 1327, PID: 4109270
TRAP: failed Assert("ret != NULL"), File: "mcxt.c", Line: 1327, PID: 4109271
postgres: autovacuum launcher (ExceptionalCondition+0x69)[0x55ce441fcc6e]
postgres: autovacuum launcher (palloc0+0x0)[0x55ce4422eb67]
postgres: logical replication launcher (ExceptionalCondition+0x69)[0x55ce441fcc6e]
postgres: autovacuum launcher (InitDeadLockChecking+0xa6)[0x55ce4408a6f0]
postgres: logical replication launcher (palloc0+0x0)[0x55ce4422eb67]
postgres: logical replication launcher (InitDeadLockChecking+0x45)[0x55ce4408a68f]
postgres: autovacuum launcher (InitProcess+0x600)[0x55ce4409c6f2]
postgres: logical replication launcher (InitProcess+0x600)[0x55ce4409c6f2]
postgres: autovacuum launcher (+0x44b4e2)[0x55ce43ff24e2]
...
grep TRAP src/test/regress/log/postmaster.log | wc -l
445

Best regards,
Alexander
Re: Add the ability to limit the amount of memory that can be allocated to backends.
Reviving this thread, because I am thinking about something related --
please ignore the "On Fri, Dec 27, 2024" date, this seems to be an
artifact of me re-sending the message, from the list archive. The
original message was from January 28, 2024.

On Fri, Dec 27, 2024 at 11:02 AM Tomas Vondra
<tomas.vondra@enterprisedb.com> wrote:
>
> Firstly, I agree with the goal of having a way to account for memory
> used by the backends, and also ability to enforce some sort of limit.
> It's difficult to track the memory at the OS level (interpreting RSS
> values is not trivial), and work_mem is not sufficient to enforce a
> backend-level limit, not even talking about a global limit.
>
> But as I said earlier, it seems quite strange to start by introducing
> some sort of global limit, combining memory for all backends. I do
> understand that the intent is to have such global limit in order to
> prevent issues with the OOM killer and/or not to interfere with other
> stuff running on the same machine. And while I'm not saying we should
> not have such limit, every time I wished to have a memory limit it was a
> backend-level one. Ideally a workmem-like limit that would "adjust" the
> work_mem values used by the optimizer (but that's not what this patch
> aims to do), or at least a backstop in case something goes wrong (say, a
> memory leak, OLTP application issuing complex queries, etc.).

I think what Tomas suggests is the right strategy. I am thinking of
something like:

1. Say we have a backend_work_mem limit. Then the total amount of
memory available on the entire system, for all queries, as work_mem,
would be backend_work_mem * max_connections.

2. We use this backend_work_mem to "adjust" work_mem values used by
the executor. (I don't care about the optimizer right now -- optimizer
just does its best to predict what will happen at runtime.)

At runtime, every node that uses work_mem currently checks its memory
usage against the session work_mem (and possibly hash_mem_multiplier)
GUC(s). Instead, now, every node would check against its node-specific
"adjusted" work_mem. If it exceeds this limit, it spills, using
existing logic.

In other words -- existing logic spills based on comparison to global
work_mem GUC. Let's make it spill, instead, based on comparison to an
operator-local "PlanState.work_mem" field.

And then let's set that "PlanState.work_mem" field based on a new
"backend_work_mem" GUC. Then no queries will run OOM (at least, not
due to work_mem -- we'll address other memory usages separately), so
they won't need to be canceled. Instead, they'll spill.

This strategy solves the ongoing problem of how to set work_mem, if
some queries have lots of operators and others don't -- now we just
set backend_work_mem, as a limit on the entire query's total work_mem.
And a bit of integration with the optimizer will allow us to
distribute the total backend_work_mem to individual execution nodes,
with the goal of minimizing spilling, without exceeding the
backend_work_mem limit.

Anyway, I revived this thread to see if there's interest in this sort
of strategy --

Thanks,
James
Re: Add the ability to limit the amount of memory that can be allocated to backends.
On 12/27/24 20:14, James Hunter wrote:
> Reviving this thread, because I am thinking about something related --
> please ignore the "On Fri, Dec 27, 2024" date, this seems to be an
> artifact of me re-sending the message, from the list archive. The
> original message was from January 28, 2024.
>
> On Fri, Dec 27, 2024 at 11:02 AM Tomas Vondra
> <tomas.vondra@enterprisedb.com> wrote:
>>
>> Firstly, I agree with the goal of having a way to account for memory
>> used by the backends, and also ability to enforce some sort of limit.
>> It's difficult to track the memory at the OS level (interpreting RSS
>> values is not trivial), and work_mem is not sufficient to enforce a
>> backend-level limit, not even talking about a global limit.
>>
>> But as I said earlier, it seems quite strange to start by introducing
>> some sort of global limit, combining memory for all backends. I do
>> understand that the intent is to have such global limit in order to
>> prevent issues with the OOM killer and/or not to interfere with other
>> stuff running on the same machine. And while I'm not saying we should
>> not have such limit, every time I wished to have a memory limit it was a
>> backend-level one. Ideally a workmem-like limit that would "adjust" the
>> work_mem values used by the optimizer (but that's not what this patch
>> aims to do), or at least a backstop in case something goes wrong (say, a
>> memory leak, OLTP application issuing complex queries, etc.).
>
> I think what Tomas suggests is the right strategy. I am thinking of
> something like:
>
> 1. Say we have a backend_work_mem limit. Then the total amount of
> memory available on the entire system, for all queries, as work_mem,
> would be backend_work_mem * max_connections.
>
> 2. We use this backend_work_mem to "adjust" work_mem values used by
> the executor. (I don't care about the optimizer right now -- optimizer
> just does its best to predict what will happen at runtime.)
>
> At runtime, every node that uses work_mem currently checks its memory
> usage against the session work_mem (and possibly hash_mem_multiplier)
> GUC(s). Instead, now, every node would check against its node-specific
> "adjusted" work_mem. If it exceeds this limit, it spills, using
> existing logic.
>
> In other words -- existing logic spills based on comparison to global
> work_mem GUC. Let's make it spill, instead, based on comparison to an
> operator-local "PlanState.work_mem" field.
>
> And then let's set that "PlanState.work_mem" field based on a new
> "backend_work_mem" GUC. Then no queries will run OOM (at least, not
> due to work_mem -- we'll address other memory usages separately), so
> they won't need to be canceled. Instead, they'll spill.
>
> This strategy solves the ongoing problem of how to set work_mem, if
> some queries have lots of operators and others don't -- now we just
> set backend_work_mem, as a limit on the entire query's total work_mem.
> And a bit of integration with the optimizer will allow us to
> distribute the total backend_work_mem to individual execution nodes,
> with the goal of minimizing spilling, without exceeding the
> backend_work_mem limit.
>
> Anyway, I revived this thread to see if there's interest in this sort
> of strategy --
>

I think there's still interest in having a memory limit of this kind,
but it's not very clear to me what you mean by "adjusted work_mem". Can
you explain how would that actually work in practice?

Whenever I've been thinking about this in the past, it wasn't clear to
me how would we know when to start adjusting work_mem, because we don't
know which nodes will actually use work_mem concurrently.

We certainly don't know that during planning - e.g. because we don't
actually know what nodes will be "above" the operation we're planning.
And AFIAK we don't have any concept which parts of the plan may be
active at the same time ...

Let's say we have limits work_mem=4MB and query_mem=8MB (to keep it
simple). And we have a query plan with 3 separate hash joins, each
needing 4MB. I believe these things can happen:

1) The hash joins are in distant parts of the query plan, and will not
actually run concurrently - we'll run each hashjoin till completion
before starting the next one. So, no problem with query_mem.

2) The hash joins are active at the same time, initialized one by one.
But we don't know what, so we'll init HJ #1, it'll get 4MB of memory.
Then we'll init HJ #2, it'll also get 4MB of memory. And now we want to
init HJ #3, but we've already exhausted query_mem, but the memory is
already used and we can't reclaim it.

How would the work_mem get adjusted in these cases? Ideally, we'd not
adjust work_mem in (1), because it'd force hash joins to spill data to
disk, affecting performance when there's enough memory to just run the
query plan (but maybe that's a reasonable price for the memory limit?).
While in (2) we'd need to start adjusting the memory from the beginning,
but I don't think we know that so early.

Can you explain / walk me through the proposal for these cases?

regards

--
Tomas Vondra
Re: Add the ability to limit the amount of memory that can be allocated to backends.
On 12/28/24 13:36, Anton A. Melnikov wrote:
> Hi!
>
> On 28.12.2024 04:48, Tomas Vondra wrote:
>> On 12/27/24 20:14, James Hunter wrote:
>>> Reviving this thread, because I am thinking about something related --
>>> please ignore the "On Fri, Dec 27, 2024" date, this seems to be an
>>> artifact of me re-sending the message, from the list archive. The
>>> original message was from January 28, 2024.
>>>
>>> On Fri, Dec 27, 2024 at 11:02 AM Tomas Vondra
>>> <tomas.vondra@enterprisedb.com> wrote:
>>>>
>>>> Firstly, I agree with the goal of having a way to account for memory
>>>> used by the backends, and also ability to enforce some sort of limit.
>>>> It's difficult to track the memory at the OS level (interpreting RSS
>>>> values is not trivial), and work_mem is not sufficient to enforce a
>>>> backend-level limit, not even talking about a global limit.
>>>>
>>>> But as I said earlier, it seems quite strange to start by introducing
>>>> some sort of global limit, combining memory for all backends. I do
>>>> understand that the intent is to have such global limit in order to
>>>> prevent issues with the OOM killer and/or not to interfere with other
>>>> stuff running on the same machine. And while I'm not saying we should
>>>> not have such limit, every time I wished to have a memory limit it
>>>> was a
>>>> backend-level one. Ideally a workmem-like limit that would "adjust" the
>>>> work_mem values used by the optimizer (but that's not what this patch
>>>> aims to do), or at least a backstop in case something goes wrong
>>>> (say, a
>>>> memory leak, OLTP application issuing complex queries, etc.).
>>>
>>> I think what Tomas suggests is the right strategy.
>
> I'm also interested in this topic. And agreed that it's best to move
> from the limit
> for a separate backend to the global one. In more details let me suggest
> the following steps or parts:
> 1) realize memory limitation for a separate backend independent from the
> work_mem GUC;
> 2) add workmem-like limit that would "adjust" the work_mem values used by
> the optimize as Thomas suggested;
> 3) add global limit for all backends.
>
> As for p.1 there is a patch that was originally suggested by my colleague
> Maxim Orlov <orlovmg@gmail.com> and which i modified for the current
> master.
> This patch introduces the only max_backend_memory GUC that specifies
> the maximum amount of memory that can be allocated to a backend.
> Zero value means no limit.
> If the allocated memory size is exceeded, a standard "out of memory"
> error will be issued.
> Also the patch introduces the
> pg_get_backend_memory_contexts_total_bytes() function,
> which allows to know how many bytes have already been allocated
> to the process in contexts. And in the build with asserts it adds
> the pg_get_backend_memory_allocation_stats() function that allows
> to get additional information about memory allocations for debug purposes.
>

Not sure a simple memory limit like in the patch (which just adds memory
accounting + OOM after hitting the limit) can work as anything but a the
last safety measure. It seems to me the limit would have to be set to a
value that's much higher than any backend would realistically need.

The first challenge I envision is that without any feedback (either to
the planner or executor), it may break queries quite easily. It just
takes the planner to add one more sort / hash join / materialize (which
it can do arbitrarily, as it has no concept of the memory limit), and
now the query can't run.

And secondly, there are allocations that we don't restrict by work_mem,
but this memory limit would include them, ofc. The main example that I
can think of is hash join, where we (currently) don't account for the
BufFile arrays, and that can already lead to annoying OOM issues, see
e.g. [1] [2] and [3] (I'm sure there are more threads about the issue).

It's wrong we don't account for the BufFile arrays, so it's not included
in work_mem (or considered is some other way). And maybe we should
finally improve that (not the fault of this patch, ofc). But it's hard,
because as the amount of data grows, we have to add more batches - and
at some point that starts adding more memory than we save. Ultimately,
we end up breaking work_mem one way or the other - either we add more
batches, or allow the hash table to exceed work_mem.

That's a preexisting issue, of course. But wouldn't this simple limit
make the situation worse? The query would likely complete OK (otherwise
we'd get many more reports about OOM), but with the new limit it would
probably fail with OOM. Maybe that's correct, and the response to that
is "Don't set the limit with such queries," although it's hard to say in
advance and it can happen randomly? Not sure.

What bothers me a bit is that users would likely try to reduce work_mem,
but that's the wrong thing to do in this case - it just increases the
number of batches, and thus makes the situation worse.

[1]
https://www.postgresql.org/message-id/20190504003414.bulcbnge3rhwhcsh%40development

[2] https://www.postgresql.org/message-id/20230228190643.1e368315%40karst

[3]
https://www.postgresql.org/message-id/bc138e9f-c89e-9147-5395-61d51a757b3b%40gusw.net

>>> This strategy solves the ongoing problem of how to set work_mem, if
>>> some queries have lots of operators and others don't -- now we just
>>> set backend_work_mem, as a limit on the entire query's total work_mem.
>>> And a bit of integration with the optimizer will allow us to
>>> distribute the total backend_work_mem to individual execution nodes,
>>> with the goal of minimizing spilling, without exceeding the
>>> backend_work_mem limit.
>
> As for p.2 maybe one can set a maximum number of parallel sort or
> hash table operations before writing to disk instead of absolute
> value in the work_mem GUC? E.g. introduce а max_query_operations GUC
> or a variable in such a way that old work_mem will be equal
> to max_backend_memory divided by max_query_operations.
>
> What do you think about such approach?
>

It's not clear to me how you want to calculate the number of parallel
operations that might use work_mem. Can you elaborate?

regards

--
Tomas Vondra
Re: Add the ability to limit the amount of memory that can be allocated to backends.
On Sat, 28 Dec 2024 15:57:44 +0100
Tomas Vondra <tomas@vondra.me> wrote:
>
> Not sure a simple memory limit like in the patch (which just adds
> memory accounting + OOM after hitting the limit) can work as anything
> but a the last safety measure. It seems to me the limit would have to
> be set to a value that's much higher than any backend would
> realistically need.
>
> The first challenge I envision is that without any feedback (either to
> the planner or executor), it may break queries quite easily. It just
> takes the planner to add one more sort / hash join / materialize
> (which it can do arbitrarily, as it has no concept of the memory
> limit), and now the query can't run.
>
> And secondly, there are allocations that we don't restrict by
> work_mem, but this memory limit would include them, ofc. The main
> example that I can think of is hash join, where we (currently) don't
> account for the BufFile arrays, and that can already lead to annoying
> OOM issues, see e.g. [1] [2] and [3] (I'm sure there are more threads
> about the issue).

Hi James!

While I don't have a detailed design in mind, I'd like to add a strong
+1 on the general idea that work_mem is hard to effectively use because
queries can vary so widely in how many nodes might need work memory.

I'd almost like to have two limits:

First, a hard per-connection limit which could be set very high - we
can track total memory usage across contexts inside of palloc and pfree
(and maybe this could also be exposed in pg_stat_activity for easy
visibility into a snapshot of memory use across all backends). If
palloc detects that an allocation would take the total over the hard
limit, then you just fail the palloc with an OOM. This protects
postgres from a memory leak in a single backend OOM'ing the whole
system and restarting the whole database; failing a single connection
is better than failing all of them.

Second, a soft per-connection "total_connection_work_mem_target" which
could be set lower. The planner can just look at the total number of
nodes that it expects to allocate work memory, divide the target by
this and then set the work_mem for that query.  There should be a
reasonable floor (minimum) for work_mem - maybe the value of work_mem
itself becomes this and the new target doesn't do anything besides
increasing runtime work_mem.

Maybe even could do a "total_instance_work_mem_target" where it's
divided by the number of average active connections or something.

In practice this target idea doesn't guarantee anything about total work
memory used, but it's the tool I'd most like as an admin. And the
per-connection hard limit is the tool I'd like to have for protecting
myself against memory leaks or individual connections going bonkers and
killing all my connections for an instance restart.

-Jeremy
Re: Add the ability to limit the amount of memory that can be allocated to backends.
While I don't have a detailed design in mind, I'd like to add a strong
+1 on the general idea that work_mem is hard to effectively use because
queries can vary so widely in how many nodes might need work memory.
I'd almost like to have two limits:
First, a hard per-connection limit which could be set very high - we
can track total memory usage across contexts inside of palloc and pfree
(and maybe this could also be exposed in pg_stat_activity for easy
visibility into a snapshot of memory use across all backends). If
palloc detects that an allocation would take the total over the hard
limit, then you just fail the palloc with an OOM. This protects
postgres from a memory leak in a single backend OOM'ing the whole
system and restarting the whole database; failing a single connection
is better than failing all of them.
Second, a soft per-connection "total_connection_work_mem_target" which
could be set lower. The planner can just look at the total number of
nodes that it expects to allocate work memory, divide the target by
this and then set the work_mem for that query. There should be a
reasonable floor (minimum) for work_mem - maybe the value of work_mem
itself becomes this and the new target doesn't do anything besides
increasing runtime work_mem.
Maybe even could do a "total_instance_work_mem_target" where it's
divided by the number of average active connections or something.
Re: Add the ability to limit the amount of memory that can be allocated to backends.
On Fri, Dec 27, 2024 at 5:48 PM Tomas Vondra <tomas@vondra.me> wrote:

> Whenever I've been thinking about this in the past, it wasn't clear to
> me how would we know when to start adjusting work_mem, because we don't
> know which nodes will actually use work_mem concurrently.

You certainly know the PostgreSQL source code better than I do, but
just looking over nodeHash[join].c, for example, it looks like we
don't call ExecHashTableDestroy() until ExecEndHashJoin() or
ExecReScanHashJoin(). I am assuming this means that we don't destroy
the hash table (and therefore don't free the work_mem) until we either
(a) end the executor for the entire query plan, or (b) rescan the hash
join.

Does PostgreSQL currently rescan Hash Joins when they are "no longer
needed," to free work_mem early? If so, then I would try to reuse this
existing logic to decide which nodes need work_mem concurrently.

If not, then all nodes that use work_mem actually use it
"concurrently," because we don't free that work_mem until we call
ExecutorEnd().

Or, is the problem that one query might generate and execute a second
query, recursively? (And the second might generate and execute a third
query, etc.?) For example, the first query might call a function that
starts a new portal and executes a second query, and so on. Is this
what you're thinking about? If so, I would model this pattern as each
level of recursion taking up, logically, a "new connection."

Thanks,
James
Re: Add the ability to limit the amount of memory that can be allocated to backends.
On Tue, 31 Dec 2024 at 10:11, James Hunter <james.hunter.pg@gmail.com> wrote:
> Does PostgreSQL currently rescan Hash Joins when they are "no longer
> needed," to free work_mem early? If so, then I would try to reuse this
> existing logic to decide which nodes need work_mem concurrently.
>
> If not, then all nodes that use work_mem actually use it
> "concurrently," because we don't free that work_mem until we call
> ExecutorEnd().

The problem with that statement is that Hash Join isn't the only node
type that uses work_mem. Plenty of other node types do.  Have a look
at MultiExecBitmapOr(). You can see logic there that does tbm_free()
after the tbm_union() call. Going by that, it seems there is at least
one place where we might free some work_mem memory before allocating
another lot.

David
Re: Add the ability to limit the amount of memory that can be allocated to backends.
On Sat, 28 Dec 2024 at 08:14, James Hunter <james.hunter.pg@gmail.com> wrote:
> 2. We use this backend_work_mem to "adjust" work_mem values used by
> the executor. (I don't care about the optimizer right now -- optimizer
> just does its best to predict what will happen at runtime.)

While I do want to see improvements in this area, I think "don't care
about the optimizer" is going to cause performance issues.  The
problem is that the optimizer takes into account what work_mem is set
to when calculating the costs of work_mem-consuming node types. See
costsize.c for usages of "work_mem". If you go and reduce the amount
of memory a given node can consume after the costs have been applied
then we may end up in a situation where some other plan would have
suited much better.

There's also the problem with what to do when you chop work_mem down
so far that the remaining size is just a pitiful chunk. For now,
work_mem can't go below 64 kilobytes. You might think that's a very
unlikely situation that it'd be chopped down so far, but with
partition-wise join and partition-wise aggregate, we could end up
using a work_mem per partition and if you have thousands of partitions
then you might end up reducing work_mem by quite a large amount.

I think the best solution to this is the memory grant stuff I talked
about in [1]. That does require figuring out which nodes will consume
the work_mem concurrently so that infrastructure you talked about to
do that would be a good step forward towards that, but that's probably
not the most difficult part of that idea.

I definitely encourage work in this area, but I think what you're
proposing might be swapping one problem for another problem.

David

[1] https://www.postgresql.org/message-id/CAApHDvrzacGEA1ZRea2aio_LAi2fQcgoK74bZGfBddg4ymW-Ow@mail.gmail.com
Re: Add the ability to limit the amount of memory that can be allocated to backends.
On Mon, Dec 30, 2024 at 2:56 PM David Rowley <dgrowleyml@gmail.com> wrote:
>
> On Tue, 31 Dec 2024 at 10:11, James Hunter <james.hunter.pg@gmail.com> wrote:
> > Does PostgreSQL currently rescan Hash Joins when they are "no longer
> > needed," to free work_mem early? If so, then I would try to reuse this
> > existing logic to decide which nodes need work_mem concurrently.
> >
> > If not, then all nodes that use work_mem actually use it
> > "concurrently," because we don't free that work_mem until we call
> > ExecutorEnd().
>
> The problem with that statement is that Hash Join isn't the only node
> type that uses work_mem. Plenty of other node types do.  Have a look
> at MultiExecBitmapOr(). You can see logic there that does tbm_free()
> after the tbm_union() call. Going by that, it seems there is at least
> one place where we might free some work_mem memory before allocating
> another lot.

OK, then as a first approximation, we can assume that all nodes that
use work_mem, use it concurrently. This assumption seems to hold for
Hash Join and [Hash] Agg. PostgreSQL already considers the hash
operations "more important," in some sense, than other operators that
use work_mem -- this is why they get to multiply by
hash_mem_multiplier (defaulted to 2.0).

I think the above approximation answers Tomas's first concern. For
now, we can assume that the amount of work memory used by a query is
the sum of the individual work memories used by all of its operators.
(In the future, we can be more precise, for operators that free their
work memory as soon as they have no more rows to produce.)

Dividing backend_work_mem up and distributing it to the query's
operators would, I think, work something like the following, using a
two-phase algorithm:

1. Planner records the nbytes it estimated, for a given Path, on that
Path. However, it would continue to make its costing (and
partitioning, for parallel Hash Join) decisions, same as before, using
"work_mem [* hash_mem_multiplier]". (So "work_mem" behaves sort of
like a hint to the optimizer.)

2. At runtime, executor checks backend_work_mem. It sums up all the
nbytes fields from all the query's Paths, and compares to
backend_work_mem. And then it sets each node's work_mem field to some
fraction of the total backend_work_mem, based on nbytes and work_mem.

3. Each node then runs exactly as it does now, except instead of
checking the global work_mem [* hash_mem_multiplier] GUCs, it checks
its own work_mem field.

The "proportion" chosen in (2) should probably take into account
nbytes, work_mem, hash_mem_multiplier, etc. I think we'd want it to
overprovision work memory for nodes/paths with small nbytes, to
mitigate error in planner estimates.

James
Re: Add the ability to limit the amount of memory that can be allocated to backends.
On Sat, Dec 28, 2024 at 6:57 AM Tomas Vondra <tomas@vondra.me> wrote:
>
> On 12/28/24 13:36, Anton A. Melnikov wrote:
> >
> > ... In more details let me suggest
> > the following steps or parts:
> > 1) realize memory limitation for a separate backend independent from the
> > work_mem GUC;
> > 2) add workmem-like limit that would "adjust" the work_mem values used by
> > the optimize as Thomas suggested;
> > 3) add global limit for all backends.
> >
> > As for p.1 there is a patch that was originally suggested by my colleague
> > Maxim Orlov <orlovmg@gmail.com> and which i modified for the current
> > master.
> > This patch introduces the only max_backend_memory GUC that specifies
> > the maximum amount of memory that can be allocated to a backend.
> > ...
> > If the allocated memory size is exceeded, a standard "out of memory"
> > error will be issued.

Yes this seems like a reasonable plan. I would add that (2) might be
good enough to solve (1), without needing to emit an "out of memory"
error.

> Not sure a simple memory limit like in the patch (which just adds memory
> accounting + OOM after hitting the limit) can work as anything but a the
> last safety measure.

I agree -- since PG already has the ability to spill operators, I
think we can avoid using too much "working memory" without too much
coding effort.

Now, PG uses memory for things other than what's captured in "working
memory," so there is probably still some value in a (1) that kills the
query or backend.

> The first challenge I envision is that without any feedback (either to
> the planner or executor), it may break queries quite easily. It just
> takes the planner to add one more sort / hash join / materialize (which
> it can do arbitrarily, as it has no concept of the memory limit), and
> now the query can't run.

Yes -- the planner figures it can allocate another work_mem [*
hash_mem_multiplier] for any new sort / hash join / materialize. It
doesn't know about per-backend memory limits.

That's why (2) is so nice, because it tells the executor (but, to keep
things simple, not the planner) how much working memory it *actually*
has available. And then the executor will (try to) spill rather than
exceed that actual limit.

> And secondly, there are allocations that we don't restrict by work_mem,
> but this memory limit would include them, ofc.

I'm neutral on this subject. The example you gave, of BufFile arrays,
should be included in the working-memory calculation, but there will
always be other sources of memory unaccounted for... I'm neutral on
how to deal with these cases...

> That's a preexisting issue, of course. But wouldn't this simple limit
> make the situation worse? The query would likely complete OK (otherwise
> we'd get many more reports about OOM), but with the new limit it would
> probably fail with OOM.

If I understand your point, you're saying that killing a query due to
OOM is OK if the "OOM" is based on the amount of available *global*
memory going to 0, but you're not comfortable doing this when
*per-backend* memory goes to 0.

I think you're right. A per-backend limit is nice because it can be
distributed to individual operators as per-operator working memory,
because operators will just spill. But killing a query based on an
approximation of how much memory we have seems like an overreaction.

Thanks,
James
Re: Add the ability to limit the amount of memory that can be allocated to backends.
On Sat, Dec 28, 2024 at 10:26 AM Jeremy Schneider
<schneider@ardentperf.com> wrote:
>

Thanks for the feedback, Jeremy!

> While I don't have a detailed design in mind, I'd like to add a strong
> +1 on the general idea that work_mem is hard to effectively use because
> queries can vary so widely in how many nodes might need work memory.

That's my main concern with work_mem. Even if I am running a single
query at a time, on a single connection, I still run into the
limitations of the work_mem GUC if I try to run:

(a) a query with a single large Hash Join; vs.
(b) a query with, say, 10 Hash Joins, some of which are small and
others of which are large.

In (a), I want to set work_mem to the total amount of memory available
on the system. In (b), I *don't* want to set it to "(a) / 10", because
I want some Hash Joins to get more memory than others.

It's just really hard to distribute working memory intelligently,
using this GUC!

> I'd almost like to have two limits:
>
> First, a hard per-connection limit which could be set very high

> ...  If
> palloc detects that an allocation would take the total over the hard
> limit, then you just fail the palloc with an OOM. This protects
> postgres from a memory leak in a single backend OOM'ing the whole
> system and restarting the whole database; failing a single connection
> is better than failing all of them.

Yes, this seems fine to me. Per Tomas's comments in [1] ,the "OOM"
limit would probably have to be global.

> Second, a soft per-connection "total_connection_work_mem_target" which
> could be set lower. The planner can just look at the total number of
> nodes that it expects to allocate work memory, divide the target by
> this and then set the work_mem for that query.

I wouldn't even bother to inform the planner of the "actual" working
memory, because that adds complexity to the query compilation process.

Just: planner assumes it will have "work_mem" per node, but records
how much memory it estimates it will use ("nbytes") [2]. The executor
then sets the "actual" work_mem, for each node, based on nbytes and
the global "work_mem" GUC.

(It's hard for the planner to decide how much memory each path / node
should get, while building and costing plans. E.g., is it better to
take X MB of working memory from join 1 and hand it to join 2, which
would cause join 1 to spill Y% more data, but join 2 to spill Z%
less?)

> Maybe even could do a "total_instance_work_mem_target" where it's
> divided by the number of average active connections or something.

This seems fine to me, but I prefer "backend_work_mem_target", because
I find multiplying easier than dividing. (E.g., if I add 2 more
backends, I would use up to "backend_work_mem_target" * 2 more memory.
Vs., each query now gets "total_instance_work_mem_target / (N+2)"
memory...)

[1] https://www.postgresql.org/message-id/4806d917-c019-49c7-9182-1203129cd295%40vondra.me
[2] https://www.postgresql.org/message-id/CAJVSvF6i_1Em6VPZ9po5wyTubGwifvfNFLrOYrdgT-e1GmR5Fw%40mail.gmail.com

Thanks,
James
Re: Add the ability to limit the amount of memory that can be allocated to backends.
On Sat, Dec 28, 2024 at 11:24 PM Jim Nasby <jnasby@upgrade.com> wrote:
>
> IMHO none of this will be very sane until we actually have cluster-level limits. One sudden burst in active
connectionsand you still OOM the instance.

Fwiw, PG does support "max_connections" GUC, so a backend/connection -
level limit, times "max_connections", yields a cluster-level limit.

Now, which is easier for customers to understand -- that's up for debate!

James
Re: Add the ability to limit the amount of memory that can be allocated to backends.
On Mon, Dec 30, 2024 at 3:12 PM David Rowley <dgrowleyml@gmail.com> wrote:
>
> On Sat, 28 Dec 2024 at 08:14, James Hunter <james.hunter.pg@gmail.com> wrote:
> > 2. We use this backend_work_mem to "adjust" work_mem values used by
> > the executor. (I don't care about the optimizer right now -- optimizer
> > just does its best to predict what will happen at runtime.)
>
> While I do want to see improvements in this area, I think "don't care
> about the optimizer" is going to cause performance issues.  The
> problem is that the optimizer takes into account what work_mem is set
> to when calculating the costs of work_mem-consuming node types. See
> costsize.c for usages of "work_mem". If you go and reduce the amount
> of memory a given node can consume after the costs have been applied
> then we may end up in a situation where some other plan would have
> suited much better.

Yes, but this sort of thing is unavoidable in SQL compilers. We can
always generate and cost more paths, but that increases compile time,
which eats away at runtime.

I agree that it's good to mitigate these sorts of cases, but I see
that as a refinement on the original idea.

> There's also the problem with what to do when you chop work_mem down
> so far that the remaining size is just a pitiful chunk. For now,
> work_mem can't go below 64 kilobytes. You might think that's a very
> unlikely situation that it'd be chopped down so far, but with
> partition-wise join and partition-wise aggregate, we could end up
> using a work_mem per partition and if you have thousands of partitions
> then you might end up reducing work_mem by quite a large amount.

I look at this from the opposite direction: if I am doing a
partition-wise join or aggregate, and that join or aggregate requires
more memory than I feel comfortable letting it use, then the current
PG behavior doesn't solve this problem, so much as throw up its hands
and hope for the best. Because if I don't have 64 KB * (# joins) * (#
join partitions), today, then either my query is going to run OOM --
or I am lying, and I really have more memory than I claim. :)

> I think the best solution to this is the memory grant stuff I talked
> about in [1].

I am absolutely in favor of memory grants. Long-term, I think memory
grants, like what you described in [1], are absolutely necessary.
However, per-backend limits are:
(a) easier;
(b) a good intermediate step; and
(c) still necessary in a world in which we have memory grants, to
prevent deadlocks.

In [1], you suggested using PG's deadlock detector, but this has the
side effect of killing queries, which I would like to avoid.

Even with memory grants, if you give each backend a minimal amount of
reserved working-memory, you can avoid deadlock, by making the
"offending" spill and run slowly, rather than getting canceled.

> That does require figuring out which nodes will consume
> the work_mem concurrently so that infrastructure you talked about to
> do that would be a good step forward towards that, but that's probably
> not the most difficult part of that idea.

Yeah - for example, specifying work_mem per node, on the PlanState,
gives the executor some options, if it can't checkout as much memory
as it would like.

> I definitely encourage work in this area, but I think what you're
> proposing might be swapping one problem for another problem.
>
> David
>
> [1] https://www.postgresql.org/message-id/CAApHDvrzacGEA1ZRea2aio_LAi2fQcgoK74bZGfBddg4ymW-Ow@mail.gmail.com

Thanks for the feedback!
James
Re: Add the ability to limit the amount of memory that can be allocated to backends.
On Dec 30, 2024, at 7:05 PM, James Hunter <james.hunter.pg@gmail.com> wrote:
>
> On Sat, Dec 28, 2024 at 11:24 PM Jim Nasby <jnasby@upgrade.com> wrote:
>>
>> IMHO none of this will be very sane until we actually have cluster-level limits. One sudden burst in active
connectionsand you still OOM the instance.
>
> Fwiw, PG does support "max_connections" GUC, so a backend/connection -
> level limit, times "max_connections", yields a cluster-level limit.

max_connections is useless here, for two reasons:

1. Changing it requires a restart. That’s at *best* a real PITA in production. [1]
2. It still doesn’t solve the actual problem. Unless your workload *and* your data are extremely homogeneous you can’t
simplylimit the number of connections and call it a day. A slight change in incoming queries, OR in the data that the
queriesare looking at and you go from running fine to meltdown. You don’t even need a plan flip for this to happen,
justthe same plan run at the same rate but now accessing more data than before.

Most of what I’ve seen on this thread is discussing ways to *optimize* how much memory the set of running backends can
consume.Adjusting how you slice the memory pie across backends, or even within a single backend, is optimization. While
that’sa great goal that I do support, it will never fully fix the problem. At some point you need to either throw your
handsin the air and start tossing memory errors, because you don’t have control over how much work is being thrown at
theengine. The only way that the engine can exert control over that would be to hold new transactions from starting
whenthe system is under duress (ie, workload management). While workload managers can be quite sophisticated (aka,
complex),the nice thing about limiting this scope to work_mem, and only as a means to prevent complete overload, is
thatthe problem becomes a lot simpler since you’re only looking at one metric and not trying to support any kind of
prioritysystem. The only fanciness I think an MVP would need is a GUC to control how long a transaction can sit waiting
beforeit throws an error. Frankly, that sounds a lot less complex and much easier for DBAs to adjust than trying to
teachthe planner how to apportion out per-node work_mem limits.

As I said, I’m not opposed to optimizations, I just think they’re very much cart-before-the-horse.

1: While it’d be a lot of work to make max_connections dynamic one thing we could do fairly easily would be to
introduceanother GUC (max_backends?) that actually controls the total number of allowed backends for everything. The
sumof max_backends + autovac workers + background workers + whatever else I’m forgetting would have to be less than
that.The idea here is that you’d normally run with max_connections set significantly lower than max_backends. That
meansthat if you need to adjust any of these GUCs (other than max_backends) you don’t need to restart - the new limits
wouldjust apply to new connection requests.
Re: Add the ability to limit the amount of memory that can be allocated to backends.
On 12/31/24 21:46, Jim Nasby wrote:
> On Dec 30, 2024, at 7:05 PM, James Hunter <james.hunter.pg@gmail.com> wrote:
>>
>> On Sat, Dec 28, 2024 at 11:24 PM Jim Nasby <jnasby@upgrade.com> wrote:
>>>
>>> IMHO none of this will be very sane until we actually have cluster-level limits. One sudden burst in active
connectionsand you still OOM the instance.
>>
>> Fwiw, PG does support "max_connections" GUC, so a backend/connection -
>> level limit, times "max_connections", yields a cluster-level limit.
>
> max_connections is useless here, for two reasons:
>
> 1. Changing it requires a restart. That’s at *best* a real PITA in production. [1]
> 2. It still doesn’t solve the actual problem. Unless your workload *and* your data are extremely homogeneous you
can’tsimply limit the number of connections and call it a day. A slight change in incoming queries, OR in the data that
thequeries are looking at and you go from running fine to meltdown. You don’t even need a plan flip for this to happen,
justthe same plan run at the same rate but now accessing more data than before.
>

I really don't follow your argument ...

Yes, changing max_connections requires a restart - so what? AFAIK the
point James was making is that if you multiply max_connections by the
per-backend limit, you get a cluster-wide limit. And presumably the
per-backend limit would be a GUC not requiring a restart.

Yes, high values of max_connections are problematic. I don't see how a
global limit would fundamentally change that. In fact, it could
introduce yet more weird failures because some unrelated backend did
something weird.

FWIW I'm not opposed to having some global memory limit, but as I
explained earlier, I don't see a way to do that sensibly without having
a per-backend limit first. Because if you have a global limit, a single
backend consuming memory could cause all kinds of weird failures in
random other backends.

> Most of what I’ve seen on this thread is discussing ways to *optimize* how much memory the set of running backends
canconsume. Adjusting how you slice the memory pie across backends, or even within a single backend, is optimization.
Whilethat’s a great goal that I do support, it will never fully fix the problem. At some point you need to either throw
yourhands in the air and start tossing memory errors, because you don’t have control over how much work is being thrown
atthe engine. The only way that the engine can exert control over that would be to hold new transactions from starting
whenthe system is under duress (ie, workload management). While workload managers can be quite sophisticated (aka,
complex),the nice thing about limiting this scope to work_mem, and only as a means to prevent complete overload, is
thatthe problem becomes a lot simpler since you’re only looking at one metric and not trying to support any kind of
prioritysystem. The only fanciness I think an MVP would need is a GUC to control how long a transaction can sit waiting
beforeit throws an error. Frankly, that sounds a lot less complex and much easier for DBAs to adjust than trying to
teachthe planner how to apportion out per-node work_mem limits.
>
> As I said, I’m not opposed to optimizations, I just think they’re very much cart-before-the-horse.
>

What optimization? I didn't notice anything like that. I don't see how
"adjusting how you slice the memory pie across backends" counts as an
optimization. I mean, that's exactly what a memory limit is meant to do.

Similarly, there was a proposal to do planning with work_mem, and then
go back and adjust the per-node limits to impose a global limit. That
does not seem like an optimization either ... (more an opposite of it).

> 1: While it’d be a lot of work to make max_connections dynamic one thing we could do fairly easily would be to
introduceanother GUC (max_backends?) that actually controls the total number of allowed backends for everything. The
sumof max_backends + autovac workers + background workers + whatever else I’m forgetting would have to be less than
that.The idea here is that you’d normally run with max_connections set significantly lower than max_backends. That
meansthat if you need to adjust any of these GUCs (other than max_backends) you don’t need to restart - the new limits
wouldjust apply to new connection requests.

I don't quite understad how max_backends helps with anything except
allowing to change the limit of connections without a restart, or why
would it be needed for introducing a memory limit. To me those seem very
much like two separate features.

regards

--
Tomas Vondra
Re: Add the ability to limit the amount of memory that can be allocated to backends.
On Dec 31, 2024, at 5:41 PM, Tomas Vondra <tomas@vondra.me> wrote:On 12/31/24 21:46, Jim Nasby wrote:On Dec 30, 2024, at 7:05 PM, James Hunter <james.hunter.pg@gmail.com> wrote:
On Sat, Dec 28, 2024 at 11:24 PM Jim Nasby <jnasby@upgrade.com> wrote:
IMHO none of this will be very sane until we actually have cluster-level limits. One sudden burst in active connections and you still OOM the instance.
Fwiw, PG does support "max_connections" GUC, so a backend/connection -
level limit, times "max_connections", yields a cluster-level limit.
max_connections is useless here, for two reasons:
1. Changing it requires a restart. That’s at *best* a real PITA in production. [1]
2. It still doesn’t solve the actual problem. Unless your workload *and* your data are extremely homogeneous you can’t simply limit the number of connections and call it a day. A slight change in incoming queries, OR in the data that the queries are looking at and you go from running fine to meltdown. You don’t even need a plan flip for this to happen, just the same plan run at the same rate but now accessing more data than before.
I really don't follow your argument ...
Yes, changing max_connections requires a restart - so what? AFAIK the
point James was making is that if you multiply max_connections by the
per-backend limit, you get a cluster-wide limit. And presumably the
per-backend limit would be a GUC not requiring a restart.
Yes, high values of max_connections are problematic. I don't see how a
global limit would fundamentally change that. In fact, it could
introduce yet more weird failures because some unrelated backend did
something weird.
FWIW I'm not opposed to having some global memory limit, but as I
explained earlier, I don't see a way to do that sensibly without having
a per-backend limit first. Because if you have a global limit, a single
backend consuming memory could cause all kinds of weird failures in
random other backends.
Most of what I’ve seen on this thread is discussing ways to *optimize* how much memory the set of running backends can consume. Adjusting how you slice the memory pie across backends, or even within a single backend, is optimization. While that’s a great goal that I do support, it will never fully fix the problem. At some point you need to either throw your hands in the air and start tossing memory errors, because you don’t have control over how much work is being thrown at the engine. The only way that the engine can exert control over that would be to hold new transactions from starting when the system is under duress (ie, workload management). While workload managers can be quite sophisticated (aka, complex), the nice thing about limiting this scope to work_mem, and only as a means to prevent complete overload, is that the problem becomes a lot simpler since you’re only looking at one metric and not trying to support any kind of priority system. The only fanciness I think an MVP would need is a GUC to control how long a transaction can sit waiting before it throws an error. Frankly, that sounds a lot less complex and much easier for DBAs to adjust than trying to teach the planner how to apportion out per-node work_mem limits.
As I said, I’m not opposed to optimizations, I just think they’re very much cart-before-the-horse.
What optimization? I didn't notice anything like that. I don't see how
"adjusting how you slice the memory pie across backends" counts as an
optimization. I mean, that's exactly what a memory limit is meant to do.
Similarly, there was a proposal to do planning with work_mem, and then
go back and adjust the per-node limits to impose a global limit. That
does not seem like an optimization either ... (more an opposite of it).
1: While it’d be a lot of work to make max_connections dynamic one thing we could do fairly easily would be to introduce another GUC (max_backends?) that actually controls the total number of allowed backends for everything. The sum of max_backends + autovac workers + background workers + whatever else I’m forgetting would have to be less than that. The idea here is that you’d normally run with max_connections set significantly lower than max_backends. That means that if you need to adjust any of these GUCs (other than max_backends) you don’t need to restart - the new limits would just apply to new connection requests.
I don't quite understad how max_backends helps with anything except
allowing to change the limit of connections without a restart, or why
would it be needed for introducing a memory limit. To me those seem very
much like two separate features.
Re: Add the ability to limit the amount of memory that can be allocated to backends.
On 1/2/25 22:09, Jim Nasby wrote:
>
>> On Dec 31, 2024, at 5:41 PM, Tomas Vondra <tomas@vondra.me> wrote:
>>
>> On 12/31/24 21:46, Jim Nasby wrote:
>>> On Dec 30, 2024, at 7:05 PM, James Hunter <james.hunter.pg@gmail.com>
>>> wrote:
>>>>
>>>> On Sat, Dec 28, 2024 at 11:24 PM Jim Nasby <jnasby@upgrade.com> wrote:
>>>>>
>>>>> IMHO none of this will be very sane until we actually have cluster-
>>>>> level limits. One sudden burst in active connections and you still
>>>>> OOM the instance.
>>>>
>>>> Fwiw, PG does support "max_connections" GUC, so a backend/connection -
>>>> level limit, times "max_connections", yields a cluster-level limit.
>>>
>>> max_connections is useless here, for two reasons:
>>>
>>> 1. Changing it requires a restart. That’s at *best* a real PITA in
>>> production. [1]
>>> 2. It still doesn’t solve the actual problem. Unless your workload
>>> *and* your data are extremely homogeneous you can’t simply limit the
>>> number of connections and call it a day. A slight change in incoming
>>> queries, OR in the data that the queries are looking at and you go
>>> from running fine to meltdown. You don’t even need a plan flip for
>>> this to happen, just the same plan run at the same rate but now
>>> accessing more data than before.
>>>
>>
>> I really don't follow your argument ...
>>
>> Yes, changing max_connections requires a restart - so what? AFAIK the
>> point James was making is that if you multiply max_connections by the
>> per-backend limit, you get a cluster-wide limit. And presumably the
>> per-backend limit would be a GUC not requiring a restart.
>>
>> Yes, high values of max_connections are problematic. I don't see how a
>> global limit would fundamentally change that. In fact, it could
>> introduce yet more weird failures because some unrelated backend did
>> something weird.
>
> That’s basically my argument for having workload management. If a system
> becomes loaded enough for the global limit to start kicking in it’s
> likely that query response time is increasing, which means you will soon
> have more and more active backends trying to run queries. That’s just
> going to make the situation even worse. You’d either have to start
> trying to “take memory away” from already running backends or backends
> that are just starting would have such a low limit as to cause them to
> spill very quickly, creating further load on the system.
>

I'm not opposed to having a some sort of "workload management" (similar
to what's available in some databases), but my guess is that's (at
least) an order of magnitude more complex than introducing the memory
limit discussed here. I can only guess, because no one really explained
what would it include, how would it be implemented. Which makes it easy
to dream about a solution that would fix the problem ...

What I'm afraid will happen everyone mostly agrees a comprehensive
workload management system would be better than a memory limit (be it
per-backend or a global one). But without a workable proposal how to
implement it no one ends up working on it. And no one gets to work on a
memory limit because the imagined workload management would be better.
So we get nothing ...

FWIW I have a hard time imagining a workload management system without
some sort of a memory limit.

>> FWIW I'm not opposed to having some global memory limit, but as I
>> explained earlier, I don't see a way to do that sensibly without having
>> a per-backend limit first. Because if you have a global limit, a single
>> backend consuming memory could cause all kinds of weird failures in
>> random other backends.
>
> I agree, but I’m also not sure how much a per-backend limit would
> actually help on its own, especially in OLTP environments.
>

So what if it doesn't help in every possible case? It'd be valuable even
for OLAP/mixed workloads with sensible max_connection values, because
it'd allow setting the work_mem more aggressively.

>>> Most of what I’ve seen on this thread is discussing ways to
>>> *optimize* how much memory the set of running backends can consume.
>>> Adjusting how you slice the memory pie across backends, or even
>>> within a single backend, is optimization. While that’s a great goal
>>> that I do support, it will never fully fix the problem. At some point
>>> you need to either throw your hands in the air and start tossing
>>> memory errors, because you don’t have control over how much work is
>>> being thrown at the engine. The only way that the engine can exert
>>> control over that would be to hold new transactions from starting
>>> when the system is under duress (ie, workload management). While
>>> workload managers can be quite sophisticated (aka, complex), the nice
>>> thing about limiting this scope to work_mem, and only as a means to
>>> prevent complete overload, is that the problem becomes a lot simpler
>>> since you’re only looking at one metric and not trying to support any
>>> kind of priority system. The only fanciness I think an MVP would need
>>> is a GUC to control how long a transaction can sit waiting before it
>>> throws an error. Frankly, that sounds a lot less complex and much
>>> easier for DBAs to adjust than trying to teach the planner how to
>>> apportion out per-node work_mem limits.
>>>
>>> As I said, I’m not opposed to optimizations, I just think they’re
>>> very much cart-before-the-horse.
>>>
>>
>> What optimization? I didn't notice anything like that. I don't see how
>> "adjusting how you slice the memory pie across backends" counts as an
>> optimization. I mean, that's exactly what a memory limit is meant to do.
>>
>> Similarly, there was a proposal to do planning with work_mem, and then
>> go back and adjust the per-node limits to impose a global limit. That
>> does not seem like an optimization either ... (more an opposite of it).
>
> It’s optimization in that you’re trying to increase how many active
> backends you can have before getting memory errors. It’s an alternative
> to throwing more memory at the problem or limiting the rate of incoming
> workload.
>

I don't see it that way. I see it as a "safety measure" for queries that
happen to be more complex than expected, or something. Yes, it may allow
you to use a higher max_connections, or higher work_mem. But it's still
just a safety measure.

>>> 1: While it’d be a lot of work to make max_connections dynamic one
>>> thing we could do fairly easily would be to introduce another GUC
>>> (max_backends?) that actually controls the total number of allowed
>>> backends for everything. The sum of max_backends + autovac workers +
>>> background workers + whatever else I’m forgetting would have to be
>>> less than that. The idea here is that you’d normally run with
>>> max_connections set significantly lower than max_backends. That means
>>> that if you need to adjust any of these GUCs (other than
>>> max_backends) you don’t need to restart - the new limits would just
>>> apply to new connection requests.
>>
>> I don't quite understad how max_backends helps with anything except
>> allowing to change the limit of connections without a restart, or why
>> would it be needed for introducing a memory limit. To me those seem very
>> much like two separate features.
>
> It’s related to this because the number of active backends is directly
> related to memory consumption. Yet because max_connections requires a
> restart it’s very hard to actually manage how many active backends you
> have. Your only option is a single-point connection pool, but that
> introduces its own problems.
>

I think you need to choose. Either problems with many active backends,
or problems with connection pools ...

> That said, I do think a workload manager would be more effective than
> trying to limit total connections.

The "workload management" concept is so abstract I find it very
difficult to discuss without much more detail about how would it
actually work / be implemented.

I believe implementing some rudimentary "global" memory accounting would
not be *that* hard (possibly along the lines of the patches early in
this thread), and adding some sort of dynamic connection limit would not
be much harder I think. But then comes the hard part of actually doing
the "workload management" part, which seems pretty comparable to what a
QoS / scheduler needs to do. With all the weird corner cases.


regards

--
Tomas Vondra
Re: Add the ability to limit the amount of memory that can be allocated to backends.
I think this discussion is getting away from a manageable scope of work...

On Thu, Jan 2, 2025 at 1:09 PM Jim Nasby <jnasby@upgrade.com> wrote:

> That’s basically my argument for having workload management. If a system becomes loaded enough for the global limit
tostart kicking in it’s likely that query response time is increasing, which means you will soon have more and more
activebackends trying to run queries. That’s just going to make the situation even worse. You’d either have to start
tryingto “take memory away” from already running backends or backends that are just starting would have such a low
limitas to cause them to spill very quickly, creating further load on the system.

I think this is backward. There's a fixed number of backends, limited
by "max_connections." A given backend becoming slow to respond doesn't
increase this limit. The load on the system is limited by
"max_connections." This makes the system stable.

If, instead, the system starts cancelling queries, then a naive client
will typically just retry the query. If the reason the query was
cancelled is that the system is overloaded, then the query is likely
to be cancelled again, leading to a retry storm, even though the
number of backends is limited by "max_connections," since a given
backend will be repeatedly cancelled.

Long-term, the solution to, "I don't have enough resources to run my
workload efficiency," is either:

* Buy more resources; or
* Reduce your workload.

We can't help with either of those solutions!

However, the (short-term) problem I'd like to solve is: how do we
expose efficient use of resources, in those cases where we *do* have
enough resources to run a workload efficiently, but the existing
"work_mem" and "hash_mem_multiplier" GUCs are insufficient?

Thanks,
James
Re: Add the ability to limit the amount of memory that can be allocated to backends.
On Thu, Jan 2, 2025 at 7:21 PM Tomas Vondra <tomas@vondra.me> wrote:
>
> I'm not opposed to having a some sort of "workload management" (similar
> to what's available in some databases), but my guess is that's (at
> least) an order of magnitude more complex than introducing the memory
> limit discussed here. I can only guess, because no one really explained
> what would it include, how would it be implemented. Which makes it easy
> to dream about a solution that would fix the problem ...

I agree -- anyway, I will try to start a new thread sometime next
week, with a more concrete proposal. (I wanted to get general feedback
first, and I got a lot of it -- thanks!)

> What I'm afraid will happen everyone mostly agrees a comprehensive
> workload management system would be better than a memory limit (be it
> per-backend or a global one). But without a workable proposal how to
> implement it no one ends up working on it. And no one gets to work on a
> memory limit because the imagined workload management would be better.
> So we get nothing ...

That seems to be where this thread is heading...

> FWIW I have a hard time imagining a workload management system without
> some sort of a memory limit.

Yes, and more strongly; you can't create a system to manage resources,
unless you first have some way of managing those resources. Today, I
can't say: query X gets 50 MB of RAM, while query Y gets 200 MB of
RAM, even if I wanted to -- at least, not in any useful way that
doesn't involve waiting for the query to exceed its (hidden!) memory
limit, and then killing it.

Before we can discuss how much memory queries X and Y should get, and
whether X can steal memory for Y, etc. -- we need a way to force X and
Y to respect the memory limits we impose! Otherwise, we always end up
back at: I have a secret memory limit for X, and if X exceeds that
memory limit, I'll kill X. I think there's been some rationalization
that "just kill X" is a reasonable response, but I think it really
isn't. Any workload management system whose only available tool is
killing queries is going to be incredibly sensitive / unstable.

It would be better if, when someone -- either workload management, or
a GUC -- decides that query X gets 50 MB of memory, we informed query
X of this limit, and let the query do its best to stay within it. (Yes
it makes sense to have the option to "kill -9", but there's a reason
we have other signals as well...)

The good news is, PostgreSQL operators already try to stay within
work_mem [* hash_mem_multiplier], so the problem of how to get query X
to stay within 50 MB of RAM breaks down into splitting that 50 MB into
per-operator "work_mem" limits, which is (as you point out!) at least
an order of magnitude easier than a general workload management
solution. Once we have per-operator "work_mem" limits, existing
PostgreSQL logic takes care of the rest.

Thanks,
James
Re: Add the ability to limit the amount of memory that can be allocated to backends.
That said, I do think a workload manager would be more effective than
trying to limit total connections.
The "workload management" concept is so abstract I find it very
difficult to discuss without much more detail about how would it
actually work / be implemented.
I believe implementing some rudimentary "global" memory accounting would
not be *that* hard (possibly along the lines of the patches early in
this thread), and adding some sort of dynamic connection limit would not
be much harder I think. But then comes the hard part of actually doing
the "workload management" part, which seems pretty comparable to what a
QoS / scheduler needs to do. With all the weird corner cases.
Re: Add the ability to limit the amount of memory that can be allocated to backends.
On 1/6/25 22:07, Jim Nasby wrote:
> On Jan 2, 2025, at 9:21 PM, Tomas Vondra <tomas@vondra.me> wrote:
>>
>>> That said, I do think a workload manager would be more effective than
>>> trying to limit total connections.
>>
>> The "workload management" concept is so abstract I find it very
>> difficult to discuss without much more detail about how would it
>> actually work / be implemented.
>>
>> I believe implementing some rudimentary "global" memory accounting would
>> not be *that* hard (possibly along the lines of the patches early in
>> this thread), and adding some sort of dynamic connection limit would not
>> be much harder I think. But then comes the hard part of actually doing
>> the "workload management" part, which seems pretty comparable to what a
>> QoS / scheduler needs to do. With all the weird corner cases.
>
> I’ve been saying “workload management” for lack of a better term, but my
> initial suggestion upthread was to simply stop allowing new transactions
> to start if global work_mem consumption exceeded some threshold. That’s
> simplistic enough that I wouldn’t really consider it “workload
> management”. Maybe “deferred execution” would be a better name. The only
> other thing it’d need is a timeout on how long a new transaction could
> sit in limbo.
>

How would that not be a huge DoS vector? If a low-priority task can
allocate a chunk of memory, and block/delay execution of everything
else, that seems potentially disastrous.

I believe there is a reason why workload management systems tend to be
fairly complex systems, both to implement and manage, requiring stuff
like resource pools, workload classes, etc.

> I agree that no matter what everything being proposed would rely on
> having metrics on actual work_mem consumption. That would definitely be
> a good feature on its own. I’m thinking adding “work_mem_bytes” and
> “work_mem_operations” to pg_stat_activity (where “work_mem_operations”
> would tell you how many different things were using work_mem in the backend.
>
> Incidentally, something related to this that I’ve seen is backend memory
> consumption slowly growing over time. Unbounded growth of relcache and
> friends was presumably the biggest contributor. There’s an argument to
> be made for a view dedicated to tracking per-backend memory stats, with
> additional info about things contributing to idle memory consumption.

True, but I don't quite see how would a global memory limit help with
any of that. In fact, relcache seems exactly like the thing to limit at
the backend level.

regards

--
Tomas Vondra
Re: Add the ability to limit the amount of memory that can be allocated to backends.
On Mon, Jan 6, 2025 at 1:07 PM Jim Nasby <jnasby@upgrade.com> wrote:
>
> I’ve been saying “workload management” for lack of a better term, but my initial suggestion upthread was to simply
stopallowing new transactions to start if global work_mem consumption exceeded some threshold. That’s simplistic enough
thatI wouldn’t really consider it “workload management”. Maybe “deferred execution” would be a better name. The only
otherthing it’d need is a timeout on how long a new transaction could sit in limbo.

Yes, this seems like a good thing to do, but we need to handle
"work_mem" , by itself, first.

The problem is that it's just too easy for a query to blow up work_mem
consumption, almost instantaneously. By the time we notice that we're
low on working memory, pausing new transactions may not be sufficient.
We could already be in the middle of a giant Hash Join, for example,
and the hash table is just going to continue to grow...

Before we can solve the problem you describe, we need to be able to
limit the work_mem consumption by an in-progress query.

James