Thread: weird issue with occasional stuck queries
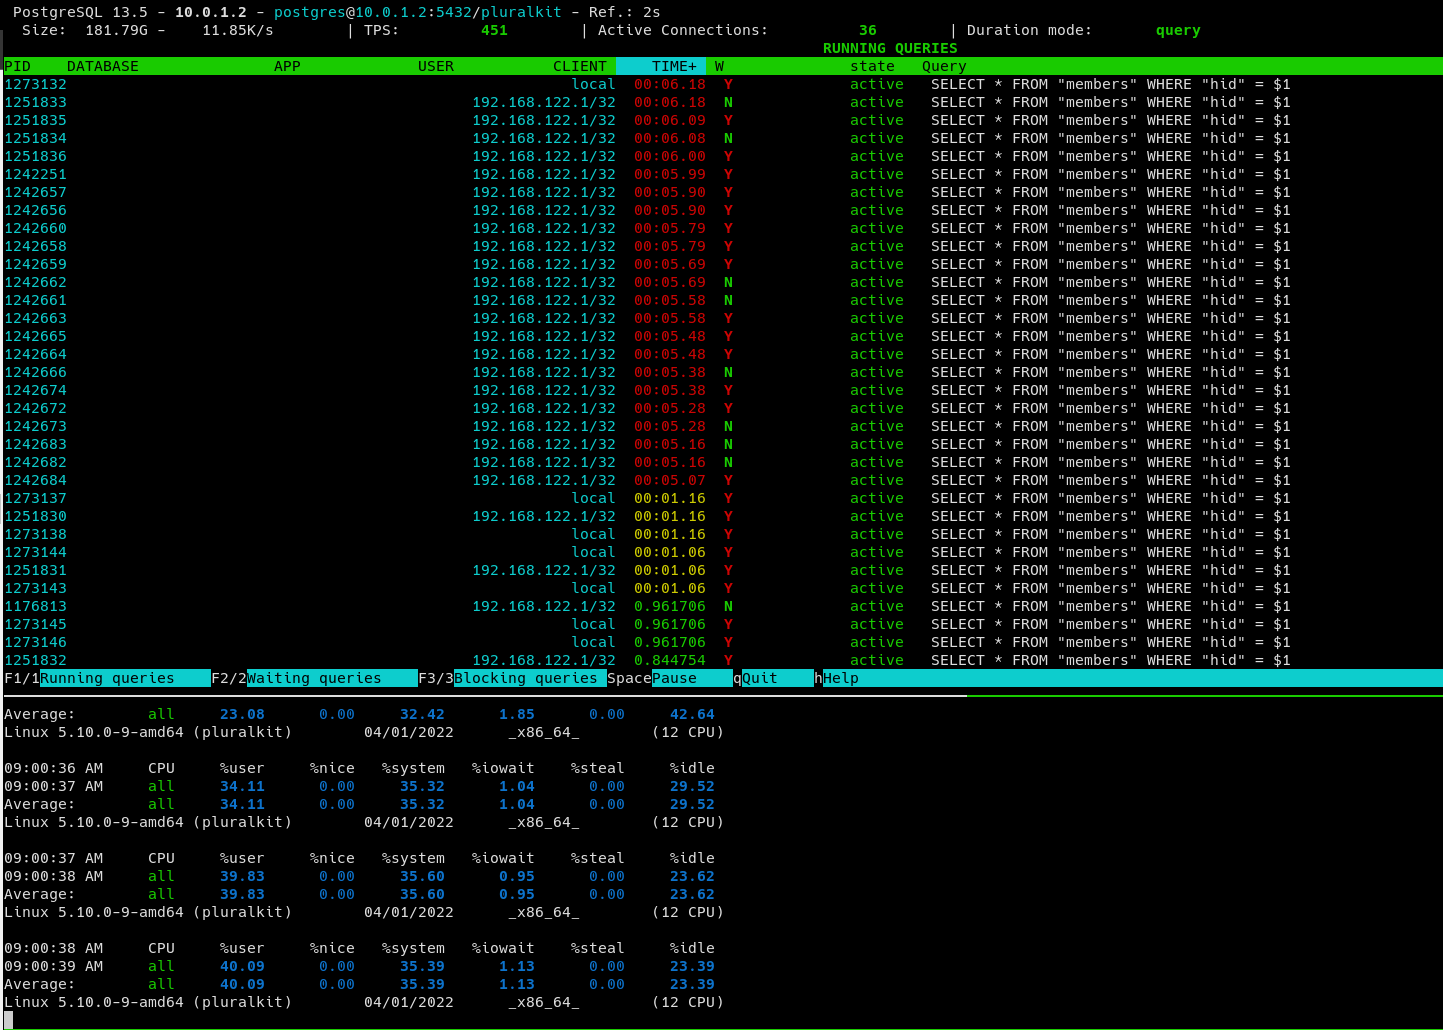
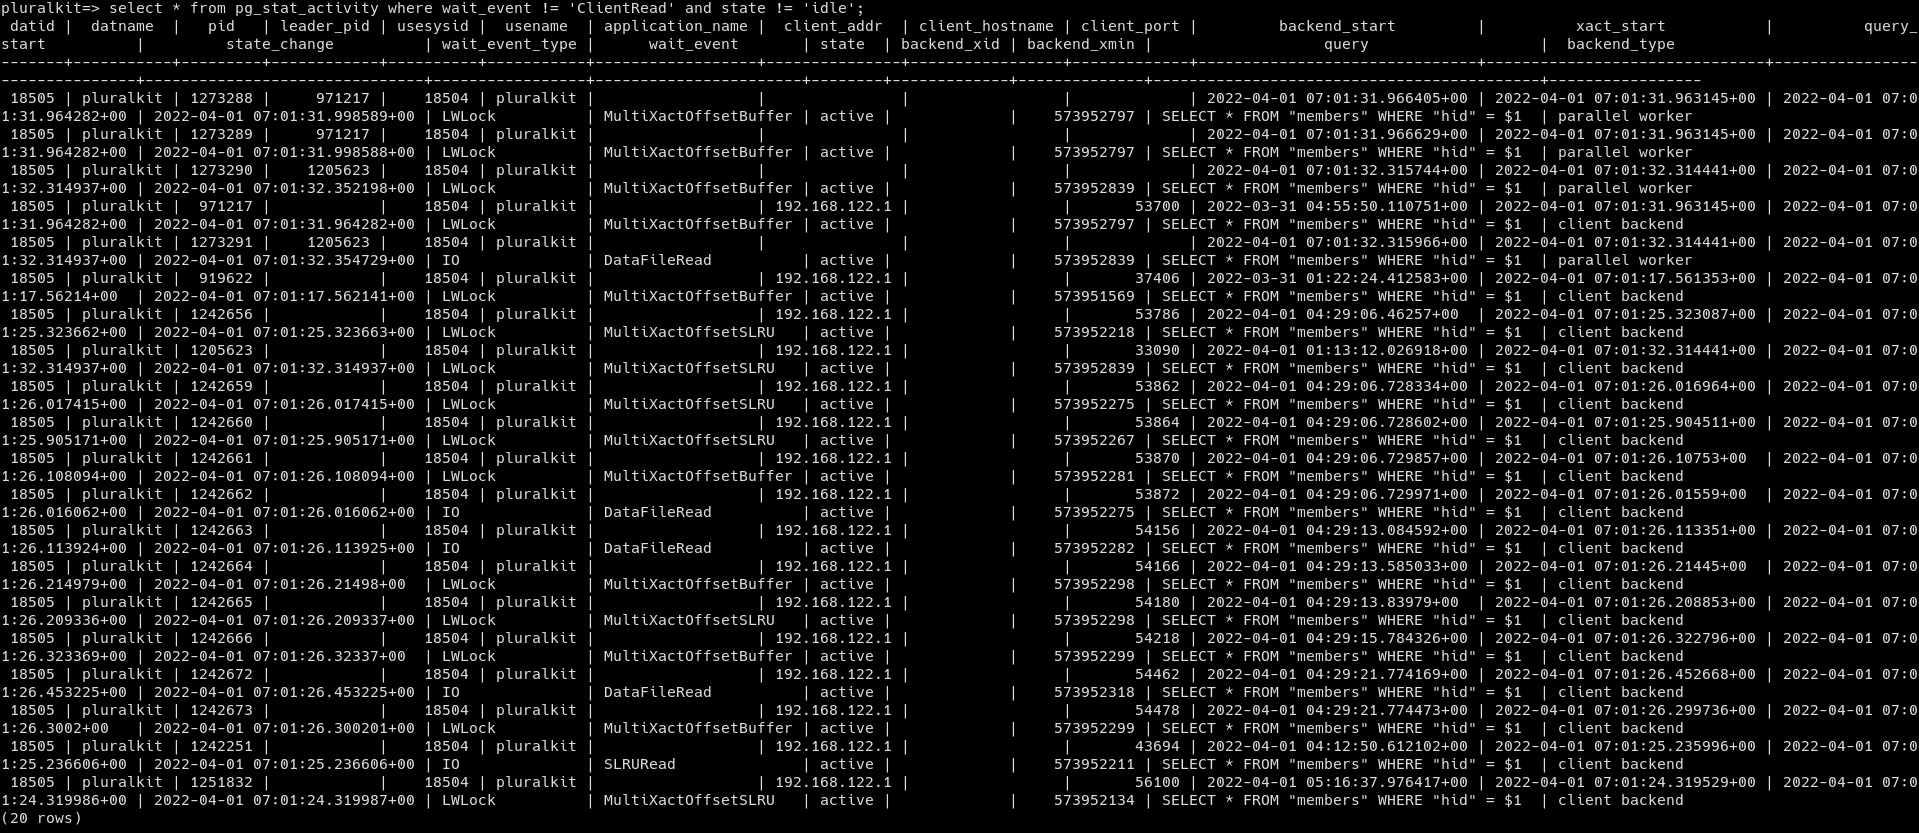
Hey,

I'm having a weird issue where a few times a day, any query that hits a
specific index (specifically a `unique` column index) gets stuck for
anywhere between 1 and 15 minutes on a LWLock (mostly
MultiXactOffsetSLRU - not sure what that is, I couldn't find anything
about it except for a pgsql-hackers list thread that I didn't really
understand).
Checking netdata history, these stuck queries coincide with massive
disk read; we average ~2MiB/s disk read and it got to 40MiB/s earlier
today.

These queries used to get stuck for ~15 minutes at worst, but I turned
down the query timeout. I assume the numbers above would be worse if I
let the queries run for as long as they need, but I don't have any logs
from before that change and I don't really want to try that again as it
would impact production.

I asked on the IRC a few days ago and got the suggestion to increase
shared_buffers, but that doesn't seem to have helped at all. I also
tried deleting and recreating the index, but that seems to have changed
nothing as well.

Any suggestions are appreciated since I'm really not sure how to debug
this further. I'm also attaching a couple screenshots that might be
useful.

spiral
Attachment
If you get a chance, showing the `top` output might be useful as well. For instance if you are low on memory, it can slow down the allocation of buffers. Another thing to look at is `iostat -x -y` and look at disk util %. This is an indicator, but not definitive, of how much disk access is going on. It may be your drives are just saturated although your IOWait looks ok in your attachment.
That wait event according to documentation is "Waiting to access the multixact member SLRU cache." SLRU = segmented least recently used cache
Do you have a query that is a "select for update" running somewhere?
If your disk is low on space `df -h` that might explain the issue.
Is there an ERROR: multixact something in your postgres log?
Adam
On Fri, Apr 1, 2022 at 6:28 AM spiral <spiral@spiral.sh> wrote:
Hey,
I'm having a weird issue where a few times a day, any query that hits a
specific index (specifically a `unique` column index) gets stuck for
anywhere between 1 and 15 minutes on a LWLock (mostly
MultiXactOffsetSLRU - not sure what that is, I couldn't find anything
about it except for a pgsql-hackers list thread that I didn't really
understand).
Checking netdata history, these stuck queries coincide with massive
disk read; we average ~2MiB/s disk read and it got to 40MiB/s earlier
today.
These queries used to get stuck for ~15 minutes at worst, but I turned
down the query timeout. I assume the numbers above would be worse if I
let the queries run for as long as they need, but I don't have any logs
from before that change and I don't really want to try that again as it
would impact production.
I asked on the IRC a few days ago and got the suggestion to increase
shared_buffers, but that doesn't seem to have helped at all. I also
tried deleting and recreating the index, but that seems to have changed
nothing as well.
Any suggestions are appreciated since I'm really not sure how to debug
this further. I'm also attaching a couple screenshots that might be
useful.
spiral
Hey,

> That wait event according to documentation is "Waiting to access the
> multixact member SLRU cache."  SLRU = segmented least recently used
> cache

I see, thanks!

> if you are low on memory, it can slow down the allocation of
> buffers. Do you have a query that is a "select for update" running
> somewhere? If your disk is low on space `df -h` that might explain
> the issue.

- There aren't any queries that are running for longer than the selects
shown earlier; definitely not "select for update" since I don't ever
use that in my code.
- Both disk and RAM utilization is relatively low.

> Is there an ERROR: multixact  something in your postgres log?

There isn't, but while checking I saw some other concerning errors
including "deadlock detected", "could not map dynamic shared memory
segment" and "could not attach to dynamic shared area".
(full logs here: https://paste.sr.ht/blob/9ced99b119c3fce1ecfd71e8554946e7845a44dd )

> Another thing to look at is `iostat -x -y` and look at disk util %.
> This is an indicator, but not definitive, of how much disk access is
> going on.  It may be your drives are just saturated although your
> IOWait looks ok in your attachment.

I didn't specifically look at that, but I did notice *very* high disk
utilization in at least one instance of the stuck queries, as I
mentioned previously. Why would the disks be getting saturated? The
query count isn't noticeably higher than average, and the database
is not autovacuuming, so not sure what could cause that.

spiral
The logs were helpful. You may want to see the statements around the errors, as more detail may be there such as the SQL statement associated with the error.
Deadlocks are an indicator that the client code needs to be examined for improvement. See https://www.cybertec-postgresql.com/en/postgresql-understanding-deadlocks/ about deadlocks. They will slow things down and could cause a queue of SQL statements eventually bogging down the system.
It definitely looks like locking issues which is why you don't see high CPU. IIRC you might see high system CPU usage, as opposed to userspace CPU, where the kernel is getting overloaded. The `top` command will help to show that.
The disks could be saturated by the write ahead log (WAL) handling of all the transactions. More about WAL here: https://www.postgresql.org/docs/10/wal-internals.html You could consider moving that directory somewhere else using a symbolic link (conf. the link)
Anyway, these are the things I would look at.
Adam
On Sat, Apr 2, 2022 at 5:23 AM spiral <spiral@spiral.sh> wrote:
Hey,
> That wait event according to documentation is "Waiting to access the
> multixact member SLRU cache." SLRU = segmented least recently used
> cache
I see, thanks!
> if you are low on memory, it can slow down the allocation of
> buffers. Do you have a query that is a "select for update" running
> somewhere? If your disk is low on space `df -h` that might explain
> the issue.
- There aren't any queries that are running for longer than the selects
shown earlier; definitely not "select for update" since I don't ever
use that in my code.
- Both disk and RAM utilization is relatively low.
> Is there an ERROR: multixact something in your postgres log?
There isn't, but while checking I saw some other concerning errors
including "deadlock detected", "could not map dynamic shared memory
segment" and "could not attach to dynamic shared area".
(full logs here: https://paste.sr.ht/blob/9ced99b119c3fce1ecfd71e8554946e7845a44dd )
> Another thing to look at is `iostat -x -y` and look at disk util %.
> This is an indicator, but not definitive, of how much disk access is
> going on. It may be your drives are just saturated although your
> IOWait looks ok in your attachment.
I didn't specifically look at that, but I did notice *very* high disk
utilization in at least one instance of the stuck queries, as I
mentioned previously. Why would the disks be getting saturated? The
query count isn't noticeably higher than average, and the database
is not autovacuuming, so not sure what could cause that.
spiral
I would look at optimizing the query to increase performance. SELECT *
has room for improvement.

Also check out the book Mastering PostgreSQL 11 (or whatever version).
There are some good tips in there like using EXPLAIN to analyze the
query plan.

Looking at/setting max_parallel_workers_per_gather might be of
interest. You can turn off parallelism as well as increase the number
of workers. I have no idea if that will help you but I found it useful.

Also walk through the server settings to optimize the performance like
work_mem, shared_buffers, etc. If you haven't gone through all that yet
understanding each one and setting it correctly is important to get the
best out of your machine. It takes time but with many options comes
great power.


-----Original Message-----
From: spiral <spiral@spiral.sh>
To: pgsql-general@postgresql.org
Subject: weird issue with occasional stuck queries
Date: Fri, 1 Apr 2022 03:06:46 -0400

Hey,

I'm having a weird issue where a few times a day, any query that hits a
specific index (specifically a `unique` column index) gets stuck for
anywhere between 1 and 15 minutes on a LWLock (mostly
MultiXactOffsetSLRU - not sure what that is, I couldn't find anything
about it except for a pgsql-hackers list thread that I didn't really
understand).
Checking netdata history, these stuck queries coincide with massive
disk read; we average ~2MiB/s disk read and it got to 40MiB/s earlier
today.

These queries used to get stuck for ~15 minutes at worst, but I turned
down the query timeout. I assume the numbers above would be worse if I
let the queries run for as long as they need, but I don't have any logs
from before that change and I don't really want to try that again as it
would impact production.

I asked on the IRC a few days ago and got the suggestion to increase
shared_buffers, but that doesn't seem to have helped at all. I also
tried deleting and recreating the index, but that seems to have changed
nothing as well.

Any suggestions are appreciated since I'm really not sure how to debug
this further. I'm also attaching a couple screenshots that might be
useful.

spiral