Thread: Need to know more about pg_test_fsync utility
Hi Team,
I would like to understand the internals of pg_test_fsync utility as I know pg_test_fsync is intended to give us a reasonable idea of what is the fastest wal_sync_method for our system but as per the documentation it will also provide the diagnostic information in the event of an I/O problem. So, I have below questions:
1) How to interpret the output of pg_test_fsync?
2) What is the meaning of ops/sec & usecs/op?
3) How does this utility work internally?
4) What is the IO pattern of this utility? serial/sequence IO or Multiple thread with Parallel IO?
5) Can we change the testing like FIO with multiple threads and parallel IO?
6) How a commit happened in the background while executing this utility?
7) How can we use this tool to measure the I/O issue?
8) In which area or section in the output do we need to focus while troubleshooting I/O issues?
9) What is the meaning of “Non-sync’ed 8kB writes?
I also would like to know is there any best Practice from PostgreSQL which mentions what is the disk latency required for the WAL & DATA disk?
Thank You :)
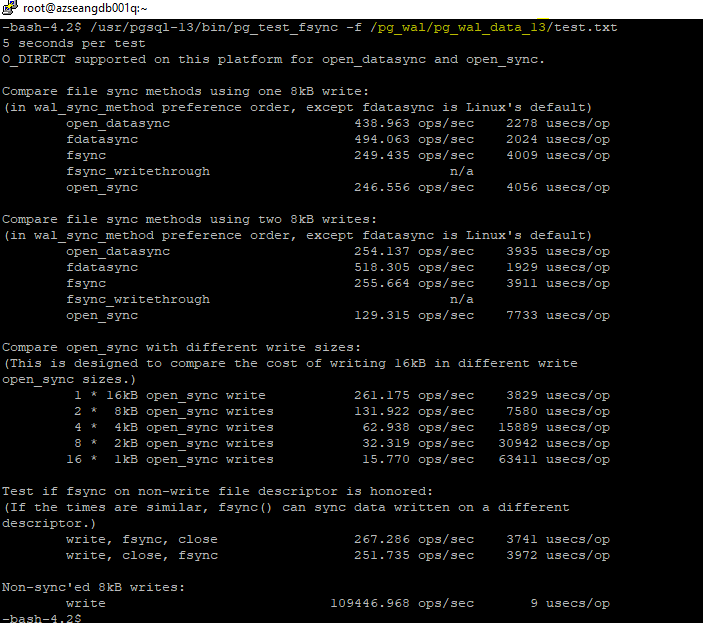
On Fri, Dec 10, 2021 at 3:20 PM PGSQL DBA <pgsqldba.1987@gmail.com> wrote:
> 1) How to interpret the output of pg_test_fsync?

The main interesting area is probably the top section that compares
the different wal_sync_method settings.  For example, it's useful to
verify the claim that fdatasync() is faster than fsync() (because it
only flushes data, not meta-data like file modified time).  It may
also be useful for measuring the effects of different caching settings
on your OS and storage.  Unfortunately open_datasync is a bit
misleading; we don't actually use O_DIRECT with open_datasync anymore,
unless you set wal_level=minimal, which almost nobody ever does.

> 2) What is the meaning of ops/sec & usecs/op?

Number of times it managed to flush data to disk per second
sequentially, and the same information expressed as microseconds per
flush.

> 3) How does this utility work internally?

It just does a loop over some system calls, or to be more precise,

https://github.com/postgres/postgres/blob/master/src/bin/pg_test_fsync/pg_test_fsync.c

> 4) What is the IO pattern of this utility? serial/sequence IO or Multiple thread with Parallel IO?

Sequential, no threads.

> 5) Can we change the testing like FIO with multiple threads and parallel IO?

Nope.  This is a simple tool.  Fio is much more general and useful.

> 6) How a commit happened in the background  while executing this utility?

Nothing happens in the background, it uses synchronous system calls
from one thread.

> 7) How can we use this tool to measure the I/O issue?

It's a type of micro-benchmark that gives you an idea of a sort of
baseline you can expect from a single PostgreSQL session committing to
the WAL.

> 8) In which area or section in the output do we need to focus while troubleshooting I/O issues?

If PostgreSQL couldn't commit small sequential transactions about that
fast I'd be interested in finding out why, and if fdatasync is
performing faster than published/device IOPS suggest should be
possible then I'd investigate whether data is being cached
unexpectedly, perhaps indicating that committed transactions be lost
in a system crash event.

> 9) What is the meaning of “Non-sync’ed 8kB writes?

Calling the pwrite() system call, which writes into your operating
system's page cache but (usually) doesn't wait for any I/O.  Should be
somewhere north of 1 million/sec.
Hi Thomas,
Thank you for your reply.
As you mentioned in question-8, "I'd investigate whether data is being cached unexpectedly, perhaps indicating that committed transactions be lost in a system crash event." So, I would like to know that if we configure the disk for the WALs with read+write disk cache then will it create any performance issue and show the attached output?
I also would like to know is there any best Practice from PostgreSQL which mentions what is the disk latency required for the WAL & DATA disk?
On Fri, 10 Dec 2021 at 10:56, Thomas Munro <thomas.munro@gmail.com> wrote:
On Fri, Dec 10, 2021 at 3:20 PM PGSQL DBA <pgsqldba.1987@gmail.com> wrote:
> 1) How to interpret the output of pg_test_fsync?
The main interesting area is probably the top section that compares
the different wal_sync_method settings. For example, it's useful to
verify the claim that fdatasync() is faster than fsync() (because it
only flushes data, not meta-data like file modified time). It may
also be useful for measuring the effects of different caching settings
on your OS and storage. Unfortunately open_datasync is a bit
misleading; we don't actually use O_DIRECT with open_datasync anymore,
unless you set wal_level=minimal, which almost nobody ever does.
> 2) What is the meaning of ops/sec & usecs/op?
Number of times it managed to flush data to disk per second
sequentially, and the same information expressed as microseconds per
flush.
> 3) How does this utility work internally?
It just does a loop over some system calls, or to be more precise,
https://github.com/postgres/postgres/blob/master/src/bin/pg_test_fsync/pg_test_fsync.c
> 4) What is the IO pattern of this utility? serial/sequence IO or Multiple thread with Parallel IO?
Sequential, no threads.
> 5) Can we change the testing like FIO with multiple threads and parallel IO?
Nope. This is a simple tool. Fio is much more general and useful.
> 6) How a commit happened in the background while executing this utility?
Nothing happens in the background, it uses synchronous system calls
from one thread.
> 7) How can we use this tool to measure the I/O issue?
It's a type of micro-benchmark that gives you an idea of a sort of
baseline you can expect from a single PostgreSQL session committing to
the WAL.
> 8) In which area or section in the output do we need to focus while troubleshooting I/O issues?
If PostgreSQL couldn't commit small sequential transactions about that
fast I'd be interested in finding out why, and if fdatasync is
performing faster than published/device IOPS suggest should be
possible then I'd investigate whether data is being cached
unexpectedly, perhaps indicating that committed transactions be lost
in a system crash event.
> 9) What is the meaning of “Non-sync’ed 8kB writes?
Calling the pwrite() system call, which writes into your operating
system's page cache but (usually) doesn't wait for any I/O. Should be
somewhere north of 1 million/sec.
Attachment
On Mon, Dec 13, 2021 at 3:04 PM PGSQL DBA <pgsqldba.1987@gmail.com> wrote:
> As you mentioned in question-8, "I'd investigate whether data is being cached unexpectedly, perhaps indicating that
committedtransactions be lost in a system crash event." So, I would like to know that if we configure the disk for the
WALswith read+write disk cache then will it create any performance issue and show the attached output?

Which OS and file system are you running and what kind of storage
system is it?  If you can turn write caching on and off in your
storage layer without affecting the ops/sec that's a pretty good clue
that it's respecting the cache control commands that the OS sends.
The numbers you showed are reassuringly low.  Hmm, I wonder why you
have such a low number for non-sync'd writes (the last line).

I have a concrete example of using this tool to learn something about
an unfamiliar-to-me operating system, from this morning: I saw a
system that reported ~6k IOPS for open_datasync and only ~600 IOPS for
fdatasync.  With some limited knowledge of file systems I expect the
latter to involve sending a SYNCHRONIZE CACHE command to flush device
caches, and the former to do that, or use a more efficient FUA flag to
flush just particular writes and not the whole write cache.  I didn't
expect it to go 10x faster, so something had to be wrong.  With some
more investigation and reading I learned that the storage drivers I
was using do indeed ignore FUA cache control flags, so that
wal_sync_method is not crash safe; if you lose power and come back up,
you might lose a bunch of committed transactions from the end of the
WAL.  I turned off write caches in the storage device, and then
open_datasync became a lot slower, matching my expectations.

These are primitive tools, but can help to check some assumptions...

Obligatory remark: PostgreSQL 9.5 is out of support, please see
https://www.postgresql.org/support/versioning/.

> I also would like to know is there any best Practice from PostgreSQL which mentions what is the disk latency required
forthe WAL & DATA disk?

No particular latency is required by PostgreSQL, and I don't have a
general answer to this.  Is it fast enough for you?  What sort of
workload is it running, OLTP, reporting, ...?
Hi Thomas,
Apologies for uploading the wrong screenshot in the attachment. I have uploaded the correct output of pg_test_fsync for your reference .
Please find our environment details as below:
Infra: Azure IaaS
OS: Red Hat Enterprise Linux Server release 7.9
File System: XFS
Disk: Premium SSD
IOPS: 5000 per Disk
Throughput: 200 MB/Sec per Disk
Throughput: 200 MB/Sec per Disk
Disk Cache: Read+Write
Workload: OLTP
Actual issue is we are getting slow execution of Commit & Prepared Commit statements only. Execution of these statements is taking 2 to 14 seconds. That's why we are analysing the pg_test_fsync output & FIO for further troubleshooting but unable to find any right directions.
On Mon, 13 Dec 2021 at 10:45, Thomas Munro <thomas.munro@gmail.com> wrote:
On Mon, Dec 13, 2021 at 3:04 PM PGSQL DBA <pgsqldba.1987@gmail.com> wrote:
> As you mentioned in question-8, "I'd investigate whether data is being cached unexpectedly, perhaps indicating that committed transactions be lost in a system crash event." So, I would like to know that if we configure the disk for the WALs with read+write disk cache then will it create any performance issue and show the attached output?
Which OS and file system are you running and what kind of storage
system is it? If you can turn write caching on and off in your
storage layer without affecting the ops/sec that's a pretty good clue
that it's respecting the cache control commands that the OS sends.
The numbers you showed are reassuringly low. Hmm, I wonder why you
have such a low number for non-sync'd writes (the last line).
I have a concrete example of using this tool to learn something about
an unfamiliar-to-me operating system, from this morning: I saw a
system that reported ~6k IOPS for open_datasync and only ~600 IOPS for
fdatasync. With some limited knowledge of file systems I expect the
latter to involve sending a SYNCHRONIZE CACHE command to flush device
caches, and the former to do that, or use a more efficient FUA flag to
flush just particular writes and not the whole write cache. I didn't
expect it to go 10x faster, so something had to be wrong. With some
more investigation and reading I learned that the storage drivers I
was using do indeed ignore FUA cache control flags, so that
wal_sync_method is not crash safe; if you lose power and come back up,
you might lose a bunch of committed transactions from the end of the
WAL. I turned off write caches in the storage device, and then
open_datasync became a lot slower, matching my expectations.
These are primitive tools, but can help to check some assumptions...
Obligatory remark: PostgreSQL 9.5 is out of support, please see
https://www.postgresql.org/support/versioning/.
> I also would like to know is there any best Practice from PostgreSQL which mentions what is the disk latency required for the WAL & DATA disk?
No particular latency is required by PostgreSQL, and I don't have a
general answer to this. Is it fast enough for you? What sort of
workload is it running, OLTP, reporting, ...?