Thread: very high replay_lag on 3-node cluster
Hello,
In my previous post[1] on this list I brought up an issue with long running checkpoints. I reduced checkpoint_timeout to a more reasonable value (15m down from 60m) and forced/immediate checkpoints now complete mostly in under a minute. This thread and another one[2] on the Clusterlabs mailinglist also helped me understand more about how PostgreSQL internals work, thanks everyone!
Now to my current issue: I took the advice to add more monitoring on replay lag (using pg_last_xact_replay_timestamp) and things are not looking good. Last night replication lagged by almost 6 hours on one of the nodes[3], but eventually caught up. As you can see in that screenshot, ph-sql-03 is consistently slower to replay than ph-sql-05 (ph-sql-04 is the current master) and there happen to be different SSD's in ph-sql-03 (Crucial MX300 vs Crucial MX500 in the other two), which makes me think this is IO related.
When I check the replay_lag column of pg_stat_replication, the numbers are consistent with the data from pg_last_xact_replay_timestamp:
postgres=# SELECT application_name, replay_lag FROM pg_stat_replication;
application_name | replay_lag
------------------+-----------------
ph-sql-03 | 00:15:16.179952
ph-sql-05 | 00:10:01.078163
application_name | replay_lag
------------------+-----------------
ph-sql-03 | 00:15:16.179952
ph-sql-05 | 00:10:01.078163
Currently this doesn't present an operational issue, as the slaves aren't used by applications (still waiting for development to make the necessary changes). So there are no queries running at all on the slaves apart from the occasional monitoring.
Cluster specifications:
all nodes:
- filesystem: ZFS stripe of mirrors
- 2* CPU: Intel(R) Xeon(R) CPU E5-2630 v4 @ 2.20GHz (20 cores total)
- 128 GB RAM
ph-sql-03: 8* Crucial MX300 1050MB, underprovisioned to 1TB
ph-sql-0{4,5}: 8* Crucial MX500 1TB
postgresql.conf with GUCs changed from default:
shared_buffers = 8GB
work_mem = 64MB
maintenance_work_mem = 2GB
autovacuum_work_mem = 1GB
effective_io_concurrency = 200
max_worker_processes = 50
max_parallel_maintenance_workers = 8
max_parallel_workers_per_gather = 8
max_parallel_workers = 40
wal_level = replica
synchronous_commit = off
full_page_writes = off
wal_log_hints = on
wal_buffers = 128MB
checkpoint_timeout = 15min
max_wal_size = 8GB
min_wal_size = 1GB
checkpoint_completion_target = 0.9
archive_mode = on
archive_command = 'pgbackrest --stanza=pgdb2 archive-push %p'
max_wal_senders = 10
wal_keep_segments = 20
hot_standby = on
hot_standby_feedback = on
random_page_cost = 1.5
effective_cache_size = 48GB
default_statistics_target = 500
shared_preload_libraries = 'timescaledb, pg_cron, pg_prewarm' # (change requires restart)
max_locks_per_transaction = 512
What are possible reasons for the high replay_lag? Is my storage just too slow? Are there any tunables available?
Thank you,
Tiemen Ruiten
Anyone have an idea? Thanks very much in advance for any reply.
On Fri, Jul 19, 2019 at 1:46 PM Tiemen Ruiten <t.ruiten@tech-lab.io> wrote:
Hello,In my previous post[1] on this list I brought up an issue with long running checkpoints. I reduced checkpoint_timeout to a more reasonable value (15m down from 60m) and forced/immediate checkpoints now complete mostly in under a minute. This thread and another one[2] on the Clusterlabs mailinglist also helped me understand more about how PostgreSQL internals work, thanks everyone!Now to my current issue: I took the advice to add more monitoring on replay lag (using pg_last_xact_replay_timestamp) and things are not looking good. Last night replication lagged by almost 6 hours on one of the nodes[3], but eventually caught up. As you can see in that screenshot, ph-sql-03 is consistently slower to replay than ph-sql-05 (ph-sql-04 is the current master) and there happen to be different SSD's in ph-sql-03 (Crucial MX300 vs Crucial MX500 in the other two), which makes me think this is IO related.When I check the replay_lag column of pg_stat_replication, the numbers are consistent with the data from pg_last_xact_replay_timestamp:postgres=# SELECT application_name, replay_lag FROM pg_stat_replication;
application_name | replay_lag
------------------+-----------------
ph-sql-03 | 00:15:16.179952
ph-sql-05 | 00:10:01.078163Currently this doesn't present an operational issue, as the slaves aren't used by applications (still waiting for development to make the necessary changes). So there are no queries running at all on the slaves apart from the occasional monitoring.Cluster specifications:all nodes:- filesystem: ZFS stripe of mirrors- 2* CPU: Intel(R) Xeon(R) CPU E5-2630 v4 @ 2.20GHz (20 cores total)- 128 GB RAMph-sql-03: 8* Crucial MX300 1050MB, underprovisioned to 1TBph-sql-0{4,5}: 8* Crucial MX500 1TBpostgresql.conf with GUCs changed from default:shared_buffers = 8GB
work_mem = 64MB
maintenance_work_mem = 2GB
autovacuum_work_mem = 1GB
effective_io_concurrency = 200
max_worker_processes = 50
max_parallel_maintenance_workers = 8
max_parallel_workers_per_gather = 8
max_parallel_workers = 40
wal_level = replica
synchronous_commit = off
full_page_writes = off
wal_log_hints = on
wal_buffers = 128MB
checkpoint_timeout = 15min
max_wal_size = 8GB
min_wal_size = 1GB
checkpoint_completion_target = 0.9
archive_mode = on
archive_command = 'pgbackrest --stanza=pgdb2 archive-push %p'
max_wal_senders = 10
wal_keep_segments = 20
hot_standby = on
hot_standby_feedback = on
random_page_cost = 1.5
effective_cache_size = 48GB
default_statistics_target = 500
shared_preload_libraries = 'timescaledb, pg_cron, pg_prewarm' # (change requires restart)
max_locks_per_transaction = 512What are possible reasons for the high replay_lag? Is my storage just too slow? Are there any tunables available?Thank you,Tiemen Ruiten
Hi,

On Mon, 22 Jul 2019 11:05:57 +0200
Tiemen Ruiten <t.ruiten@tech-lab.io> wrote:
[...]
> > Now to my current issue: I took the advice to add more monitoring on
> > replay lag (using pg_last_xact_replay_timestamp) and things are not looking
> > good. Last night replication lagged by almost 6 hours on one of the
> > nodes[3], but eventually caught up. As you can see in that screenshot,
> > ph-sql-03 is consistently slower to replay than ph-sql-05 (ph-sql-04 is the
> > current master) and there happen to be different SSD's in ph-sql-03
> > (Crucial MX300 vs Crucial MX500 in the other two), which makes me think
> > this is IO related.

Such a difference is quite surprising. Moreover, I suppose you have some
caching in front of disks (either RAID or SAN?). Could you describe your disk
stack with more details?

Do you have any detailed metrics about disks and network IO to share?

The network is the same for both nodes?
On Mon, Jul 22, 2019 at 11:28 AM Jehan-Guillaume (ioguix) de Rorthais <ioguix@free.fr> wrote:
Hi,
On Mon, 22 Jul 2019 11:05:57 +0200
Tiemen Ruiten <t.ruiten@tech-lab.io> wrote:
[...]
> > Now to my current issue: I took the advice to add more monitoring on
> > replay lag (using pg_last_xact_replay_timestamp) and things are not looking
> > good. Last night replication lagged by almost 6 hours on one of the
> > nodes[3], but eventually caught up. As you can see in that screenshot,
> > ph-sql-03 is consistently slower to replay than ph-sql-05 (ph-sql-04 is the
> > current master) and there happen to be different SSD's in ph-sql-03
> > (Crucial MX300 vs Crucial MX500 in the other two), which makes me think
> > this is IO related.
Such a difference is quite surprising. Moreover, I suppose you have some
caching in front of disks (either RAID or SAN?). Could you describe your disk
stack with more details?
Do you have any detailed metrics about disks and network IO to share?
The network is the same for both nodes?
All nodes have only local storage. The filesystem is ZFS, which has its own builtin caching (ARC/L2ARC & ZIL). There are no hardware caching devices present. The disks are connected using a Supermicro AOC-S3008L-L8E HBA (shown as LSI Logic / Symbios Logic SAS3008 PCI-Express Fusion-MPT SAS-3 (rev 02) with lspci). This is the layout of the pool:
[root@ph-sql-04 ter]# zpool status
pool: tank
state: ONLINE
scan: scrub repaired 0B in 0 days 00:07:51 with 0 errors on Tue Jul 16 03:17:52 2019
config:
NAME STATE READ WRITE CKSUM
tank ONLINE 0 0 0
mirror-0 ONLINE 0 0 0
sda ONLINE 0 0 0
sdb ONLINE 0 0 0
mirror-1 ONLINE 0 0 0
sdc ONLINE 0 0 0
sdd ONLINE 0 0 0
mirror-2 ONLINE 0 0 0
sde ONLINE 0 0 0
sdf ONLINE 0 0 0
mirror-3 ONLINE 0 0 0
sdg ONLINE 0 0 0
sdh ONLINE 0 0 0
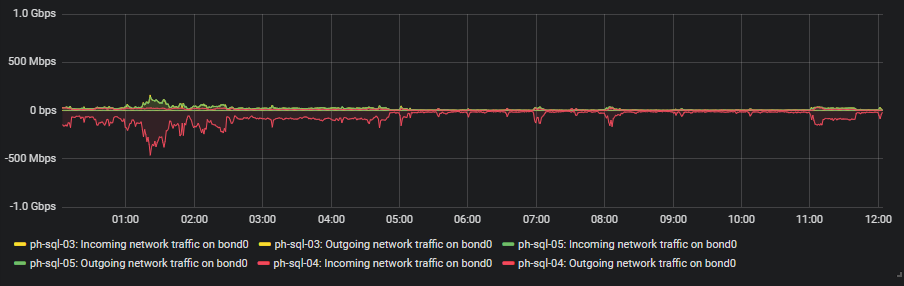
I've attached a graph of network IO on all servers. The network config is identical for all three nodes: 2x bonded gigabit connection to the same stacked switch pair.
Currently I don't have much metrics on raw disk IO, I can add some monitoring items and report those tomorrow if that would be useful. I do have a lot of metrics available related to PostgreSQL (buffers written/read, checkpoints, rows fetched/updated/inserted etc.)
Attachment
On Mon, 22 Jul 2019 12:58:47 +0200
Tiemen Ruiten <t.ruiten@tech-lab.io> wrote:
[...]
> I've attached a graph of network IO on all servers. The network config is
> identical for all three nodes: 2x bonded gigabit connection to the same
> stacked switch pair.

AFAICS, Network doesn't looks saturated.

> Currently I don't have much metrics on raw disk IO, I can add some
> monitoring items and report those tomorrow if that would be useful.

Yes, ZFS metrics and underlying hardware would be useful. You can add some
detailed CPU and MEM metrics as well, it often helps correlating things
together.