Thread: Problem with performance using query with unnest after migrating from V9.1 to V9.2 and higher
Problem with performance using query with unnest after migrating from V9.1 to V9.2 and higher
Hi,
I have a problem with the performance of some queries using unnest after migrating from V9.1.12 to V9.5.3. It doesn’t depend on if I am using pg_upgrade or pg_dumpall for migration.
I tried different versions of PostgreSQL. The problem starts with V9.2.
The databases V9.1.12 and V9.5.3 are on the same virtual machine with Microsoft Windows 2012 R2, 16 GB Ram and 1 Intel Xeon CPU E7-4820 2,00 GHz and they are using the same postgresql.conf.
The server configuration changes are:
"archive_command" "copy ""%p"" ""E:/9.5/archive/%f"""
"archive_mode" "on"
"autovacuum" "off"
"autovacuum_analyze_threshold" "250"
"autovacuum_naptime" "1min"
"autovacuum_vacuum_threshold" "1000"
"default_text_search_config" "pg_catalog.simple"
"default_with_oids" "on"
"dynamic_shared_memory_type" "windows"
"effective_cache_size" "4000MB"
"lc_messages" "German, Germany"
"lc_monetary" "German, Germany"
"lc_numeric" "German, Germany"
"lc_time" "German, Germany"
"listen_addresses" "*"
"log_autovacuum_min_duration" "0"
"log_connections" "on"
"log_destination" "stderr"
"log_directory" "E:/9.5/log"
"log_disconnections" "on"
"log_line_prefix" "%t %u %r %d "
"log_min_duration_statement" "-1"
"log_min_error_statement" "debug5"
"log_statement" "mod"
"log_temp_files" "20MB"
"log_truncate_on_rotation" "on"
"logging_collector" "on"
"maintenance_work_mem" "256MB"
"max_connections" "200"
"max_stack_depth" "2MB"
"port" "5432"
"shared_buffers" "4000MB"
"wal_buffers" "2MB"
"wal_level" "archive"
"work_mem" "20MB"
I created the following test-schema and test-table on both databases:
create schema schema_test AUTHORIZATION postgres;
CREATE TABLE schema_test.table_a
(
col0001 character varying(10) NOT NULL, -- customer number
col0002 character varying(5) NOT NULL, -- account number
col0003 date NOT NULL, -- booking period
col0004 smallint NOT NULL DEFAULT 0, -- cost center
col0005 numeric(12,2) NOT NULL DEFAULT 0, -- value01
col0006 numeric(12,2) NOT NULL DEFAULT 0, -- value02
CONSTRAINT table_a_pk PRIMARY KEY (col0001, col0002, col0003, col0004),
CONSTRAINT table_a_chk01 CHECK (col0002::text ~ '^[[:digit:]]{0,5}$'::text)
)
WITH (
OIDS=TRUE
);
ALTER TABLE schema_test.table_a OWNER TO postgres;
GRANT ALL ON TABLE schema_test.table_a TO PUBLIC;
Then I imported 50 datas:
5010010000 01351 2000-01-01 0 1568.13 0.00
5010010000 01351 2000-12-01 0 -1568.13 0.00
7810405800 01491 2005-12-01 0 1347.00 0.00
7810405801 05720 2005-12-01 0 148.92 0.00
5010010000 01496 2000-01-01 0 -3196.90 -142834.53
5010010000 01496 2000-02-01 0 -1628.77 0.00
5010010000 01496 2000-03-01 0 -1628.77 0.00
5010010000 01496 2000-04-01 0 -1628.77 0.00
5010010000 01496 2000-05-01 0 -1628.77 0.00
5010010000 01496 2000-06-01 0 -1628.77 0.00
5010010000 01496 2000-07-01 0 -1628.77 0.00
5010010000 01496 2000-08-01 0 -1628.77 0.00
5010010000 01496 2000-09-01 0 -1628.77 0.00
5010010000 01496 2000-10-01 0 -1628.77 0.00
5010010000 01496 2000-11-01 0 -1628.77 0.00
7810405800 01490 2005-12-01 0 1533.20 0.00
5010010000 01496 2000-12-01 0 -60.64 0.00
7810405801 05600 2005-12-01 0 74.82 0.00
5010010000 02009 2000-01-01 0 11808.59 0.00
7810405801 01101 2005-12-01 0 12700.00 0.00
7810405801 01225 2005-12-01 0 -5898.23 0.00
5010010000 02009 2000-02-01 0 11808.59 0.00
7810405801 05958 2005-12-01 0 76.25 0.00
5010010000 02009 2000-03-01 0 11808.59 0.00
7810405802 04502 2005-12-01 0 144.89 0.00
7810405802 04320 2005-12-01 0 22.48 0.00
5010010000 02009 2000-04-01 0 11808.59 0.00
3030112600 01201 2006-02-01 0 -29.88 0.00
5010010000 02009 2000-05-01 0 11808.59 0.00
7810405802 01001 2005-12-01 0 2416.24 0.00
7810405802 09295 2005-12-01 0 -5219.00 0.00
5010010000 02009 2000-06-01 0 11808.59 0.00
7810405802 05216 2005-12-01 0 719.86 0.00
7810405802 08823 2005-12-01 0 -14318.85 0.00
5010010000 02009 2000-07-01 0 11808.59 0.00
7810405802 09800 2005-12-01 0 -51.29 0.00
3030112600 09000 2006-02-01 0 -29550.83 0.00
5010010000 02009 2000-08-01 0 11808.59 0.00
7810405801 04500 2005-12-01 0 175.00 0.00
3030112600 04100 2006-02-01 0 1839.19 0.00
5010010000 02009 2000-09-01 0 11808.59 0.00
7810405801 05890 2005-12-01 0 1200.00 0.00
3030112600 05958 2006-02-01 0 24.56 0.00
5010010000 02009 2000-10-01 0 11808.59 0.00
7810405802 04802 2005-12-01 0 1347.18 0.00
7810405801 04800 2005-12-01 0 354.51 0.00
5010010000 02009 2000-11-01 0 11808.59 0.00
7810405801 04400 2005-12-01 0 47.97 0.00
7810405801 04510 2005-12-01 0 326.80 0.00
5010010000 02009 2000-12-01 0 11808.59 0.00
The query with the problem:
select col0002
from schema_test.table_a
where col0001 in (select unnest(string_to_array('5010010000',',')))
group by 1
order by 1
V9.1: 16 msec
V9.5: 31 msec
In the original table we have 15 million rows.
V9.1: 47 msec
V9.5: 6,2 sec
Explain Analyze:
V9.1:
V9.5:
Query plan:
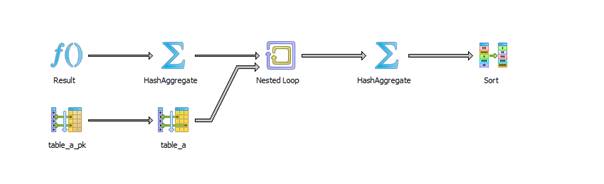
V9.1:
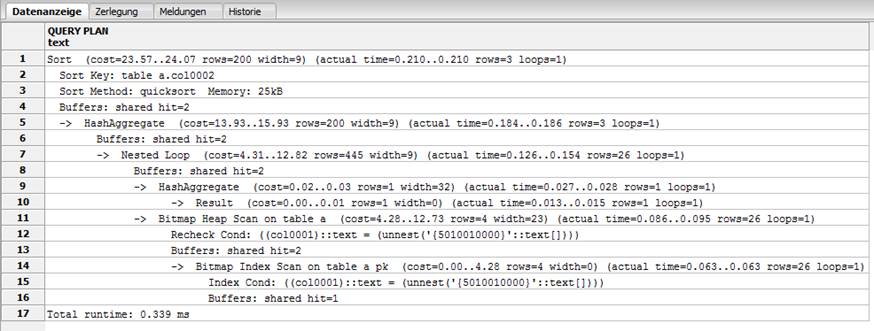
"Sort (cost=23.57..24.07 rows=200 width=9) (actual time=0.210..0.210 rows=3 loops=1)"
" Sort Key: table_a.col0002"
" Sort Method: quicksort Memory: 25kB"
" Buffers: shared hit=2"
" -> HashAggregate (cost=13.93..15.93 rows=200 width=9) (actual time=0.184..0.186 rows=3 loops=1)"
" Buffers: shared hit=2"
" -> Nested Loop (cost=4.31..12.82 rows=445 width=9) (actual time=0.126..0.154 rows=26 loops=1)"
" Buffers: shared hit=2"
" -> HashAggregate (cost=0.02..0.03 rows=1 width=32) (actual time=0.027..0.028 rows=1 loops=1)"
" -> Result (cost=0.00..0.01 rows=1 width=0) (actual time=0.013..0.015 rows=1 loops=1)"
" -> Bitmap Heap Scan on table_a (cost=4.28..12.73 rows=4 width=23) (actual time=0.086..0.095 rows=26 loops=1)"
" Recheck Cond: ((col0001)::text = (unnest('{5010010000}'::text[])))"
" Buffers: shared hit=2"
" -> Bitmap Index Scan on table_a_pk (cost=0.00..4.28 rows=4 width=0) (actual time=0.063..0.063 rows=26 loops=1)"
" Index Cond: ((col0001)::text = (unnest('{5010010000}'::text[])))"
" Buffers: shared hit=1"
"Total runtime: 0.339 ms"
https://explain.depesz.com/s/sdN
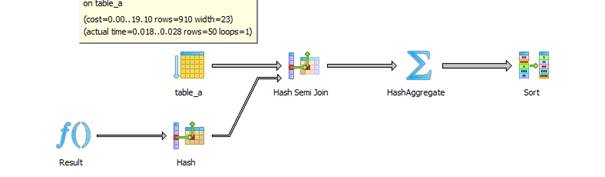
V9.5:
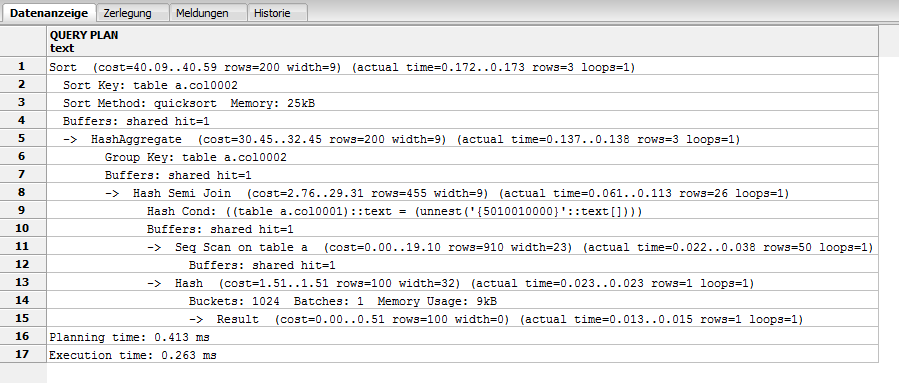
"Sort (cost=40.09..40.59 rows=200 width=9) (actual time=0.172..0.173 rows=3 loops=1)"
" Sort Key: table_a.col0002"
" Sort Method: quicksort Memory: 25kB"
" Buffers: shared hit=1"
" -> HashAggregate (cost=30.45..32.45 rows=200 width=9) (actual time=0.137..0.138 rows=3 loops=1)"
" Group Key: table_a.col0002"
" Buffers: shared hit=1"
" -> Hash Semi Join (cost=2.76..29.31 rows=455 width=9) (actual time=0.061..0.113 rows=26 loops=1)"
" Hash Cond: ((table_a.col0001)::text = (unnest('{5010010000}'::text[])))"
" Buffers: shared hit=1"
" -> Seq Scan on table_a (cost=0.00..19.10 rows=910 width=23) (actual time=0.022..0.038 rows=50 loops=1)"
" Buffers: shared hit=1"
" -> Hash (cost=1.51..1.51 rows=100 width=32) (actual time=0.023..0.023 rows=1 loops=1)"
" Buckets: 1024 Batches: 1 Memory Usage: 9kB"
" -> Result (cost=0.00..0.51 rows=100 width=0) (actual time=0.013..0.015 rows=1 loops=1)"
"Planning time: 0.413 ms"
"Execution time: 0.263 ms"
https://explain.depesz.com/s/JUYr
The difference is that V9.1 uses Nested Loop and the index table_a_pk. V9.2 and higher don’t use the index.
What is the reason? Is there a parameter we can change?
Thanks for your help.
Greetings,
Udo Knels
Dipl.-Informatiker
Telefon: 0231 / 4506 375
Telefax: 0231 / 4506 9375
E-Mail : u.knels@treubuch-it.de
|
|

Sitz: Dortmund
Amtsgericht: Dortmund, HRB 6231
Geschäftsführer:
Hans Auf dem Kamp
USt-IdNr.: DE124728517
Diese E-Mail kann vertrauliche Informationen enthalten. Wenn Sie nicht der Adressat sind, sind Sie nicht zur Verwendung
der in dieser E-Mail enthaltenen Informationen befugt. Bitte benachrichtigen Sie uns über den irrtümlichen Erhalt.
This e-mail may contain confidential information. If you are not the addressee you are not authorized to make use
of the information contained in this e-mail. Please inform us immediately that you have received it by mistake.
Attachment
Re: Problem with performance using query with unnest after migrating from V9.1 to V9.2 and higher
On 9/19/16 2:29 AM, Knels, Udo wrote:
> The difference is that V9.1 uses Nested Loop and the index table_a_pk.
> V9.2 and higher don’t use the index.

First thing I'd try is running a manual ANALYZE; on the upgraded
database; the 9.2 plan you showed seems to be using default values, so
it thinks it's going to get 100 rows when it's only getting a few.
--
Jim Nasby, Data Architect, Blue Treble Consulting, Austin TX
Experts in Analytics, Data Architecture and PostgreSQL
Data in Trouble? Get it in Treble! http://BlueTreble.com
855-TREBLE2 (855-873-2532)   mobile: 512-569-9461
Re: Problem with performance using query with unnest after migrating from V9.1 to V9.2 and higher
Hi,

I tried the following on the upgraded database:
analyze schema_test.table_a;

But the result is the same.

https://explain.depesz.com/s/hsx5

"Sort  (cost=5.94..6.01 rows=26 width=6) (actual time=0.199..0.200 rows=3 loops=1)"
"  Sort Key: table_a.col0002"
"  Sort Method: quicksort  Memory: 25kB"
"  Buffers: shared hit=1"
"  ->  HashAggregate  (cost=5.07..5.33 rows=26 width=6) (actual time=0.161..0.163 rows=3 loops=1)"
"        Group Key: table_a.col0002"
"        Buffers: shared hit=1"
"        ->  Hash Semi Join  (cost=2.76..4.95 rows=50 width=6) (actual time=0.070..0.133 rows=26 loops=1)"
"              Hash Cond: ((table_a.col0001)::text = (unnest('{5010010000}'::text[])))"
"              Buffers: shared hit=1"
"              ->  Seq Scan on table_a  (cost=0.00..1.50 rows=50 width=17) (actual time=0.015..0.034 rows=50 loops=1)"
"                    Buffers: shared hit=1"
"              ->  Hash  (cost=1.51..1.51 rows=100 width=32) (actual time=0.028..0.028 rows=1 loops=1)"
"                    Buckets: 1024  Batches: 1  Memory Usage: 9kB"
"                    ->  Result  (cost=0.00..0.51 rows=100 width=0) (actual time=0.015..0.017 rows=1 loops=1)"
"Planning time: 0.653 ms"
"Execution time: 0.326 ms"

Greetings

Udo Knels
treubuch IT GmbH
Re: Problem with performance using query with unnest after migrating from V9.1 to V9.2 and higher
-----Original Message-----
From: pgsql-performance-owner@postgresql.org [mailto:pgsql-performance-owner@postgresql.org] On Behalf Of Knels, Udo
Sent: Thursday, September 22, 2016 8:40 AM
To: pgsql-performance@postgresql.org
Subject: Re: [PERFORM] Problem with performance using query with unnest after migrating from V9.1 to V9.2 and higher

Hi,

I tried the following on the upgraded database:
analyze schema_test.table_a;

But the result is the same.

https://explain.depesz.com/s/hsx5

"Sort  (cost=5.94..6.01 rows=26 width=6) (actual time=0.199..0.200 rows=3 loops=1)"
"  Sort Key: table_a.col0002"
"  Sort Method: quicksort  Memory: 25kB"
"  Buffers: shared hit=1"
"  ->  HashAggregate  (cost=5.07..5.33 rows=26 width=6) (actual time=0.161..0.163 rows=3 loops=1)"
"        Group Key: table_a.col0002"
"        Buffers: shared hit=1"
"        ->  Hash Semi Join  (cost=2.76..4.95 rows=50 width=6) (actual time=0.070..0.133 rows=26 loops=1)"
"              Hash Cond: ((table_a.col0001)::text = (unnest('{5010010000}'::text[])))"
"              Buffers: shared hit=1"
"              ->  Seq Scan on table_a  (cost=0.00..1.50 rows=50 width=17) (actual time=0.015..0.034 rows=50 loops=1)"
"                    Buffers: shared hit=1"
"              ->  Hash  (cost=1.51..1.51 rows=100 width=32) (actual time=0.028..0.028 rows=1 loops=1)"
"                    Buckets: 1024  Batches: 1  Memory Usage: 9kB"
"                    ->  Result  (cost=0.00..0.51 rows=100 width=0) (actual time=0.015..0.017 rows=1 loops=1)"
"Planning time: 0.653 ms"
"Execution time: 0.326 ms"

Greetings

Udo Knels
treubuch IT GmbH
_____________________________________________________________________________________________

table_a is too small, just 50 records.
Optimizer decided (correctly) that Seq Scan is cheaper than using an index.

Regards,
Igor Neyman
Re: Problem with performance using query with unnest after migrating from V9.1 to V9.2 and higher
Igor Neyman <ineyman@perceptron.com> writes:
> table_a is too small, just 50 records.
> Optimizer decided (correctly) that Seq Scan is cheaper than using an index.

Yeah.  The given test case is quite useless for demonstrating that you
have a problem, since it's actually *faster* on 9.5 than 9.1.

What I suspect is happening is that 9.2 and up assume that an unnest()
will produce 100 rows, whereas 9.1 assumed it would produce only 1 row.
The latter happened to be more accurate for this specific case, though
in general it could result in selection of very bad plans.

If you are intending only one value be selected, don't use unnest();
you'd be better off with "(string_to_array('5010010000',','))[1]"
or something like that.

In the long run we should teach the planner how to produce better
estimates for unnest-on-a-constant-array, though I'm unsure whether
that would help your real application as opposed to this test case.

            regards, tom lane
Re: Problem with performance using query with unnest after migrating from V9.1 to V9.2 and higher
Hi,

Thank you very much for your answers.

Yes, 50 rows aren't enough, but the original table has about 14 million rows and after analyzing the table I got the
sameresult.

We changed our functions and used string_to_array instead of unnest and its ok.

It was not only a problem with one value to be selected. The problem exists with three or more too. Maybe the
implementationof unnest has changed from V9.1 to V9.5. In V9.1 there was only one array as argument. Since V9.4 we can
usemore than one array as argument. And so the planner works different. So, if we change from one version to another in
thefuture, we have to check the PostgreSQL-functions if the behaviour of the function or the planner has changed and
thenreplace the function. It would be great if we could see this in the documentation.

Greetings

Udo Knels
treubuch IT GmbH