Thread: SSI slows down over time
Hi all,

(Referred here from pgsql-performance)

tl;dr: every time I shut down a database and bring it back up, SSI seems
to go slower. In order to avoid thousands of SSI aborts due to running
out of shared memory, I've had to set max_predicate_locks to several
thousand (2000 is tolerable, 8000 required to avoid all errors); this
seems excessively high considering how short TPC-C transactions are, and
how aggressively SSI reclaims storage. I've also found what appears to
be a bug, where the SSI SLRU storage (pg_serial) sometimes jumps from
~200kB to 8GB within a matter of seconds. The 8GB persists through later
runs and seems to be part of the performance problem; deleting the
pg_serial directory after each database shutdown seems to resolve most
of the problem.

Excruciatingly long and detailed version follows...

This is with pgsql-9.3.4, x86_64-linux, home-built with `./configure
--prefix=...' and gcc-4.7.
24-core Intel box with hyperthreading (so 48 contexts).
TPC-C courtesy of oltpbenchmark.com. 12WH TPC-C, 24 clients.

I get a strange behavior across repeated runs: each 100-second run is a
bit slower than the one preceding it, when run with SSI (SERIALIZABLE).
Switching to SI (REPEATABLE_READ) removes the problem, so it's
apparently not due to the database growing. The database is completely
shut down (pg_ctl stop) between runs, but the data lives in tmpfs, so
there's no I/O problem here. 64GB RAM, so no paging, either.

Note that this slowdown is in addition to the 30% performance gap
between SI and SSI on my 24-core machine. I understand that the latter
is a known bottleneck [1]; my question is why the bottleneck should get
worse over time:

With SI, I get ~4.4ktps, consistently.
With SSI, I get 3.9, 3.8, 3.4. 3.3, 3.1, 2.9, ...

So the question: what should I look for to diagnose/triage this problem?
I've done some legwork already, but have no idea where to go next.

Looking through the logs, abort rates due to SSI aren't changing in any
obvious way. I've been hacking on SSI for over a month now as part of a
research project, and am fairly familiar with predicate.c, but I don't
see any obvious reason this behavior should arise (in particular, SLRU
storage seems to be re-initialized every time the postmaster restarts,
so there shouldn't be any particular memory effect due to SIREAD locks).
I'm also familiar with both Cahill's and Ports/Grittner's published
descriptions of SSI, but again, nothing obvious jumps out.

Top reports only 50-60% CPU usage for most clients, and linux perf shows
5-10% of time going to various lwlock calls. Compiling with
-DLWLOCK_STATS and comparing results for SI vs. SSI shows that the
WALInsertLock (7) is white-hot in all cases, followed by almost equally
white-hot SSI lwlocks (28,30,29) and the 16 PredicateLockMgrLocks
(65-80). Other than the log bottleneck, this aligns precisely with
previous results reported by others [1]; unfortunately, I don't see
anything obvious in the lock stats to say why the problem is getting
worse over time.

In my experience this sort of behavior indicates a bug, where fixing it
could have a significant impact on performance (because the early
"damage" is done so quickly after start-up that even the very first run
doesn't live up to its true potential).

I also strongly suspect a bug because the SLRU storage (pg_serial)
occasionally jumps from the 100-200kB range to 8GB. It's rare, but when
it happens, performance tanks to tens of tps for the rest of the run,
and the 8GB persists into subsequent runs. I saw some code comments in
predicate.c suggesting that SLRU pages which fall out of range would not
be reclaimed until the next SLRU wraparound. Deleting pg_serial/* before
each `pg_ctl start' seems to remove most of the problem (and, from my
understanding of SSI, should be harmless, because no serial conflicts
can persists across a database shutdown).

I tried to repro, and a series of 30-second runs gave the following
throughputs (tps):
*4615
3155 3149 3115 3206 3162 3069 3005 2978 2953 **308
2871 2876 2838 2853 2817 2768 2736 2782 2732 2833
2749 2675 2771 2700 2675 2682 2647 2572 2626 2567
*4394

That ** entry was an 8GB blow-up. All files in the directory had been
created at the same time (= not during a previous run), and persisted
through the runs that followed. There was also a run where abort rates
jumped through the roof (~40k aborts rather than the usual 2000 or so),
with a huge number of "out of shared memory" errors; apparently
max_predicate_locks=2000 wasn't high enough.

$ cat pgsql.conf
shared_buffers = 8GB
synchronous_commit = off
checkpoint_segments = 64
max_pred_locks_per_transaction = 2000
default_statistics_target = 100
maintenance_work_mem = 2GB
checkpoint_completion_target = 0.9
effective_cache_size = 40GB
work_mem = 1920MB
wal_buffers = 16MB


[1]
http://www.postgresql.org/message-id/CA+TgmoYAiSM2jWEndReY5PL0sKbhgg7dbDH6r=oXKYzi9B7KJA@mail.gmail.com

Thoughts?
Ryan
Ryan Johnson <ryan.johnson@cs.utoronto.ca> wrote:

> every time I shut down a database and bring it back up, SSI seems
> to go slower.

There's one thing to rule out up front -- that would be a
long-lived prepared transaction.

Please post the output of these queries:

select version();
show max_prepared_transactions;
select * from pg_prepared_xacts;

Thanks.

--
Kevin Grittner
EDB: http://www.enterprisedb.com
The Enterprise PostgreSQL Company
On 14/04/2014 10:14 AM, Kevin Grittner wrote:
> Ryan Johnson <ryan.johnson@cs.utoronto.ca> wrote:
>
>> every time I shut down a database and bring it back up, SSI seems
>> to go slower.
> There's one thing to rule out up front -- that would be a
> long-lived prepared transaction.
>
> Please post the output of these queries:
>
> select version();
> show max_prepared_transactions;
> select * from pg_prepared_xacts;
Hmm. My machine was rebooted over the weekend for Heartbleed patches, so
I'll have to re-build the database and fire off enough runs to repro.
There are some disadvantages to keeping it in tmpfs...

Meanwhile, a quick question: what factors might cause a prepared
transaction to exist in the first place? I'm running a single-node db,
and I've had only normal database shutdowns, so I wouldn't have expected
any.

Thoughts?
Ryan
Ryan Johnson <ryan.johnson@cs.utoronto.ca> wrote:

> what factors might cause a prepared transaction to exist in the
> first place?

As part of a "distributed transaction" using "two phase commit" a
PREPARE TRANSACTION statement would have had to run against
PostgreSQL:

http://www.postgresql.org/docs/current/interactive/sql-prepare-transaction.html

> I'm running a single-node db, and I've had only normal database
> shutdowns, so I wouldn't have expected any.

Prepared transactions survive shutdowns, normal or not, so that
doesn't matter; but prepared transactions are normally used with a
transaction manager coordinating transactions among multiple data
stores.  On the other hand, I have seen cases where a developer
"playing around" with database features has created one.  And using
them with a "home-grown" transaction manager rather than a mature
product is risky; there are some non-obvious pitfalls to avoid.

Anyway, you may have found a bug, but most of what you're seeing
could be caused by a prepared transaction sitting around
indefinitely, so it's something to check before looking at other
possible causes.  If you have a way to reproduce this from a new
cluster, please share it.  That always makes diagnosis much easier.

--
Kevin Grittner
EDB: http://www.enterprisedb.com
The Enterprise PostgreSQL Company
On 14/04/2014 10:14 AM, Kevin Grittner wrote:
versionRyan Johnson <ryan.johnson@cs.utoronto.ca> wrote:every time I shut down a database and bring it back up, SSI seems to go slower.There's one thing to rule out up front -- that would be a long-lived prepared transaction. Please post the output of these queries: select version(); show max_prepared_transactions; select * from pg_prepared_xacts;
------------------------------------------------------------------------------------------------------------
PostgreSQL 9.3.4 on x86_64-unknown-linux-gnu, compiled by gcc (Ubuntu/Linaro 4.6.3-1ubuntu5) 4.6.3, 64-bit
(1 row)
max_prepared_transactions
---------------------------
0
(1 row)
transaction | gid | prepared | owner | database
-------------+-----+----------+-------+----------
(0 rows)
FYI, here's a plot of performance over time. Each point in the graph is throughput (in tps) over a 10-second measurement (~20 minutes total), against a 12 WH TPC-C dataset with 24 clients banging on it. I issued a pg_ctl stop/start pair between each run:
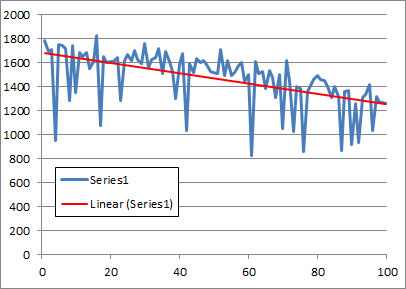
The downward trend is clearly visible, almost 30% performance loss by the end. The data directory went from 1.4GB to 3.8GB over the lifetime of the experiment. Final pg_serial size was 144kB, so the 8GB pg_serial anomaly was not responsible for the drop in performance over time (this time). I forgot to do an SI run at the beginning, but historically SI performance has remained pretty steady over time. I don't know what causes those big dips in performance, but it happens with SI as well so I assume it's checkpointing or some such.
Now that I have a degraded database, any suggestions what should I look for or what experiments I should run? I'm currently re-running the same experiment, but deleting pg_serial/* in between runs; there was some indication last week that this prevents the performance drop, but that was nowhere near a rigorous analysis.
BTW, this is actually a TPC-C++ implementation I created, based on the description in Cahill's thesis (and starting from the oltpbenchmark TPC-C code). It turns out that normal TPC-C never spills to pg_serial (at least, not that I ever saw). If you want to put hands on the code, I can tar it up and post it somewhere.
Thoughts?
Ryan
Attachment
On 14/04/2014 4:30 PM, Ryan Johnson wrote:
FYI, here's a plot of performance over time. Each point in the graph is throughput (in tps) over a 10-second measurement (~20 minutes total), against a 12 WH TPC-C dataset with 24 clients banging on it. I issued a pg_ctl stop/start pair between each run:
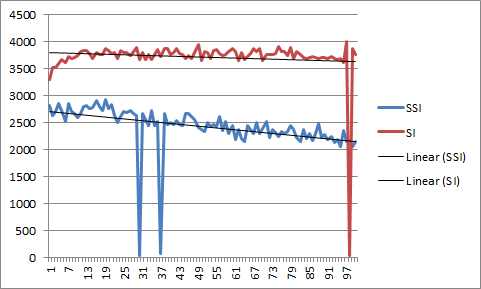
Updated result: SI definitely does not suffer any performance loss over time, but it's not clear what is wrong with SSI: deleting pg_serial/* had exactly zero impact on performance.
The two near-zero results for SSI are both cases where pg_serial/ ballooned to 8GB during the run (I saw two others tonight during testing). The one big dip for SI was a hang (the second such hang tonight).
Thoughts?
Ryan