Thread: Configuration Recommendations
I'm a n00b [1] to tuning DBs so if anyone has a bit of time to provide feedback, I'd sure appreciate any input the community might have on the plan, configuration, etc. I could very well have unintentionally left-off crucial parts of my descriptions below and for that I apologize for wasting time - let me know what I missed and I'll do my best to dig it up.
We are planning to rebuild our production 50GB PG 9.0 database serving our application platform on the new hardware below. The web-applications are 80/20 read/write and the data gateways are even mix 50/50 read/write; one of the gateways nightly exports & imports ~20% of our data. All applications use a single DB but the applications themselves run on 6 different machines.
The new hardware for the 50GB PG 9.0 machine is:
* 24 cores across 2 sockets
* 64 GB RAM
* 10 x 15k SAS drives on SAN
* 1 x 15k SAS drive local
* CentOS 6.2 (2.6.32 kernel)
We are considering the following drive allocations:
* 4 x 15k SAS drives, XFS, RAID 10 on SAN for PG data
* 4 x 15k SAS drives, XFS, RAID 10 on SAN for PG indexes
* 2 x 15k SAS drives, XFS, RAID 1 on SAN for PG xlog
* 1 x 15k SAS drive, XFS, on local storage for OS
OS:
PAGE_SIZE = 4096
_PHYS_PAGES = 12,352,666 (commas added for clarity)
kernel.shmall = 4,294,967,296 (commas added for clarity)
kernel.shmax = 68,719,476,736 (commas added for clarity)
kernel.sem = 250 32000 32 128
vm.swappiness = 0
dirty_ratio = 10
dirty_background_ratio = 5
To validate the configuration, I plan to use memtest86+, dd, bonnie++, and bonnie++ ZCAV.
If there are "obviously correct" choices in PG configuration, this would be tremendously helpful information to me. I'm planning on using pgbench to test the configuration options.
Thoughts?
Cheers,
Jan
[1] I'm applying what I learned from PostgreSQL 9.0 High Performance by Gregory Smith, along with numerous web sites and list postings.
On Tue, Apr 24, 2012 at 4:56 AM, Jan Nielsen
<jan.sture.nielsen@gmail.com> wrote:
> We are considering the following drive allocations:
>
>  * 4 x 15k SAS drives, XFS, RAID 10 on SAN for PG data
>  * 4 x 15k SAS drives, XFS, RAID 10 on SAN  for PG indexes
>  * 2 x 15k SAS drives, XFS, RAID 1 on SAN  for PG xlog
>  * 1 x 15k SAS drive, XFS, on local storage for OS

Is it established practice in the Postgres world to separate indexes
from tables?  I would assume that the reasoning of Richard Foote -
albeit for Oracle databases - is also true for Postgres:


http://richardfoote.wordpress.com/2008/04/16/separate-indexes-from-tables-some-thoughts-part-i-everything-in-its-right-place/
http://richardfoote.wordpress.com/2008/04/18/separate-indexes-from-tables-some-thoughts-part-ii-there-there/

http://richardfoote.wordpress.com/2008/04/28/indexes-in-their-own-tablespace-availabilty-advantages-is-there-anybody-out-there/

Conversely if you lump both on a single volume you have more
flexibility with regard to usage - unless of course you can
dynamically resize volumes.

To me it also seems like a good idea to mirror local disk with OS and
database software because if that fails you'll get downtime as well.
As of now you have a single point of failure there.

Kind regards

robert

--
remember.guy do |as, often| as.you_can - without end
http://blog.rubybestpractices.com/
On 04/23/2012 09:56 PM, Jan Nielsen wrote:

> The new hardware for the 50GB PG 9.0 machine is:
> * 24 cores across 2 sockets
> * 64 GB RAM
> * 10 x 15k SAS drives on SAN
> * 1 x 15k SAS drive local
> * CentOS 6.2 (2.6.32 kernel)

This is a pretty good build. Nice and middle-of-the-road for current
hardware. I think it's probably relevant what your "24 cores across 2
sockets" are, though. Then again, based on the 24-cores, I have to
assume you've got hex-core Xeons of some sort, with hyperthreading. That
suggests a higher end Sandy Bridge Xeon, like the X5645 or higher. If
that's the case, you're in good hands.

As a note, though... make sure you enable Turbo and other performance
settings (disable power-down of unused CPUs, etc) in the BIOS when
setting this up. We found that the defaults for the CPUs did not allow
processor scaling, and it was far too aggressive in cycling down cores,
such that cycling them back up had a non-zero cost. We saw roughly a 20%
improvement by forcing the CPUs into full online performance mode.

> We are considering the following drive allocations:
>
> * 4 x 15k SAS drives, XFS, RAID 10 on SAN for PG data
> * 4 x 15k SAS drives, XFS, RAID 10 on SAN for PG indexes
> * 2 x 15k SAS drives, XFS, RAID 1 on SAN for PG xlog
> * 1 x 15k SAS drive, XFS, on local storage for OS

Please don't do this. If you have the system you just described, give
yourself an 8x RAID10, and the 2x RAID1. I've found that your indexes
will generally be about 1/3 to 1/2 the total sixe of your database. So,
not only does your data partition lose read spindles, but you've wasted
1/2 to 2/3s of your active drive space. This may not be a concern based
on your data growth curves, but it could be.

In addition, add another OS drive and put it into a RAID-1. If you have
server-class hardware, you'll want that extra drive. I'm frankly
surprised you were even able to acquire a dual Xeon class server without
a RAID-1 for OS data by default.

I'm not sure if you've done metrics or not, but XFS performance is
highly dependent on your init and mount options. I can give you some
guidelines there, but one of the major changes is that the Linux 3.X
kernels have some impressive performance improvements you won't see
using CentOS 6.2. Metadata in particular has undergone a massive upgrade
that drastically enhances its parallel scalability on metadata
modifications.

If possible, you might consider the new Ubuntu 12.04 LTS that's coming
out soon. It should have the newer XFS performance. If not, consider
injecting a newer kernel to the CentOS 6.2 install. And again, testing
is the only way to know for sure.

And test with pgbench, if possible. I used this to get our XFS init and
mount options, along with other OS/kernel settings. You can have very
different performance metrics from dd/bonnie than an actual use pattern
from real DB usage. As a hint, before you run any of these tests, both
write a '3' to /proc/sys/vm/drop_caches, and restart your PG instance.
You want to test your drives, not your memory. :)

> kernel.shmall = 4,294,967,296 (commas added for clarity)
> kernel.shmax = 68,719,476,736 (commas added for clarity)
> kernel.sem = 250 32000 32 128
> vm.swappiness = 0
> dirty_ratio = 10
> dirty_background_ratio = 5

Good. Though you might consider lowering dirty_background_ratio. At that
setting, it won't even try to write out data until you have about 3GB of
dirty pages. Even high-end disk controllers only have 1GB of local
capacitor-backed cache. If you really do have a good SAN, it probably
has more than that, but try to induce a high-turnover database test to
see what happens during heavy IO. Like, a heavy long-running PG-bench
should invoke several checkpoints and also flood the local write cache.
When that happens, monitor /proc/meminfo. Like this:

grep -A1 Dirty /proc/meminfo

That will tell you how much of your memory is dirty, but the 'Writeback'
entry is what you care about. If you see that as a non-zero value for
more than one consecutive check, you've saturated your write bandwidth
to the point performance will suffer. But the only way you can really
know any of this is with testing. Some SANs scale incredibly well to
large pool flushes, and others don't.

Also, make iostat your friend. Particularly with the -x option. During
your testing, keep one of these running in the background for the
devices on your SAN. Watch your %util column in particular. Graph it, if
you can. You can almost build a complete performance profile for
different workloads before you put a single byte of real data on this
hardware.

> If there are "obviously correct" choices in PG configuration, this would
> be tremendously helpful information to me. I'm planning on using pgbench
> to test the configuration options.

You sound like you've read up on this quite a bit. Greg's book is a very
good thing to have and learn from. It'll cover all the basics about the
postgresql.conf file. I don't see how I could add much to that, so just
pay attention to what he says. :)

--
Shaun Thomas
OptionsHouse | 141 W. Jackson Blvd. | Suite 500 | Chicago IL, 60604
312-444-8534
sthomas@peak6.com

______________________________________________

See http://www.peak6.com/email_disclaimer/ for terms and conditions related to this email
On Tue, Apr 24, 2012 at 1:32 PM, Shaun Thomas <sthomas@peak6.com> wrote:
The processors are Intel(R) Xeon(R) CPU X5650 @ 2.67GHz.
Is there a way to tell what the BIOS power-down settings are for the cores from the CLI?
After reading Richard Foote's articles that Robert Klemme referenced in the previous post, I'm convinced.
Agreed.
Alas, a 3.x Linux kernel would be nice but I'm stuck with CentOS 6.2 on 2.6.32. I would very much appreciate any guidelines you can provide.
Yes; that does seem important. I found this:
http://git.kernel.org/?p=linux/kernel/git/torvalds/linux-2.6.git;a=blob;f=Documentation/filesystems/xfs.txt;hb=HEAD
which and while I was planning to set 'noatime', I'm a bit stumped on most of the rest. Anyone with comparable hardware willing to share their settings as a starting point for my testing?
I'm doing my best but the numbers will tell the story. :-)
Thanks for your review and feedback, Shaun.
Cheers,
Jan
On 04/23/2012 09:56 PM, Jan Nielsen wrote:This is a pretty good build. Nice and middle-of-the-road for current hardware. I think it's probably relevant what your "24 cores across 2 sockets" are, though. Then again, based on the 24-cores, I have to assume you've got hex-core Xeons of some sort, with hyperthreading. That suggests a higher end Sandy Bridge Xeon, like the X5645 or higher. If that's the case, you're in good hands.The new hardware for the 50GB PG 9.0 machine is:
* 24 cores across 2 sockets
* 64 GB RAM
* 10 x 15k SAS drives on SAN
* 1 x 15k SAS drive local
* CentOS 6.2 (2.6.32 kernel)
The processors are Intel(R) Xeon(R) CPU X5650 @ 2.67GHz.
As a note, though... make sure you enable Turbo and other performance settings (disable power-down of unused CPUs, etc) in the BIOS when setting this up. We found that the defaults for the CPUs did not allow processor scaling, and it was far too aggressive in cycling down cores, such that cycling them back up had a non-zero cost. We saw roughly a 20% improvement by forcing the CPUs into full online performance mode.
Is there a way to tell what the BIOS power-down settings are for the cores from the CLI?
We are considering the following drive allocations:Please don't do this. If you have the system you just described, give yourself an 8x RAID10, and the 2x RAID1. I've found that your indexes will generally be about 1/3 to 1/2 the total sixe of your database. So, not only does your data partition lose read spindles, but you've wasted 1/2 to 2/3s of your active drive space. This may not be a concern based on your data growth curves, but it could be.
* 4 x 15k SAS drives, XFS, RAID 10 on SAN for PG data
* 4 x 15k SAS drives, XFS, RAID 10 on SAN for PG indexes
* 2 x 15k SAS drives, XFS, RAID 1 on SAN for PG xlog
* 1 x 15k SAS drive, XFS, on local storage for OS
After reading Richard Foote's articles that Robert Klemme referenced in the previous post, I'm convinced.
In addition, add another OS drive and put it into a RAID-1. If you have server-class hardware, you'll want that extra drive. I'm frankly surprised you were even able to acquire a dual Xeon class server without a RAID-1 for OS data by default.
Agreed.
I'm not sure if you've done metrics or not, but XFS performance is highly dependent on your init and mount options. I can give you some guidelines there, but one of the major changes is that the Linux 3.X kernels have some impressive performance improvements you won't see using CentOS 6.2. Metadata in particular has undergone a massive upgrade that drastically enhances its parallel scalability on metadata modifications.
Alas, a 3.x Linux kernel would be nice but I'm stuck with CentOS 6.2 on 2.6.32. I would very much appreciate any guidelines you can provide.
If possible, you might consider the new Ubuntu 12.04 LTS that's coming out soon. It should have the newer XFS performance. If not, consider injecting a newer kernel to the CentOS 6.2 install. And again, testing is the only way to know for sure.
And test with pgbench, if possible. I used this to get our XFS init and mount options, along with other OS/kernel settings.
Yes; that does seem important. I found this:
http://git.kernel.org/?p=linux/kernel/git/torvalds/linux-2.6.git;a=blob;f=Documentation/filesystems/xfs.txt;hb=HEAD
which and while I was planning to set 'noatime', I'm a bit stumped on most of the rest. Anyone with comparable hardware willing to share their settings as a starting point for my testing?
You can have very different performance metrics from dd/bonnie than an actual use pattern from real DB usage. As a hint, before you run any of these tests, both write a '3' to /proc/sys/vm/drop_caches, and restart your PG instance. You want to test your drives, not your memory. :)Good. Though you might consider lowering dirty_background_ratio. At that setting, it won't even try to write out data until you have about 3GB of dirty pages. Even high-end disk controllers only have 1GB of local capacitor-backed cache. If you really do have a good SAN, it probably has more than that, but try to induce a high-turnover database test to see what happens during heavy IO. Like, a heavy long-running PG-bench should invoke several checkpoints and also flood the local write cache. When that happens, monitor /proc/meminfo. Like this:kernel.shmall = 4,294,967,296 (commas added for clarity)
kernel.shmax = 68,719,476,736 (commas added for clarity)
kernel.sem = 250 32000 32 128
vm.swappiness = 0
dirty_ratio = 10
dirty_background_ratio = 5
grep -A1 Dirty /proc/meminfo
That will tell you how much of your memory is dirty, but the 'Writeback' entry is what you care about. If you see that as a non-zero value for more than one consecutive check, you've saturated your write bandwidth to the point performance will suffer. But the only way you can really know any of this is with testing. Some SANs scale incredibly well to large pool flushes, and others don't.
Also, make iostat your friend. Particularly with the -x option. During your testing, keep one of these running in the background for the devices on your SAN. Watch your %util column in particular. Graph it, if you can. You can almost build a complete performance profile for different workloads before you put a single byte of real data on this hardware.You sound like you've read up on this quite a bit. Greg's book is a very good thing to have and learn from. It'll cover all the basics about the postgresql.conf file. I don't see how I could add much to that, so just pay attention to what he says. :)If there are "obviously correct" choices in PG configuration, this would
be tremendously helpful information to me. I'm planning on using pgbench
to test the configuration options.
I'm doing my best but the numbers will tell the story. :-)
Thanks for your review and feedback, Shaun.
Cheers,
Jan
--
Shaun Thomas
OptionsHouse | 141 W. Jackson Blvd. | Suite 500 | Chicago IL, 60604
312-444-8534
sthomas@peak6.com
______________________________________________
See http://www.peak6.com/email_disclaimer/ for terms and conditions related to this email
Oopps; looping in the list...
On Tue, Apr 24, 2012 at 8:57 PM, Jan Nielsen <jan.sture.nielsen@gmail.com> wrote:
On Tue, Apr 24, 2012 at 8:57 PM, Jan Nielsen <jan.sture.nielsen@gmail.com> wrote:
On Mon, Apr 23, 2012 at 11:53 PM, Robert Klemme <shortcutter@googlemail.com> wrote:On Tue, Apr 24, 2012 at 4:56 AM, Jan NielsenIs it established practice in the Postgres world to separate indexes
<jan.sture.nielsen@gmail.com> wrote:
> We are considering the following drive allocations:
>
> * 4 x 15k SAS drives, XFS, RAID 10 on SAN for PG data
> * 4 x 15k SAS drives, XFS, RAID 10 on SAN for PG indexes
> * 2 x 15k SAS drives, XFS, RAID 1 on SAN for PG xlog
> * 1 x 15k SAS drive, XFS, on local storage for OS
from tables? I would assume that the reasoning of Richard Foote -
albeit for Oracle databases - is also true for Postgres:
http://richardfoote.wordpress.com/2008/04/16/separate-indexes-from-tables-some-thoughts-part-i-everything-in-its-right-place/
http://richardfoote.wordpress.com/2008/04/18/separate-indexes-from-tables-some-thoughts-part-ii-there-there/
http://richardfoote.wordpress.com/2008/04/28/indexes-in-their-own-tablespace-availabilty-advantages-is-there-anybody-out-there/Very nice articles!Conversely if you lump both on a single volume you have more
flexibility with regard to usage - unless of course you can
dynamically resize volumes.Agreed.To me it also seems like a good idea to mirror local disk with OS and
database software because if that fails you'll get downtime as well.
As of now you have a single point of failure there.Agreed as well.These are good improvements - thanks for the review and references, Robert.Cheers,Jan
Kind regards
robert
--
remember.guy do |as, often| as.you_can - without end
http://blog.rubybestpractices.com/
--
Sent via pgsql-performance mailing list (pgsql-performance@postgresql.org)
To make changes to your subscription:
http://www.postgresql.org/mailpref/pgsql-performance
-----BEGIN PGP SIGNED MESSAGE-----
Hash: RIPEMD160


> Is it established practice in the Postgres world to separate indexes
> from tables?  I would assume that the reasoning of Richard Foote -
> albeit for Oracle databases - is also true for Postgres:

Yes, it's an established practice. I'd call it something just short of
a best practice though, as it really depends on your situation. I'd
take those articles with a grain of salt, as they are very
Oracle-specific (e.g. we do not have fat indexes (yet!), nor segments).
I also find his examples a bit contrived, and the whole "multi-user"
argument irrelevant for common cases. I lean towards using separate
tablespaces in Postgres, as the performance outweighs the additional
complexity. It's down on the tuning list however: much more important
is getting your kernel/volumes configured correctly, allocating
shared_buffers sanely, separating pg_xlog, etc.

- --
Greg Sabino Mullane greg@turnstep.com
End Point Corporation http://www.endpoint.com/
PGP Key: 0x14964AC8 201204251304
http://biglumber.com/x/web?pk=2529DF6AB8F79407E94445B4BC9B906714964AC8
-----BEGIN PGP SIGNATURE-----

iEYEAREDAAYFAk+YL08ACgkQvJuQZxSWSsjR0wCfRF0fXpn7C7i5bZ6btDCT3+uX
DU4AoIN3oSwPR+10F1N3jupCj5Dthjfh
=EYGQ
-----END PGP SIGNATURE-----
On Wed, Apr 25, 2012 at 7:08 PM, Greg Sabino Mullane <greg@turnstep.com> wrote:

>> Is it established practice in the Postgres world to separate indexes
>> from tables?  I would assume that the reasoning of Richard Foote -
>> albeit for Oracle databases - is also true for Postgres:
>
> Yes, it's an established practice. I'd call it something just short of
> a best practice though, as it really depends on your situation.

What are the benefits?

> I'd
> take those articles with a grain of salt, as they are very
> Oracle-specific (e.g. we do not have fat indexes (yet!), nor segments).

True.  As far as I understand disk layout segments in Oracle serve the
purpose to cluster data for a database object.  With that feature
missing the situation would be worse in Postgres - unless you manually
do something similar by using tablespaces for that.

> I also find his examples a bit contrived, and the whole "multi-user"
> argument irrelevant for common cases.

Why is that?

> I lean towards using separate
> tablespaces in Postgres, as the performance outweighs the additional
> complexity.

What about his argument with regards to access patterns (i.e.
interleaving index and table access during an index scan)?  Also,
Shaun's advice to have more spindles available sounds convincing to
me, too.

> It's down on the tuning list however: much more important
> is getting your kernel/volumes configured correctly, allocating
> shared_buffers sanely, separating pg_xlog, etc.

That does make a lot of sense.  Separating pg_xlog would probably the
first thing I'd do especially since the IO pattern is so dramatically
different from tablespace IO access patterns.

Kind regards

robert

--
remember.guy do |as, often| as.you_can - without end
http://blog.rubybestpractices.com/
On 04/25/2012 02:46 AM, John Lister wrote:

> Hi, I'd be grateful if you could share any XFS performance tweaks as I'm
> not entirely sure I'm getting the most out of my setup and any
> additional guidance would be very helpful.

Ok, I'll give this with a huge caveat: these settings came from lots of
testing, both load and pgbench based. I'll explain as much as I can.

For initializing the XFS filesystem, you can take advantage of a few
settings that are pretty handy.

* -d agcount=256 - Higher amount of allocation groups works better with
multi-CPU systems. We used 256, but you'll want to do tests to confirm
this. The point is that you can have several threads writing to the
filesystem simultaneously.

* -l lazy-count=1 - Log data is written more efficiently. Gives a
measurable performance boost. Newer versions set this, but CentOS 5 has
the default to 0. I'm not sure about CentOS 6. Just enable it. :)

* -l version=2 - Forces the most recent version of the logging
algorithm; allows a larger log buffer on mount. Since you're using
CentOS, the default value is still probably 1, which you don't want.

And then there are the mount options. These actually seemed to make more
of an impact in our testing:

* allocsize=256m - Database files are up to 1GB in size. To prevent
fragmentation, always pre-allocate in 256MB chunks. In recent 3.0+
kernels, this setting will result in phantom storage allocation as each
file is initially allocated with 256MB until all references have exited
memory. Due to aggressive Linux inode cache behavior, this may not
happen for several hours. On 3.0 kernels, this setting should be
removed. I think the 2.6.35 kernel had this backported, so *TEST THIS
SETTING BEFORE USING IT!*

* logbufs=8 - Forces more of the log buffer to remain in RAM, improving
file deletion performance. Good for temporary files. XFS often gets
knocked for file deletion performance, and this brings it way up. Not
really an issue with PG usage, but handy anyway. See logbsize.

* logbsize=256k - Larger log buffers keep track of modified files in
memory for better performance. See logbufs.

* noatime - Negates touching the disk for file accesses. Reduces disk IO.

* attr2 - Opportunistic improvement in the way inline extended
attributes are stored on-disk. Not strictly necessary, but handy.


I'm hoping someone else will pipe in, because these settings are pretty
"old" and based on a CentOS 5.5 setup. I haven't done any metrics on the
newer kernels, but I have followed enough to know allocsize is dangerous
on new systems.

Your mileage may vary. :)

--
Shaun Thomas
OptionsHouse | 141 W. Jackson Blvd. | Suite 500 | Chicago IL, 60604
312-444-8534
sthomas@peak6.com

______________________________________________

See http://www.peak6.com/email_disclaimer/ for terms and conditions related to this email
On 04/23/2012 10:56 PM, Jan Nielsen wrote:
> We are planning to rebuild our production 50GB PG 9.0 database serving
> our application platform on the new hardware below. The web-applications
> are 80/20 read/write and the data gateways are even mix 50/50
> read/write; one of the gateways nightly exports & imports ~20% of our
> data.

With enough RAM to hold the database, but that much churn in the nightly
processing, you're most likely to run into VACUUM issues here.  The
trigger point for autovacuum to kick off is at just around 20%, so you
might see problems come and go based on the size of the changed set.
You might consider making your own benchmark test out of a change like
the gateway introduces.  Consider doing your own manual VACUUM or maybe
even VACUUM FREEZE cleanup in sync with the nightly processing if you
want that to be predictable.

> If there are "obviously correct" choices in PG configuration, this would
> be tremendously helpful information to me. I'm planning on using pgbench
> to test the configuration options.

The info at
http://wiki.postgresql.org/wiki/Tuning_Your_PostgreSQL_Server is as
useful a checklist for getting started as any.  Note that pgbench is a
very insensitive tool for testing configuration changes usefully.
Results there will bounce around if you change shared_buffers and
checkpoint_segments, but not much else.  And even the changes that test
positive with it don't necessarily translate into better real-world
performance.  For example, you might set shared_buffers to 8GB based on
pgbench TPS numbers going up as it increases, only to find that allows
way too much memory to get dirty between a checkpoint in
production--resulting in slow periods on the server.

And many of the more interesting and tricky parameters to try and tweak
in production, such as work_mem, don't even matter to what pgbench does.
  It's easy to get lost trying pgbench tests without making clear
forward progress for weeks.  Once you've validated the hardware seems to
be delivering reasonable performance, consider running your own more
application-like benchmarks instead.

--
Greg Smith   2ndQuadrant US    greg@2ndQuadrant.com   Baltimore, MD
PostgreSQL Training, Services, and 24x7 Support www.2ndQuadrant.com
On 24/04/2012 20:32, Shaun Thomas wrote:
>
> I'm not sure if you've done metrics or not, but XFS performance is
> highly dependent on your init and mount options. I can give you some
> guidelines there, but one of the major changes is that the Linux 3.X
> kernels have some impressive performance improvements you won't see
> using CentOS 6.2. Metadata in particular has undergone a massive
> upgrade that drastically enhances its parallel scalability on metadata
> modifications.
Hi, I'd be grateful if you could share any XFS performance tweaks as I'm
not entirely sure I'm getting the most out of my setup and any
additional guidance would be very helpful.

Thanks

John

--
www.pricegoblin.co.uk
Below is the hardware, firmware, OS, and PG configuration pieces that I'm settling in on. As was noted, the local storage used for OS is actually two disks with RAID 10. If anything appears like a mistake or something is missing, I'd appreciate the feedback.
I'm still working on the benchmarks scripts and I don't have good/reliable numbers yet since our SAN is still very busy reconfiguring from the 2x4 to 1x8. I'm hoping to get them running tomorrow when the SAN should complete its 60 hours of reconfiguration.
Thanks, again, for all the great feedback.
Cheers,
Jan
*System* HP ProLiant BL460c G7
*BIOS* HP I27 05/05/2011
*CPU Sockets* 2
*Chips* Intel(R) Xeon(R) CPU X5650 @ 2.67GHz
Intel(R) Xeon(R) CPU X5650 @ 2.67GHz
*CPU Cores* 24
*Kernel Name* Linux
*Kernel Version* 2.6.32-220.el6.x86_64
*Machine Platform* x86_64
*Processor Type* x86_64
*Operating System* GNU/Linux
*Distribution* CentOS release 6.2 (Final)
*Write barriers* libata version 3.00 loaded.
*MemTotal* 49410668kB
*PAGE_SIZE* 4096
*_PHYS_PAGES* 12352667
*kernel.shmall* 6176333
*kernel.shmmax* 25298259968
*kernel.sem* 250 32000 32 128
*vm.swappiness* 0
*vm.overcommit_memory* 2
*dirty_ratio* 5
*dirty_background_ratio* 2
300GB RAID10 2x15k drive for OS on local storage
*/dev/sda1 RA* 4096
*/dev/sda1 FS* ext4
*/dev/sda1 MO*
600GB RAID 10 8x15k drive for $PGDATA on SAN
*IO Scheduler sda* noop anticipatory deadline [cfq]
*/dev/sdb1 RA* 4096
*/dev/sdb1 FS* xfs
*/dev/sdb1 MO* allocsize=256m,attr2,logbufs=8,logbsize=256k,noatime
300GB RAID 10 2x15k drive for $PGDATA/pg_xlog on SAN
*IO Scheduler sdb* noop anticipatory deadline [cfq]
*/dev/sde1 RA* 4096
*/dev/sde1 FS* xfs
*/dev/sde1 MO* allocsize=256m,attr2,logbufs=8,logbsize=256k,noatime
*IO Scheduler sde* noop anticipatory deadline [cfq]
PG Configuration
*PG shared_buffers* 16GB
*PG log_line_prefix* '%t:%u@%r=>%d:[%p]: '
*PG log_statement* ddl
*PG log_min_duration_statement* 1s
*PG listen_addresses* *
*PG checkpoint_segments* 32
*PG checkpoint_completion_target* 0.9
*PG max_connections* 100
*PG max_fsm_relations*
*PG max_fsm_pages*
*PG wal_buffers* 16MB
*PG wal_sync_method* open_sync
*PG effective_cache_size* 32GB
*PG random_page_cost* 4
*PG constraint_exclusion* partition
*PG work_mem* 64MB
*PG maintenance_work_mem* 2GB
On Wed, Apr 25, 2012 at 3:29 PM, Shaun Thomas <sthomas@peak6.com> wrote:
>
> On 04/25/2012 02:46 AM, John Lister wrote:
>
>> Hi, I'd be grateful if you could share any XFS performance tweaks as I'm
>> not entirely sure I'm getting the most out of my setup and any
>> additional guidance would be very helpful.
>
>
> Ok, I'll give this with a huge caveat: these settings came from lots of testing, both load and pgbench based. I'll explain as much as I can.
>
> For initializing the XFS filesystem, you can take advantage of a few settings that are pretty handy.
>
> * -d agcount=256 - Higher amount of allocation groups works better with multi-CPU systems. We used 256, but you'll want to do tests to confirm this. The point is that you can have several threads writing to the filesystem simultaneously.
>
> * -l lazy-count=1 - Log data is written more efficiently. Gives a measurable performance boost. Newer versions set this, but CentOS 5 has the default to 0. I'm not sure about CentOS 6. Just enable it. :)
>
> * -l version=2 - Forces the most recent version of the logging algorithm; allows a larger log buffer on mount. Since you're using CentOS, the default value is still probably 1, which you don't want.
>
> And then there are the mount options. These actually seemed to make more of an impact in our testing:
>
> * allocsize=256m - Database files are up to 1GB in size. To prevent fragmentation, always pre-allocate in 256MB chunks. In recent 3.0+ kernels, this setting will result in phantom storage allocation as each file is initially allocated with 256MB until all references have exited memory. Due to aggressive Linux inode cache behavior, this may not happen for several hours. On 3.0 kernels, this setting should be removed. I think the 2.6.35 kernel had this backported, so *TEST THIS SETTING BEFORE USING IT!*
>
> * logbufs=8 - Forces more of the log buffer to remain in RAM, improving file deletion performance. Good for temporary files. XFS often gets knocked for file deletion performance, and this brings it way up. Not really an issue with PG usage, but handy anyway. See logbsize.
>
> * logbsize=256k - Larger log buffers keep track of modified files in memory for better performance. See logbufs.
>
> * noatime - Negates touching the disk for file accesses. Reduces disk IO.
>
> * attr2 - Opportunistic improvement in the way inline extended attributes are stored on-disk. Not strictly necessary, but handy.
>
>
> I'm hoping someone else will pipe in, because these settings are pretty "old" and based on a CentOS 5.5 setup. I haven't done any metrics on the newer kernels, but I have followed enough to know allocsize is dangerous on new systems.
>
> Your mileage may vary. :)
>
>
> --
> Shaun Thomas
> OptionsHouse | 141 W. Jackson Blvd. | Suite 500 | Chicago IL, 60604
> 312-444-8534
> sthomas@peak6.com
>
> ______________________________________________
>
> See http://www.peak6.com/email_disclaimer/ for terms and conditions related to this email
>
> --
> Sent via pgsql-performance mailing list (pgsql-performance@postgresql.org)
> To make changes to your subscription:
> http://www.postgresql.org/mailpref/pgsql-performance
On 03/05/2012 03:10, Jan Nielsen wrote:
I was wondering if it would be better to put the xlog on the same disk as the OS? Apart from the occasional log writes I'd have thought most OS data is loaded into cache at the beginning, so you effectively have an unused disk. This gives you another spindle (mirrored) for your data.
Or have I missed something fundamental?
300GB RAID10 2x15k drive for OS on local storage
*/dev/sda1 RA* 4096
*/dev/sda1 FS* ext4
*/dev/sda1 MO*
600GB RAID 10 8x15k drive for $PGDATA on SAN
*IO Scheduler sda* noop anticipatory deadline [cfq]
*/dev/sdb1 RA* 4096
*/dev/sdb1 FS* xfs
*/dev/sdb1 MO* allocsize=256m,attr2,logbufs=8,logbsize=256k,noatime
300GB RAID 10 2x15k drive for $PGDATA/pg_xlog on SAN
*IO Scheduler sdb* noop anticipatory deadline [cfq]
*/dev/sde1 RA* 4096
*/dev/sde1 FS* xfs
*/dev/sde1 MO* allocsize=256m,attr2,logbufs=8,logbsize=256k,noatime
*
I was wondering if it would be better to put the xlog on the same disk as the OS? Apart from the occasional log writes I'd have thought most OS data is loaded into cache at the beginning, so you effectively have an unused disk. This gives you another spindle (mirrored) for your data.
Or have I missed something fundamental?
--
www.pricegoblin.co.uk
Hi Jan,

On Thu, May 3, 2012 at 4:10 AM, Jan Nielsen <jan.sture.nielsen@gmail.com> wrote:
> Below is the hardware, firmware, OS, and PG configuration pieces that I'm
> settling in on. As was noted, the local storage used for OS is actually two
> disks with RAID 10. If anything appears like a mistake or something is
> missing, I'd appreciate the feedback.

You should quickly patent this solution.  As far as I know you need at
least four disks for RAID 10. :-)
http://en.wikipedia.org/wiki/RAID#Nested_.28hybrid.29_RAID

Or did you mean RAID 1?

> I'm still working on the benchmarks scripts and I don't have good/reliable
> numbers yet since our SAN is still very busy reconfiguring from the 2x4 to
> 1x8. I'm hoping to get them running tomorrow when the SAN should complete
> its 60 hours of reconfiguration.

Yeah, does not seem to make a lot of sense to test during this phase.

> Thanks, again, for all the great feedback.

You're welcome!

> 300GB RAID10 2x15k drive for OS on local storage
> */dev/sda1 RA*                                            4096
> */dev/sda1 FS*                                            ext4
> */dev/sda1 MO*

See above.

> 600GB RAID 10 8x15k drive for $PGDATA on SAN
> *IO Scheduler sda*            noop anticipatory deadline [cfq]
> */dev/sdb1 RA*                                            4096
> */dev/sdb1 FS*                                             xfs
> */dev/sdb1 MO*
> allocsize=256m,attr2,logbufs=8,logbsize=256k,noatime
>
> 300GB RAID 10 2x15k drive for $PGDATA/pg_xlog on SAN
> *IO Scheduler sdb*            noop anticipatory deadline [cfq]
> */dev/sde1 RA*                                            4096
> */dev/sde1 FS*                                             xfs
> */dev/sde1 MO*        allocsize=256m,attr2,logbufs=8,logbsize=256k,noatime
> *IO Scheduler sde*            noop anticipatory deadline [cfq]

See above.

With regard to the scheduler, I have frequently read that [deadline]
and [noop] perform better for PG loads.  Fortunately this can be
easily changed.

Maybe this also has some additional input:
http://www.fccps.cz/download/adv/frr/hdd/hdd.html

On Thu, May 3, 2012 at 8:54 AM, John Lister <john.lister@kickstone.co.uk> wrote:
> I was wondering if it would be better to put the xlog on the same disk as
> the OS? Apart from the occasional log writes I'd have thought most OS data
> is loaded into cache at the beginning, so you effectively have an unused
> disk. This gives you another spindle (mirrored) for your data.
>
> Or have I missed something fundamental?

Separating avoids interference between OS and WAL logging (i.e. a
script running berserk and filling OS filesystem).  Also it's easier
to manage (e.g. in case of relocation to another volume etc.).  And
you can have different mount options (i.e. might want to have atime
for OS volume).

Kind regards

robert


--
remember.guy do |as, often| as.you_can - without end
http://blog.rubybestpractices.com/
Hi Robert,
On Thu, May 3, 2012 at 1:28 AM, Robert Klemme <shortcutter@googlemail.com> wrote:
Ugh - yeah - sorry. RAID-1 for the 2-disk OS and WAL.
Correction: RAID-1 on the 2x15k local storage device for OS
Clarification: RAID-10 on the 8x15k SAN device for $PGDATA
Correction: RAID-1 on the 2x15k SAN device for $PGDATA/pg_log
Thanks for the reference, Robert.
Hi Jan,You should quickly patent this solution. As far as I know you need at
On Thu, May 3, 2012 at 4:10 AM, Jan Nielsen <jan.sture.nielsen@gmail.com> wrote:
> Below is the hardware, firmware, OS, and PG configuration pieces that I'm
> settling in on. As was noted, the local storage used for OS is actually two
> disks with RAID 10. If anything appears like a mistake or something is
> missing, I'd appreciate the feedback.
least four disks for RAID 10. :-)
http://en.wikipedia.org/wiki/RAID#Nested_.28hybrid.29_RAID
Or did you mean RAID 1?
Ugh - yeah - sorry. RAID-1 for the 2-disk OS and WAL.
> I'm still working on the benchmarks scripts and I don't have good/reliableYeah, does not seem to make a lot of sense to test during this phase.
> numbers yet since our SAN is still very busy reconfiguring from the 2x4 to
> 1x8. I'm hoping to get them running tomorrow when the SAN should complete
> its 60 hours of reconfiguration.You're welcome!
> Thanks, again, for all the great feedback.
> 300GB RAID10 2x15k drive for OS on local storage
Correction: RAID-1 on the 2x15k local storage device for OS
> */dev/sda1 RA* 4096See above.
> */dev/sda1 FS* ext4
> */dev/sda1 MO*
> 600GB RAID 10 8x15k drive for $PGDATA on SAN
Clarification: RAID-10 on the 8x15k SAN device for $PGDATA
> *IO Scheduler sda* noop anticipatory deadline [cfq]
> */dev/sdb1 RA* 4096
> */dev/sdb1 FS* xfs
> */dev/sdb1 MO*
> allocsize=256m,attr2,logbufs=8,logbsize=256k,noatime
>
> 300GB RAID 10 2x15k drive for $PGDATA/pg_xlog on SAN
Correction: RAID-1 on the 2x15k SAN device for $PGDATA/pg_log
> *IO Scheduler sdb* noop anticipatory deadline [cfq]See above.
> */dev/sde1 RA* 4096
> */dev/sde1 FS* xfs
> */dev/sde1 MO* allocsize=256m,attr2,logbufs=8,logbsize=256k,noatime
> *IO Scheduler sde* noop anticipatory deadline [cfq]
With regard to the scheduler, I have frequently read that [deadline]
and [noop] perform better for PG loads. Fortunately this can be
easily changed.
Maybe this also has some additional input:
http://www.fccps.cz/download/adv/frr/hdd/hdd.html
Thanks for the reference, Robert.
On Thu, May 3, 2012 at 8:54 AM, John Lister <john.lister@kickstone.co.uk> wrote:Separating avoids interference between OS and WAL logging (i.e. a
> I was wondering if it would be better to put the xlog on the same disk as
> the OS? Apart from the occasional log writes I'd have thought most OS data
> is loaded into cache at the beginning, so you effectively have an unused
> disk. This gives you another spindle (mirrored) for your data.
>
> Or have I missed something fundamental?
script running berserk and filling OS filesystem). Also it's easier
to manage (e.g. in case of relocation to another volume etc.). And
you can have different mount options (i.e. might want to have atime
for OS volume).
Kind regards
robert
--
remember.guy do |as, often| as.you_can - without end
http://blog.rubybestpractices.com/
On Thu, May 3, 2012 at 7:05 AM, Shaun Thomas <sthomas@optionshouse.com> wrote:
Thanks for the reference, Shaun.
That sounds interesting. How do you identify a page flush storm?
Cool - thanks, again, for the review, Shaun.
Cheers,
Jan
I like to follow this:
http://www.westnet.com/~gsmith/content/linux-pdflush.htm
Thanks for the reference, Shaun.
As a note, there are actually new tunables for some of this: dirty_bytes, and dirty_background_bytes. With them, you can match them better to the actual size of your controller write cache so you can avoid page flush storms causing IO stalls.
That sounds interesting. How do you identify a page flush storm?
Mr. Nielsen's setup actually looks pretty darn good. It's my personal opinion he might run into some IO waits if he plans to use this for heavy OLTP, thanks to having only 8 spindles in his RAID1+0, but he may eventually grow into a SAN. That's fine. It's a good starting point.
Cool - thanks, again, for the review, Shaun.
Cheers,
Jan
sthomas@optionshouse.com
______________________________________________
See http://www.peak6.com/email_disclaimer/ for terms and conditions related to this email
Hi John,
On Thu, May 3, 2012 at 12:54 AM, John Lister <john.lister@kickstone.co.uk> wrote:
I followed Gregory Smith's arguments from PostgreSQL 9.0 High Performance, wherein he notes that WAL is sequential with constant cache flushes whereas OS is a mix of sequential and random with rare cache flushes. This (might) lead one to conclude that separating these would be good for at least the WAL and likely both. Regardless, separating these very different use-patterns seems like a "Good Thing" if tuning is ever needed for either.
Cheers,
Jan
On 03/05/2012 03:10, Jan Nielsen wrote:I was wondering if it would be better to put the xlog on the same disk as the OS? Apart from the occasional log writes I'd have thought most OS data is loaded into cache at the beginning, so you effectively have an unused disk. This gives you another spindle (mirrored) for your data.
300GB RAID10 2x15k drive for OS on local storage
*/dev/sda1 RA* 4096
*/dev/sda1 FS* ext4
*/dev/sda1 MO*
600GB RAID 10 8x15k drive for $PGDATA on SAN
*IO Scheduler sda* noop anticipatory deadline [cfq]
*/dev/sdb1 RA* 4096
*/dev/sdb1 FS* xfs
*/dev/sdb1 MO* allocsize=256m,attr2,logbufs=8,logbsize=256k,noatime
300GB RAID 10 2x15k drive for $PGDATA/pg_xlog on SAN
*IO Scheduler sdb* noop anticipatory deadline [cfq]
*/dev/sde1 RA* 4096
*/dev/sde1 FS* xfs
*/dev/sde1 MO* allocsize=256m,attr2,logbufs=8,logbsize=256k,noatime
*
Or have I missed something fundamental?
I followed Gregory Smith's arguments from PostgreSQL 9.0 High Performance, wherein he notes that WAL is sequential with constant cache flushes whereas OS is a mix of sequential and random with rare cache flushes. This (might) lead one to conclude that separating these would be good for at least the WAL and likely both. Regardless, separating these very different use-patterns seems like a "Good Thing" if tuning is ever needed for either.
Cheers,
Jan
On Thu, May 3, 2012 at 6:42 AM, Jan Nielsen <jan.sture.nielsen@gmail.com> wrote:
> Hi John,
>
> On Thu, May 3, 2012 at 12:54 AM, John Lister <john.lister@kickstone.co.uk>
> wrote:
>>
>> On 03/05/2012 03:10, Jan Nielsen wrote:
>>
>>
>> 300GB RAID10 2x15k drive for OS on local storage
>> */dev/sda1 RA*                                            4096
>> */dev/sda1 FS*                                            ext4
>> */dev/sda1 MO*
>>
>> 600GB RAID 10 8x15k drive for $PGDATA on SAN
>> *IO Scheduler sda*            noop anticipatory deadline [cfq]
>> */dev/sdb1 RA*                                            4096
>> */dev/sdb1 FS*                                             xfs
>> */dev/sdb1 MO*
>> allocsize=256m,attr2,logbufs=8,logbsize=256k,noatime
>>
>> 300GB RAID 10 2x15k drive for $PGDATA/pg_xlog on SAN
>> *IO Scheduler sdb*            noop anticipatory deadline [cfq]
>> */dev/sde1 RA*                                            4096
>> */dev/sde1 FS*                                             xfs
>> */dev/sde1 MO*        allocsize=256m,attr2,logbufs=8,logbsize=256k,noatime
>> *
>>
>>
>> I was wondering if it would be better to put the xlog on the same disk as
>> the OS? Apart from the occasional log writes I'd have thought most OS data
>> is loaded into cache at the beginning, so you effectively have an unused
>> disk. This gives you another spindle (mirrored) for your data.
>>
>> Or have I missed something fundamental?
>
>
> I followed Gregory Smith's arguments from PostgreSQL 9.0 High Performance,
> wherein he notes that WAL is sequential with constant cache flushes whereas
> OS is a mix of sequential and random with rare cache flushes. This (might)
> lead one to conclude that separating these would be good for at least the
> WAL and likely both. Regardless, separating these very different
> use-patterns seems like a "Good Thing" if tuning is ever needed for either.

Another consideration is journaling vs. non-journaling file systems.
If the WAL is on its own file system (not necessarily its own
spindle), you can use a non-journaling file system like ext2.  The WAL
is actually quite small and is itself a journal, so there's no reason
to use a journaling file system.  On the other hand, you don't want
the operating system on ext2 because it takes a long time to recover
from a crash.

I think you're right about the OS: once it starts, there is very
little disk activity.  I'd say put both on the same disk but on
different partitions.  The OS can use ext4 or some other modern
journaling file system, and the WAL can use ext2.  This also means you
can put the WAL on the outer (fastest) part of the disk and leave the
slow inner tracks for the OS.

Craig
On 5/3/12 8:46 AM, "Craig James" <cjames@emolecules.com> wrote:

>On Thu, May 3, 2012 at 6:42 AM, Jan Nielsen <jan.sture.nielsen@gmail.com>
>wrote:
>> Hi John,
>>
>> On Thu, May 3, 2012 at 12:54 AM, John Lister
>><john.lister@kickstone.co.uk>
>> wrote:
>>>
>>> On 03/05/2012 03:10, Jan Nielsen wrote:
>>>
>>>
>>> 300GB RAID10 2x15k drive for OS on local storage
>>> */dev/sda1 RA*                                            4096
>>> */dev/sda1 FS*                                            ext4
>>> */dev/sda1 MO*
>>>
>>> 600GB RAID 10 8x15k drive for $PGDATA on SAN
>>> *IO Scheduler sda*            noop anticipatory deadline [cfq]
>>> */dev/sdb1 RA*                                            4096
>>> */dev/sdb1 FS*                                             xfs
>>> */dev/sdb1 MO*
>>> allocsize=256m,attr2,logbufs=8,logbsize=256k,noatime
>>>
>>> 300GB RAID 10 2x15k drive for $PGDATA/pg_xlog on SAN
>>> *IO Scheduler sdb*            noop anticipatory deadline [cfq]
>>> */dev/sde1 RA*                                            4096
>>> */dev/sde1 FS*                                             xfs
>>> */dev/sde1 MO*
>>>allocsize=256m,attr2,logbufs=8,logbsize=256k,noatime
>>> *
>>>
>>>
>>> I was wondering if it would be better to put the xlog on the same disk
>>>as
>>> the OS? Apart from the occasional log writes I'd have thought most OS
>>>data
>>> is loaded into cache at the beginning, so you effectively have an
>>>unused
>>> disk. This gives you another spindle (mirrored) for your data.
>>>
>>> Or have I missed something fundamental?
>>
>>
>> I followed Gregory Smith's arguments from PostgreSQL 9.0 High
>>Performance,
>> wherein he notes that WAL is sequential with constant cache flushes
>>whereas
>> OS is a mix of sequential and random with rare cache flushes. This
>>(might)
>> lead one to conclude that separating these would be good for at least
>>the
>> WAL and likely both. Regardless, separating these very different
>> use-patterns seems like a "Good Thing" if tuning is ever needed for
>>either.
>
>Another consideration is journaling vs. non-journaling file systems.

Not really.   ext4 with journaling on is faster than ext2 with it off.
ext2 should never be used if ext4 is available.

If you absolutely refuse to have a journal, turn the journal in ext4 off
and have a faster and safer file system than ext2.
ext2 should never be used if ext4 is available.

>If the WAL is on its own file system (not necessarily its own
>spindle), you can use a non-journaling file system like ext2.  The WAL
>is actually quite small and is itself a journal, so there's no reason
>to use a journaling file system.  On the other hand, you don't want
>the operating system on ext2 because it takes a long time to recover
>from a crash.
>
>I think you're right about the OS: once it starts, there is very
>little disk activity.  I'd say put both on the same disk but on
>different partitions.  The OS can use ext4 or some other modern
>journaling file system, and the WAL can use ext2.  This also means you
>can put the WAL on the outer (fastest) part of the disk and leave the
>slow inner tracks for the OS.
>
>Craig
>
>--
>Sent via pgsql-performance mailing list (pgsql-performance@postgresql.org)
>To make changes to your subscription:
>http://www.postgresql.org/mailpref/pgsql-performance
On 4/25/12 2:29 PM, "Shaun Thomas" <sthomas@peak6.com> wrote:

>On 04/25/2012 02:46 AM, John Lister wrote:
>
>> Hi, I'd be grateful if you could share any XFS performance tweaks as I'm
>> not entirely sure I'm getting the most out of my setup and any
>> additional guidance would be very helpful.
>
>Ok, I'll give this with a huge caveat: these settings came from lots of
>testing, both load and pgbench based. I'll explain as much as I can.

The configured file system read-ahead is also an important factor -- how
important is sequential scan performance?  More read-ahead (up to a point)
biases your I/O for sequential throughput.  The deadline scheduler is also
biased slightly for throughput, meaning it will sacrifice some random iops
in order to get a sequential scan out of the way.

We have a couple systems that have aged a long time on XFS and ext3.  Over
time, XFS slaughters ext3.  This is due primarily to one feature:  online
defragmentation.  our ext3 systems are so horribly fragmented that
sequential scans almost no longer exist.  ext4 is supposed to be better at
preventing fragmentation, but there is no online defragmenter.   After a
parallel restore, postgres is rather fragmented.   XFS can correct that,
and disk throughput for sequential scans increases significantly after
defragmentation.   We schedule defragmentation passes nightly, which do
not take long after the initial pass.

>
>For initializing the XFS filesystem, you can take advantage of a few
>settings that are pretty handy.
>
>* -d agcount=256 - Higher amount of allocation groups works better with
>multi-CPU systems. We used 256, but you'll want to do tests to confirm
>this. The point is that you can have several threads writing to the
>filesystem simultaneously.
>
>* -l lazy-count=1 - Log data is written more efficiently. Gives a
>measurable performance boost. Newer versions set this, but CentOS 5 has
>the default to 0. I'm not sure about CentOS 6. Just enable it. :)
>
>* -l version=2 - Forces the most recent version of the logging
>algorithm; allows a larger log buffer on mount. Since you're using
>CentOS, the default value is still probably 1, which you don't want.
>
>And then there are the mount options. These actually seemed to make more
>of an impact in our testing:
>
>* allocsize=256m - Database files are up to 1GB in size. To prevent
>fragmentation, always pre-allocate in 256MB chunks. In recent 3.0+
>kernels, this setting will result in phantom storage allocation as each
>file is initially allocated with 256MB until all references have exited
>memory. Due to aggressive Linux inode cache behavior, this may not
>happen for several hours. On 3.0 kernels, this setting should be
>removed. I think the 2.6.35 kernel had this backported, so *TEST THIS
>SETTING BEFORE USING IT!*
>
>* logbufs=8 - Forces more of the log buffer to remain in RAM, improving
>file deletion performance. Good for temporary files. XFS often gets
>knocked for file deletion performance, and this brings it way up. Not
>really an issue with PG usage, but handy anyway. See logbsize.
>
>* logbsize=256k - Larger log buffers keep track of modified files in
>memory for better performance. See logbufs.
>
>* noatime - Negates touching the disk for file accesses. Reduces disk IO.
>
>* attr2 - Opportunistic improvement in the way inline extended
>attributes are stored on-disk. Not strictly necessary, but handy.
>
>
>I'm hoping someone else will pipe in, because these settings are pretty
>"old" and based on a CentOS 5.5 setup. I haven't done any metrics on the
>newer kernels, but I have followed enough to know allocsize is dangerous
>on new systems.
>
>Your mileage may vary. :)
>
>--
>Shaun Thomas
>OptionsHouse | 141 W. Jackson Blvd. | Suite 500 | Chicago IL, 60604
>312-444-8534
>sthomas@peak6.com
>
>______________________________________________
>
>See http://www.peak6.com/email_disclaimer/ for terms and conditions
>related to this email
>
>--
>Sent via pgsql-performance mailing list (pgsql-performance@postgresql.org)
>To make changes to your subscription:
>http://www.postgresql.org/mailpref/pgsql-performance
On 05/03/2012 02:28 AM, Robert Klemme wrote:

> Maybe this also has some additional input:
> http://www.fccps.cz/download/adv/frr/hdd/hdd.html

Be careful with that link. His recommendations for dirty_ratio and
dirty_background_ratio would be *very bad* in a database setting. Note
this from the actual article:

"I am aware that my tuning values are probably quite insane in some
respects, may cause occasional longer periods of high read latency, may
cause other problems. Still I guess the exercise was worth it - the
tests did show some interesting results."

That's putting it lightly. With some of those settings in a very large
memory server, you could see *minutes* of synchronous IO waits if
dirty_ratio gets saturated. I like to follow this:

http://www.westnet.com/~gsmith/content/linux-pdflush.htm

As a note, there are actually new tunables for some of this:
dirty_bytes, and dirty_background_bytes. With them, you can match them
better to the actual size of your controller write cache so you can
avoid page flush storms causing IO stalls. It's unfortunate, but
database servers are not the target platform for most of the kernel
devs, and really have a much different profile from everyday systems. We
need to address latency more than throughput, though both are important.

I think Greg mentioned something that setting these too low can cause
VACUUM to lag, but I'm willing to take that tradeoff. We've had IO
stalls in the past when our background ratio was too high, and it wasn't
pretty. Ironically, we never had a problem until we tripled our system
memory, and suddenly our drive controllers were frequently getting
choked to death.

Mr. Nielsen's setup actually looks pretty darn good. It's my personal
opinion he might run into some IO waits if he plans to use this for
heavy OLTP, thanks to having only 8 spindles in his RAID1+0, but he may
eventually grow into a SAN. That's fine. It's a good starting point.

--
Shaun Thomas
OptionsHouse | 141 W. Jackson Blvd. | Suite 500 | Chicago IL, 60604
312-444-8534
sthomas@optionshouse.com

______________________________________________

See http://www.peak6.com/email_disclaimer/ for terms and conditions related to this email
> That sounds interesting. How do you identify a page flush storm?

Maybe I used the wrong terminology. What effectively happens if you reach the amount of memory specified in
dirty_ratio,is that the system goes from asynchronous disk access, to synchronous disk access, and starts flushing that
memoryto disk. Until that operation completes, all other actions requiring disk access are paused.

You really, really don't want that to happen during a busy day on an OLTP system unless you have an absolutely
gargantuancash. We first noticed it after we upgraded from 32GB to 96GB. We have enough connections and other effects,
thatthe inode cache pool was only about 16GB. Take 40% of that (default CentOS 5.x) and you get 6GB. Not great, but
enoughyou might be able to get by without actually noticing the pauses. After tripling our memory, the database still
used16GB, but suddenly our inode cache jumped from 16GB to 80GB. 40% of that is 32GB, and there's no way our 512MB
controllercache could try to swallow that without us noticing.

Things got much better when we set dirty_background_ratio to 1, and dirty_ratio to 10. That might be a tad too
aggressive,but it worked for us.

--
Shaun Thomas
OptionsHouse | 141 W. Jackson Blvd | Suite 500 | Chicago IL, 60604
312-676-8870
sthomas@optionshouse.com


______________________________________________

See http://www.peak6.com/email_disclaimer/ for terms and conditions related to this email
On 03/05/2012 16:46, Craig James wrote:
> On Thu, May 3, 2012 at 6:42 AM, Jan Nielsen<jan.sture.nielsen@gmail.com>  wrote:
>> Hi John,
>>
>> On Thu, May 3, 2012 at 12:54 AM, John Lister<john.lister@kickstone.co.uk>
>> wrote:
>>> I was wondering if it would be better to put the xlog on the same disk as
>>> the OS? Apart from the occasional log writes I'd have thought most OS data
>>> is loaded into cache at the beginning, so you effectively have an unused
>>> disk. This gives you another spindle (mirrored) for your data.
>>>
>>> Or have I missed something fundamental?
>> I followed Gregory Smith's arguments from PostgreSQL 9.0 High Performance,
>> wherein he notes that WAL is sequential with constant cache flushes whereas
>> OS is a mix of sequential and random with rare cache flushes. This (might)
>> lead one to conclude that separating these would be good for at least the
>> WAL and likely both. Regardless, separating these very different
>> use-patterns seems like a "Good Thing" if tuning is ever needed for either.
> Another consideration is journaling vs. non-journaling file systems.
> If the WAL is on its own file system (not necessarily its own
> spindle), you can use a non-journaling file system like ext2.  The WAL
> is actually quite small and is itself a journal, so there's no reason
> to use a journaling file system.  On the other hand, you don't want
> the operating system on ext2 because it takes a long time to recover
> from a crash.
>
> I think you're right about the OS: once it starts, there is very
> little disk activity.  I'd say put both on the same disk but on
> different partitions.  The OS can use ext4 or some other modern
> journaling file system, and the WAL can use ext2.  This also means you
> can put the WAL on the outer (fastest) part of the disk and leave the
> slow inner tracks for the OS.
>
Sorry I wasn't clear, I was thinking that the WAL and OS would go on
different partitions (for the reasons stated previously that the OS
could fill its partition) but that they share a disk/spindle - some
nomenclature issues here I think. This would free up another (pair of)
spindle(s) for the data which would seem much more beneficial in terms
of performance than the WAL being separate...

In terms of the caching issues, I'm guessing that you would be sharing
the same cache regardless of whether the OS and WAL are on the same
disk(s) or not - unless you stick the WAL on a separate raid/disk
controller to the OS...

John

--
www.pricegoblin.co.uk
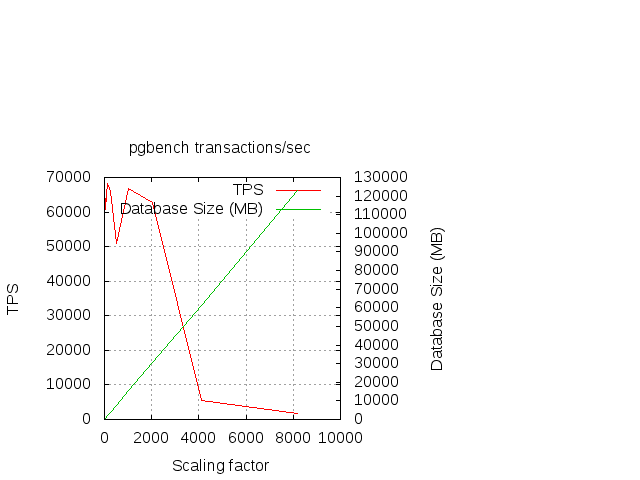
Starting to get some quantitative data now. Here is the results from the pgbench scaling:
pgbench -t 2000 -c 32 -S pgbench
for scales of 2^n where n=0..14 for scale, DB size in MB, and transactions per second:
Scale DB Size TPS
-------------------
1 21 65618
2 36 66060
4 66 65939
8 125 66469
16 245 67065
32 484 60764
64 963 64676
128 1920 68151
256 3834 65933
512 7662 50777
1024 15360 66717
2048 30720 62811
4096 61440 5558
8192 122880 1854
The range 2048-8192 is an area to study in more detail, obviously. Feedback welcome.
Cheers,
Jan
*System* HP ProLiant BL460c G7
*BIOS* HP I27 05/05/2011
*CPU Sockets* 2
*Chips* Intel(R) Xeon(R) CPU X5650 @ 2.67GHz
*Kernel Name* Linux
*Kernel Version* 2.6.32-220.el6.x86_64
*Machine Platform* x86_64
*Processor Type* x86_64
*Operating System* GNU/Linux
*Distribution* CentOS release 6.2 (Final)
*Write barriers* libata version 3.00 loaded.
*MemTotal* 49410668kB
*PAGE_SIZE* 4096
*_PHYS_PAGES* 12352667
*kernel.shmall* 6176333
*kernel.shmmax* 25298259968
*kernel.sem* 250 32000 32 128
*vm.swappiness* 0
*vm.overcommit_memory* 2
*dirty_ratio* 5
*dirty_background_ratio* 2
300GB RAID1 2x15k drive for OS on local storage
*/dev/sda1 RA* 4096
*/dev/sda1 FS* ext4
*/dev/sda1 MO*
*IO Scheduler sda* noop anticipatory deadline [cfq]
600GB RAID1+0 8x15k drive for $PGDATA on SAN
*/dev/sdb1 RA* 4096
*/dev/sdb1 FS* xfs
*/dev/sdb1 MO* allocsize=256m,attr2,logbufs=8,logbsize=256k,noatime
*IO Scheduler sdb* noop anticipatory deadline [cfq]
300GB RAID1 2x15k drive for $PGDATA/pg_xlog on SAN
*/dev/sde1 RA* 4096
*/dev/sde1 FS* xfs
*/dev/sde1 MO* allocsize=256m,attr2,logbufs=8,logbsize=256k,noatime
*IO Scheduler sde* noop anticipatory deadline [cfq]
PG Configuration
*PG shared_buffers* 16GB
*PG log_line_prefix* '%t:%u@%r=>%d:[%p]: '
*PG log_statement* ddl
*PG log_min_duration_statement* 1s
*PG listen_addresses* *
*PG checkpoint_segments* 32
*PG checkpoint_completion_target* 0.9
*PG max_connections* 100
*PG max_fsm_relations*
*PG max_fsm_pages*
*PG wal_buffers* 16MB
*PG wal_sync_method* open_sync
*PG effective_cache_size* 32GB
*PG random_page_cost* 4
*PG constraint_exclusion* partition
*PG work_mem* 32MB
*PG maintenance_work_mem* 2GB
pgbench -t 2000 -c 32 -S pgbench
for scales of 2^n where n=0..14 for scale, DB size in MB, and transactions per second:
Scale DB Size TPS
-------------------
1 21 65618
2 36 66060
4 66 65939
8 125 66469
16 245 67065
32 484 60764
64 963 64676
128 1920 68151
256 3834 65933
512 7662 50777
1024 15360 66717
2048 30720 62811
4096 61440 5558
8192 122880 1854
The range 2048-8192 is an area to study in more detail, obviously. Feedback welcome.
Cheers,
Jan
*System* HP ProLiant BL460c G7
*BIOS* HP I27 05/05/2011
*CPU Sockets* 2
*Chips* Intel(R) Xeon(R) CPU X5650 @ 2.67GHz
Intel(R) Xeon(R) CPU X5650 @ 2.67GHz
*CPU Cores* 24*Kernel Name* Linux
*Kernel Version* 2.6.32-220.el6.x86_64
*Machine Platform* x86_64
*Processor Type* x86_64
*Operating System* GNU/Linux
*Distribution* CentOS release 6.2 (Final)
*Write barriers* libata version 3.00 loaded.
*MemTotal* 49410668kB
*PAGE_SIZE* 4096
*_PHYS_PAGES* 12352667
*kernel.shmall* 6176333
*kernel.shmmax* 25298259968
*kernel.sem* 250 32000 32 128
*vm.swappiness* 0
*vm.overcommit_memory* 2
*dirty_ratio* 5
*dirty_background_ratio* 2
300GB RAID1 2x15k drive for OS on local storage
*/dev/sda1 RA* 4096
*/dev/sda1 FS* ext4
*/dev/sda1 MO*
*IO Scheduler sda* noop anticipatory deadline [cfq]
600GB RAID1+0 8x15k drive for $PGDATA on SAN
*/dev/sdb1 RA* 4096
*/dev/sdb1 FS* xfs
*/dev/sdb1 MO* allocsize=256m,attr2,logbufs=8,logbsize=256k,noatime
*IO Scheduler sdb* noop anticipatory deadline [cfq]
300GB RAID1 2x15k drive for $PGDATA/pg_xlog on SAN
*/dev/sde1 RA* 4096
*/dev/sde1 FS* xfs
*/dev/sde1 MO* allocsize=256m,attr2,logbufs=8,logbsize=256k,noatime
*IO Scheduler sde* noop anticipatory deadline [cfq]
PG Configuration
*PG shared_buffers* 16GB
*PG log_line_prefix* '%t:%u@%r=>%d:[%p]: '
*PG log_statement* ddl
*PG log_min_duration_statement* 1s
*PG listen_addresses* *
*PG checkpoint_segments* 32
*PG checkpoint_completion_target* 0.9
*PG max_connections* 100
*PG max_fsm_relations*
*PG max_fsm_pages*
*PG wal_buffers* 16MB
*PG wal_sync_method* open_sync
*PG effective_cache_size* 32GB
*PG random_page_cost* 4
*PG constraint_exclusion* partition
*PG work_mem* 32MB
*PG maintenance_work_mem* 2GB
Attachment
Jan Nielsen <jan.sture.nielsen@gmail.com> wrote:

> The range 2048-8192 is an area to study in more detail, obviously.
> Feedback welcome.

I don't see what's to study there, really.  Performance drops off
when database size grows from 30GB to 60GB on a system with 48GB
RAM. And even more when you double database size again.  Access to
disk is slower than access to system RAM.  Is there something else I
should notice that I'm missing?

The local dips in the list suggest that you're not controlling for
checkpoints or autovacuum runs as well as you might, or that you're
not using a large enough number of runs at each scale.

-Kevin
On Fri, May 4, 2012 at 8:07 AM, Jan Nielsen <jan.sture.nielsen@gmail.com> wrote:
> Starting to get some quantitative data now. Here is the results from the
> pgbench scaling:
>
>   pgbench -t 2000 -c 32 -S pgbench

A single thread of pgbench is probably not enough to saturate 32
sessions.  What if you try -j 16 or -j 32?

Also, -t 2000 is mighty low.

Cheers,

Jeff
-----BEGIN PGP SIGNED MESSAGE-----
Hash: RIPEMD160


>>> Is it established practice in the Postgres world to separate indexes
>>> from tables? I would assume that the reasoning of Richard Foote -
>>> albeit for Oracle databases - is also true for Postgres:
>
>> Yes, it's an established practice. I'd call it something just short of
>> a best practice though, as it really depends on your situation.
>
> What are the benefits?

Disk seeks, basically. Yes, there are a lot of complications regarding
all the various hardware/OS/PG level cachings, but at the end of the
day, it's less work to have each drive concentrate on a single area
(especially as we always require a heap scan at the moment).

>> I also find his examples a bit contrived, and the whole "multi-user"
>> argument irrelevant for common cases.
>
> Why is that?

Because most Postgres servers are dedicated to serving the same data
or sets of data, and the number of "other users" calling ad-hoc queries
against lots of different tables (per his example) is small. So this
sentence just doesn't ring true to me:

    " ... by the time weâve read the index leaf block, processed and
    read all the associated table blocks referenced by the index leaf
    block, the chances of there being no subsequent physical activity
    in the index tablespace due to another user session is virtually
    nil. We would still need to re-scan the disk to physically access
    the next index leaf block (or table block) anyways."

That's certainly not true for Postgres servers, and I doubt if it
is quite that bad on Oracle either.

>> I lean towards using separate tablespaces in Postgres, as the
>> performance outweighs the additional>> complexity.

> What about his argument with regards to access patterns (i.e.
> interleaving index and table access during an index scan)?  Also,
> Shaun's advice to have more spindles available sounds convincing to
> me, too.

I don't buy his arguments. To do so, you'd have to buy a key point:

    "when most physical I/Os in both index and table segments are
     effectively random, single block reads"

They are not; hence, the rest of his argument falls apart. Certainly,
if things were as truly random and uncached as he states, there would
be no benefit to separation.

As far as spindles, yes: like RAM, it's seldom the case to have
too litte :) But as with all things, one should get some benchmarks
on your specific workload before making hardware changes. (Well, RAM
may be an exception to that, up to a point).

>> It's down on the tuning list however: much more important
>> is getting your kernel/volumes configured correctly, allocating
>> shared_buffers sanely, separating pg_xlog, etc.

> That does make a lot of sense.  Separating pg_xlog would probably the
> first thing I'd do especially since the IO pattern is so dramatically
> different from tablespace IO access patterns.

Yep - moving pg_xlog to something optimized for small, constantly
written files is one of the biggest and easiest wins. Other than
fsync = off ;)

- --
Greg Sabino Mullane greg@turnstep.com
End Point Corporation http://www.endpoint.com/
PGP Key: 0x14964AC8 201205151351
http://biglumber.com/x/web?pk=2529DF6AB8F79407E94445B4BC9B906714964AC8
-----BEGIN PGP SIGNATURE-----

iEYEAREDAAYFAk+yl8YACgkQvJuQZxSWSshB+QCghfweMspFIqmP4rLv6/tcGPot
jscAn1SZAP1/KBcu/FEpWXilSnWjlA6Z
=FX7j
-----END PGP SIGNATURE-----
On Tue, May 15, 2012 at 7:53 PM, Greg Sabino Mullane <greg@turnstep.com> wrote:
>
> -----BEGIN PGP SIGNED MESSAGE-----
> Hash: RIPEMD160
>
>
>>>> Is it established practice in the Postgres world to separate indexes
>>>> from tables? I would assume that the reasoning of Richard Foote -
>>>> albeit for Oracle databases - is also true for Postgres:
>>
>>> Yes, it's an established practice. I'd call it something just short of
>>> a best practice though, as it really depends on your situation.
>>
>> What are the benefits?
>
> Disk seeks, basically. Yes, there are a lot of complications regarding
> all the various hardware/OS/PG level cachings, but at the end of the
> day, it's less work to have each drive concentrate on a single area

Hmm...  I see your point.  OTOH, the whole purpose of using NAS or SAN
with cache, logical volumes and multiple spindles per volume is to
reduce the impact of slow disk operations like seeks.  If in such a
situation your database operations are impacted by those seek
operations then the setup does not seem optimal anyway.  Bottom line
is: with a setup properly tailored to the workload there should be no
seeks "visible" to the database.

> (especially as we always require a heap scan at the moment).

Are you referring to the scan along tuple versions?
http://facility9.com/2011/03/postgresql-row-storage-fundamentals/

>>> I also find his examples a bit contrived, and the whole "multi-user"
>>> argument irrelevant for common cases.
>>
>> Why is that?
>
> Because most Postgres servers are dedicated to serving the same data
> or sets of data, and the number of "other users" calling ad-hoc queries
> against lots of different tables (per his example) is small.

I don't see how it should be relevant for this discussion whether
selects are "ad hoc" or other.  The mere fact that concurrent accesses
to the same set of tables and indexes albeit to different data (keys)
is sufficient to have a potential for seeks - even if disks for index
and table are separated.  And this will typically happen in a
multiuser application - even if all users use the same set of queries.

> So this sentence just doesn't ring true to me:
>
>    " ... by the time weâve read the index leaf block, processed and
>    read all the associated table blocks referenced by the index leaf
>    block, the chances of there being no subsequent physical activity
>    in the index tablespace due to another user session is virtually
>    nil. We would still need to re-scan the disk to physically access
>    the next index leaf block (or table block) anyways."
>
> That's certainly not true for Postgres servers, and I doubt if it
> is quite that bad on Oracle either.

I don't think this has much to do with the brand.  Richard just
describes logical consequences of concurrent access (see my attempt at
explanation above).  Fact remains that concurrent accesses rarely
target for the same data and because of that you would see quite
erratic access patterns to blocks.  How they translate to actual disk
accesses depends on various caching mechanisms in place and the
physical distribution of data across disks (RAID).  But I think we
cannot ignore the fact that the data requested by concurrent queries
most likely resides on different blocks.

>>> I lean towards using separate tablespaces in Postgres, as the
>>> performance outweighs the additional>> complexity.
>
>> What about his argument with regards to access patterns (i.e.
>> interleaving index and table access during an index scan)?  Also,
>> Shaun's advice to have more spindles available sounds convincing to
>> me, too.
>
> I don't buy his arguments. To do so, you'd have to buy a key point:
>
>    "when most physical I/Os in both index and table segments are
>     effectively random, single block reads"
>
> They are not; hence, the rest of his argument falls apart. Certainly,
> if things were as truly random and uncached as he states, there would
> be no benefit to separation.

Your argument with seeks also only works in absence of caching (see
above).  I think Richard was mainly pointing out that /in absence of
caching/ different blocks need to be accessed here.

> As far as spindles, yes: like RAM, it's seldom the case to have
> too litte :) But as with all things, one should get some benchmarks
> on your specific workload before making hardware changes. (Well, RAM
> may be an exception to that, up to a point).

Can you share some measurement data which backs the thesis that the
distribution of index and table to different disks is advantageous?
That would be interesting to see.  Then one could also balance
performance benefits against other effects (manageability etc.) and
see on which side the advantage comes out.

Even though I'm not convinced: Thank you for the interesting discussion!

Cheers

robert


--
remember.guy do |as, often| as.you_can - without end
http://blog.rubybestpractices.com/
On Tue, May 15, 2012 at 11:53 AM, Greg Sabino Mullane <greg@turnstep.com> wrote:
>>> Is it established practice in the Postgres world to separate indexes>>> from tables? I would assume that the reasoning of Richard Foote -Disk seeks, basically. Yes, there are a lot of complications regarding
>>> albeit for Oracle databases - is also true for Postgres:
>
>> Yes, it's an established practice. I'd call it something just short of
>> a best practice though, as it really depends on your situation.
>
> What are the benefits?
all the various hardware/OS/PG level cachings, but at the end of the
day, it's less work to have each drive concentrate on a single area
(especially as we always require a heap scan at the moment).
Thanks for sharing your experience, Greg. What would a PG test-case for this look like?
Cheers,
Jan
After seeing less much performance during pg_dump and pg_restore operations from a 10x15k SAN RAID1+1 XFS mount (allocsize=256m,attr2,logbufs=8,logbsize=256k,noatime,nobarrier) than the local-storage 2x15k RAID1 EXT4 mount, I ran the following test of the effect of read-ahead (RA):
for t in `seq 1 1 10`
do
for drive in `ls /dev/sd[b-z]`
do
for ra in 256 512 `seq 1024 1024 70000`
do
echo benchmark-test: $drive $ra
blockdev --setra $ra $drive
hdparm -t $drive
hdparm -T $drive
echo benchmark-test-complete: $drive $ra
done
done
done
In this test, the local mount's buffered reads perform best around RA~10k @ 150MB/sec then starts a steady decline. The SAN mount has a similar but more subtle decline with a maximum around RA~5k @ 80MB/sec but with much greater variance. I was surprised at the 80MB/sec for the SAN - I was expecting 150MB/sec - and I'm also surprised at the variance. I understand that there are many more elements involved for the SAN: more drives, network overhead & latency, iscsi, etc. but I'm still surprised.
Is this expected behavior for a SAN mount or is this a hint at some misconfiguration? Thoughts?
Cheers,
Jan
Attachment
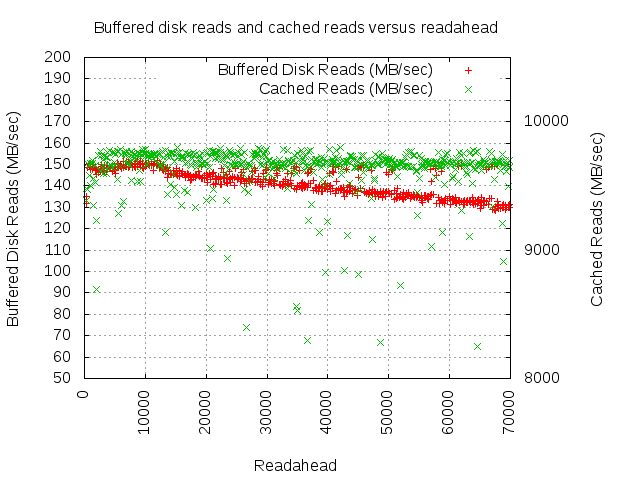
Oops - couple of corrections and clarifications below...
On Sat, May 19, 2012 at 9:47 AM, Jan Nielsen <jan.sture.nielsen@gmail.com> wrote:
After seeing less much performance during pg_dump and pg_restore operations from a 10x15k SAN RAID1+1 XFS mount
10x15k RAID1+0 on a SAN with XFS on /dev/sdc
(allocsize=256m,attr2,logbufs=8,logbsize=256k,noatime,nobarrier) than the local-storage 2x15k RAID1 EXT4 mount,
2x15k RAID1 on local-storage with EXT4 on /dev/sda
I ran the following test of the effect of read-ahead (RA):
for t in `seq 1 1 10`
do
for drive in `ls /dev/sd[b-z]`
do
for ra in 256 512 `seq 1024 1024 70000`
do
echo benchmark-test: $drive $ra
blockdev --setra $ra $drive
hdparm -t $drive
hdparm -T $drive
echo benchmark-test-complete: $drive $ra
done
done
done
In this test, the local mount's buffered reads perform best around RA~10k @ 150MB/sec then starts a steady decline. The SAN mount has a similar but more subtle decline with a maximum around RA~5k @ 80MB/sec but with much greater variance. I was surprised at the 80MB/sec for the SAN - I was expecting 150MB/sec - and I'm also surprised at the variance. I understand that there are many more elements involved for the SAN: more drives, network overhead & latency, iscsi, etc. but I'm still surprised.Is this expected behavior for a SAN mount or is this a hint at some misconfiguration? Thoughts?
Is this variance, as contrasted to the local-storage drive, and drop in performance in relation to the local-storage typical of SAN?
Cheers,Jan
On 20/05/12 03:47, Jan Nielsen wrote:
> In this test, the local mount's buffered reads perform best around RA~10k @
> 150MB/sec then starts a steady decline. The SAN mount has a similar but
> more subtle decline with a maximum around RA~5k @ 80MB/sec but with much
> greater variance. I was surprised at the 80MB/sec for the SAN - I was
> expecting 150MB/sec - and I'm also surprised at the variance. I understand
> that there are many more elements involved for the SAN: more drives,
> network overhead&  latency, iscsi, etc. but I'm still surprised.
>
> Is this expected behavior for a SAN mount or is this a hint at some
> misconfiguration? Thoughts?
>
>

Is the SAN mount via iSCSI?  If so and also if the connection is a
single 1Gbit interface then 80MB/s is reasonable. You might get closer
to 100MB/s by tweaking things like MTU for the interface concerned, but
to get more performance either bonding several 1Gbit links or using
10Gbit is required.

Regards

Mark