Thread: Profiling
Folks,

I had a request from one of the SF-PUG members that I found
interesting.  She suggested that we post the specs of some of the
PostgreSQL servers that we administrate, their statistics, and some
comments on how they perform.  I'll start it off with an example:

Small Cheap Workgroup Server
AMD Athalon 700mhz
256mb SDRAM
Dual 20gb 7200rpm IDE Drives (1 IBM, 1 Quantum)
   with OS, Apache, XLog on 1st drive,
   Postgres Database, Swap on 2nd drive
Running SuSE Linux 7.3
  Apache 1.3.x
  PHP 4.0.x
  PostgreSQL 7.1.3
3-8 concurrent users on intranet application
with large transactions but low transaction frequency
(est. 20-300 reads and 5-80 writes per hour)
on small database (< 20,000 records combined in main tables)

Performance assessment:  Adequate, reasonably fast
on selects except aggregates, commits taking 5-20 seconds
during medium activity.  Same system with a Celeron 500
previously demonstrated horrible performance (often > 45 seconds
on selects) on complex queries, such as one view with
custom aggregates.


-Josh Berkus


______AGLIO DATABASE SOLUTIONS___________________________
                                       Josh Berkus
  Complete information technology      josh@agliodbs.com
   and data management solutions       (415) 565-7293
  for law firms, small businesses        fax 621-2533
    and non-profit organizations.      San Francisco
Folks,

> I had a request from one of the SF-PUG members that I found
> interesting.  She suggested that we post the specs of some of the
> PostgreSQL servers that we administrate, their statistics, and some
> comments on how they perform.  I'll start it off with an example:
>
> Small Cheap Workgroup Server
> AMD Athalon 700mhz
> 256mb SDRAM
> Dual 20gb 7200rpm IDE Drives (1 IBM, 1 Quantum)
>    with OS, Apache, XLog on 1st drive,
>    Postgres Database, Swap on 2nd drive
> Running SuSE Linux 7.3
>   Apache 1.3.x
>   PHP 4.0.x
>   PostgreSQL 7.1.3
> 3-8 concurrent users on intranet application
> with large transactions but low transaction frequency
> (est. 20-300 reads and 5-80 writes per hour)
> on small database (< 20,000 records combined in main tables)
>
> Performance assessment:  Adequate, reasonably fast
> on selects except aggregates, commits taking 5-20 seconds
> during medium activity.  Same system with a Celeron 500
> previously demonstrated horrible performance (often > 45 seconds
> on selects) on complex queries, such as one view with
> custom aggregates.

Oh, and I forgot:

shared_buffers 4096
sort_mem 2048
wal_files 8
wal_sync_method = fdatasync

-Josh

______AGLIO DATABASE SOLUTIONS___________________________
                                       Josh Berkus
  Complete information technology      josh@agliodbs.com
   and data management solutions       (415) 565-7293
  for law firms, small businesses        fax 621-2533
    and non-profit organizations.      San Francisco
Josh Berkus wrote:
> Folks,
>
>
>>I had a request from one of the SF-PUG members that I found
>>interesting.  She suggested that we post the specs of some of the
>>PostgreSQL servers that we administrate, their statistics, and some
>>comments on how they perform.  I'll start it off with an example:
>>
>>Small Cheap Workgroup Server
>>AMD Athalon 700mhz
>>256mb SDRAM
>>Dual 20gb 7200rpm IDE Drives (1 IBM, 1 Quantum)
>>   with OS, Apache, XLog on 1st drive,
>>   Postgres Database, Swap on 2nd drive
>>Running SuSE Linux 7.3
>>  Apache 1.3.x
>>  PHP 4.0.x
>>  PostgreSQL 7.1.3
>>3-8 concurrent users on intranet application
>>with large transactions but low transaction frequency
>>(est. 20-300 reads and 5-80 writes per hour)
>>on small database (< 20,000 records combined in main tables)
>>
>>Performance assessment:  Adequate, reasonably fast
>>on selects except aggregates, commits taking 5-20 seconds
>>during medium activity.  Same system with a Celeron 500
>>previously demonstrated horrible performance (often > 45 seconds
>>on selects) on complex queries, such as one view with
>>custom aggregates.
>
>
> Oh, and I forgot:
>
> shared_buffers 4096
> sort_mem 2048
> wal_files 8
> wal_sync_method = fdatasync

Hi Josh,

Want to CVS checkout the latest OSDB source code (http://www.sf.net/projects/osdb), generate say a 100MB database and
do
a multiuser test of 20 or so users on it?

:-)

Regards and best wishes,

Justin Clift


> -Josh
>
> ______AGLIO DATABASE SOLUTIONS___________________________
>                                        Josh Berkus
>   Complete information technology      josh@agliodbs.com
>    and data management solutions       (415) 565-7293
>   for law firms, small businesses        fax 621-2533
>     and non-profit organizations.      San Francisco
>
> ---------------------------(end of broadcast)---------------------------
> TIP 5: Have you checked our extensive FAQ?
>
> http://www.postgresql.org/users-lounge/docs/faq.html


--
"My grandfather once told me that there are two kinds of people: those
who work and those who take the credit. He told me to try to be in the
first group; there was less competition there."
- Indira Gandhi
On Tuesday 17 December 2002 09:33 am, you wrote:
> Folks,
>
> I had a request from one of the SF-PUG members that I found
> interesting.  She suggested that we post the specs of some of the
> PostgreSQL servers that we administrate, their statistics, and some
> comments on how they perform.  I'll start it off with an example:

OK my take.

P-II-450MHz/256MB/20GB IDE. Mandrake8.2, postgresql 7.2.x

PGBench, with 10M records/10,000 transactions/10 users.

Throughput 25tps.

Rest of the things were default. I am not too sure of details as this was more
than 4 months back and that machine is windows now.

Same machine/Another benchmark

Banking application simulation.

Shared buffers 14000
Number of records: 100 in one table, continously updated+log table continously
inserted
Throughput 200tps.

 HTH

 Shridhar
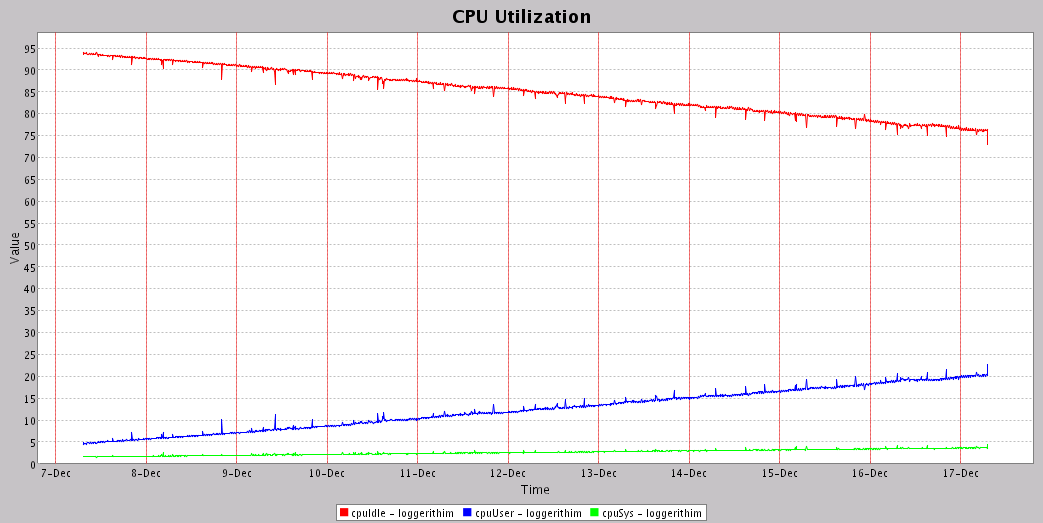
On Tuesday, December 17, 2002, at 12:57 AM, Shridhar Daithankar wrote:

> On Tuesday 17 December 2002 09:33 am, you wrote:
>> Folks,
>>
>> I had a request from one of the SF-PUG members that I found
>> interesting.  She suggested that we post the specs of some of the
>> PostgreSQL servers that we administrate, their statistics, and some
>> comments on how they perform.  I'll start it off with an example:
>

My take:

Dual PIII-1.12Ghz, 3Gb, 5 x 36 RAID 5'ed with a spare, RedHat 7.2, Pg
7.3

pgbench, default settings, 252tps inc. connex, 409tps excluding connex

Day to day, runs a monitoring/historical analysis tool of my design
with gathers metrics from around 30 hosts (they report every 10
minutes, by their clock).  Has 3,689,652 rows as of right now in the
'metrics' table, which is indexed by timestamp.

My 'main' query is in the form of:

SELECT timestamp, data FROM metrics WHERE resgroupid=? and hostid=? AND
timestamp BETWEEN ? AND ? ORDER BY timestamp

Index is on timestamp.

This query generally takes about half a second for 24 hours worth of
data.  I just ran a 240 hour query on a test database with about 20,000
rows and the result too 2998ms.

Things slowed to a crawl about 2 weeks ago, so I upgraded to 7.3 and
saw a huge improvement.  I believe part of this might have been due to
the recreation of the database, similar to a CLUSTER.  My performance
is not degrading from a time perspective, but CPU usage is steadily
degrading.  User time is steadily increasing over the last 240 hours,
from 5% to 15%.  Attached is output of my monitoring program (well, the
new improved Java version) showing the CPU performance over the last
240 hours.

shared_buffers = 98304
sort_mem = 1600
fsync = false

Everything else is default, recommendations welcome. ;)


Cory 'G' Watson
Attachment
On Tuesday 17 December 2002 06:59 pm, you wrote:
> shared_buffers = 98304
> sort_mem = 1600
> fsync = false
>
> Everything else is default, recommendations welcome. ;)

What is the vacuum frequency?

 Shridhar
On Tuesday, December 17, 2002, at 07:35 AM, Shridhar Daithankar wrote:

> On Tuesday 17 December 2002 06:59 pm, you wrote:
>> shared_buffers = 98304
>> sort_mem = 1600
>> fsync = false
>>
>> Everything else is default, recommendations welcome. ;)
>
> What is the vacuum frequency?

Every morning.  This db is almost exclusively INSERT and SELECT.  Well,
I take that back, a single table gets UPDATEs rather frequently.
Otherwise, INSERT only.

Cory 'G' Watson
On Tuesday 17 December 2002 07:13 pm, you wrote:
> On Tuesday, December 17, 2002, at 07:35 AM, Shridhar Daithankar wrote:
> > What is the vacuum frequency?
>
> Every morning.  This db is almost exclusively INSERT and SELECT.  Well,
> I take that back, a single table gets UPDATEs rather frequently.
> Otherwise, INSERT only.

i recommend a vacuum analyze per 1000/2000 records for the table that gets
updated. It should boost the performance like anything..

 Shridhar
On Tuesday, December 17, 2002, at 07:49 AM, Shridhar Daithankar wrote:

> On Tuesday 17 December 2002 07:13 pm, you wrote:
>> On Tuesday, December 17, 2002, at 07:35 AM, Shridhar Daithankar wrote:
>>> What is the vacuum frequency?
>>
>> Every morning.  This db is almost exclusively INSERT and SELECT.
>> Well,
>> I take that back, a single table gets UPDATEs rather frequently.
>> Otherwise, INSERT only.
>
> i recommend a vacuum analyze per 1000/2000 records for the table that
> gets
> updated. It should boost the performance like anything..

By my math, I'll need to vacuum once every hour or so.  Cron, here I
come.

vacuumdb --table cached_metrics loggerithim

I assume I do not need a --analyze, since that table has no indexes.
Should I vacuum the entire DB?

Any other settings I should look at?  Note that I'm not necessarily
having any problems at present, but one can always tune.  This DB is
used with a web app (mod_perl/DBI) at the moment, but is moving to a
Java Swing client, which will give me much more data about performance.

Cory 'G' Watson
On 17 Dec 2002 at 8:20, Cory 'G' Watson wrote:
> By my math, I'll need to vacuum once every hour or so.  Cron, here I
> come.
>
> vacuumdb --table cached_metrics loggerithim

http://gborg.postgresql.org/project/pgavd/projdisplay.php

Yeah, yeah.. I wrote that..and use CVS as usual. No release as yet..


> I assume I do not need a --analyze, since that table has no indexes.
> Should I vacuum the entire DB?

You need analyse to keep vacuum non-locking I assume. And there is no need to
vacuum entire DB.

HTH

Bye
 Shridhar

--
paycheck:    The weekly $5.27 that remains after deductions for federal
withholding, state withholding, city withholding, FICA,    medical/dental, long-
term disability, unemployment insurance,    Christmas Club, and payroll savings
plan contributions.
"Cory 'G' Watson" <gphat@cafes.net> writes:
> I assume I do not need a --analyze, since that table has no indexes.

Whether you need analyze or not has nothing to do with whether there
are indexes.  You probably don't need it once an hour, but maybe once
a day would be good.

> Should I vacuum the entire DB?

Overkill; just get the heavily-updated table(s).  A DB-wide vacuum must
be done occasionally, but again once-a-day would be plenty.

> Any other settings I should look at?

Free space map (fsm) settings must be adequate to keep track of the free
space in your tables.

However, all of this relates only to keeping performance good on the
table with lots of updates.  If you are seeing progressive degradation
on a table that only gets INSERTs, then there's something else going on.
AFAIR you didn't show us an EXPLAIN ANALYZE for the principal query?

            regards, tom lane
OK, my turn.

We have two main servers that are identical, one is the online server, the
other is the hot spare.   Their specs:

Dual PIII-750 1.5 Gig ram and dual 18 Gig 10krpm UW SCSI drives.
OS on one drive, postgresql on the other.

Interesting postgresql.conf entries:

max_connections = 128
shared_buffers = 32768
max_fsm_relations = 10000
sort_mem = 2048
vacuum_mem = 8192
cpu_tuple_cost = 0.01
cpu_index_tuple_cost = 0.0001
cpu_operator_cost = 0.05

pgbench -c 4 -t 200 delivers about 240 tps.

Performance is outstanding.  This machine runs apache, OpenLDAP, Real
Server 1, as well as Postgresql.  All non-database data is stored on a
NAS, so the local drives are only used for swap and postgresql.  Average
load is about 40 to 200 reads per minute, with only a handful of writes
per minute (1 to 5 max).  Most data is loaded from nightly runs out of
the mainframe and a few other systems for things like company phonebook
and ldap.

My test servers:

Server A: Dual PPro 200 with 256 Meg RAM and 6x4Gig 10kRPM UW SCSI drives
(3 quantum, 3 seagate) and 2x80Gig 7200 RPM IDE drives.

Data is generally stored on the pair of 80 gig drives, because the 4 gig
scsis just aren't big enough.  The 80 gig ides are setup as two 40 gig
mirrors (i.e. they're split in half) with the other half used to store
backups and such.

shared_buffers = 5000

pgbench -c 4 -t 200 yields about 80 tps.

Performance is actually quite good, and this is a box we bought in 1997.

Server B: (My workstation) Celeron 1.1GHz, with 512 MEg RAM and a 40 gig
IDE @7200 RPM, and a 17 Gig IDE @5400 RPM.

shared_buffers = 4096

pgbench -c 4 -t 200 yields about 75 tps.  Yes, my dual PPro 200 outruns
this box.  But then again, my workstation has KDE up and running with
Mozilla, xmms mp3 player going, and a couple other programs running as
well.

All of these boxes are / were heavily tested before deployment, and we
have never had a problem with postgresql on any of them.