Thread: Spurious Stalls
Hi Group,
My team has been very happy using Postgres, hosting Bitbucket. Thanks very much for all the community contributions, to the platform.
Lately, though, about once a day now, for about a week, we have been experiencing periods of stalling. When Postgres stalls, we haven't been able to recover, without restarting the database, unfortunately.
This brings our uptime down some, that we'd like to avoid (99.2%) :( We'd like to do a better job keeping things running.
It would be great to get your input about it. Alternately, if someone is available, as a consultant, that would be great too.
Here is some background, about the issue. We have found the following symptoms.
- During this performance issue, we found the following symptoms.
- Running queries do not return.
- The application sometimes can no longer get new connections.
- The CPU load increases
- There is no I/O wait.
- There is no swapping.
Also, our database configuration, is attached to this email, as postgresql.conf, for reference, along with a profile of our hardware and tuning, as pg_db_profile.txt.
While the database was unavailable, we also collected a lot of data. Looking through this info, a few things pop-out to us, that may be problematic, or useful to notice.
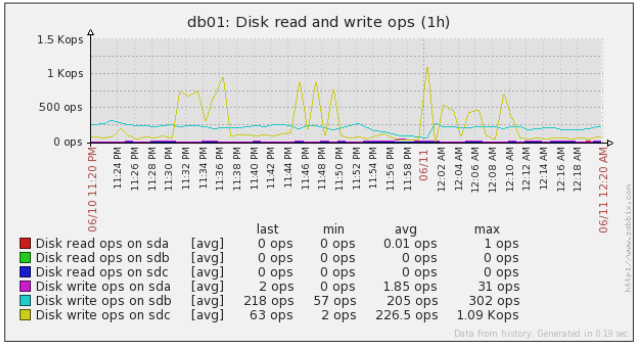
- Disk I/O appears to be all write, and little read.
- In previous incidents, with the same symptoms, we have seen pg processes spending much time in s_lock
- That info is attached to this email also, as files named perf_*.
Problem
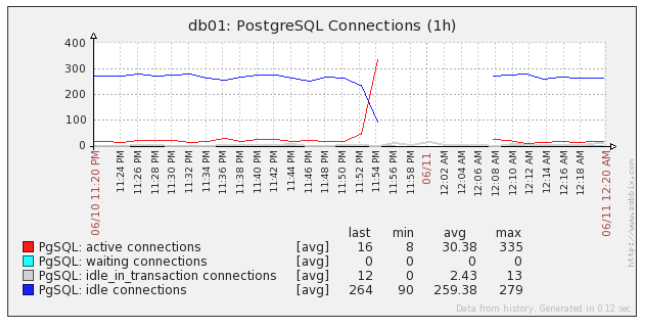
As you can probably see below, at 11:54, the DB stops returning rows.Also, transactions stop returning, causing the active transaction time to trend up to the sky.

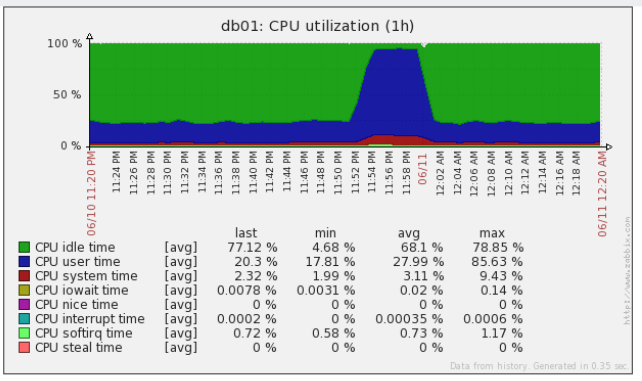
Consequences of Problem
Once transactions stop returning, we see connections pile-up. Eventually, we reach a max, and clients can no longer connect.The cpu utilization increases to nearly 100%, in user space, and stays there, until the database is restarted.
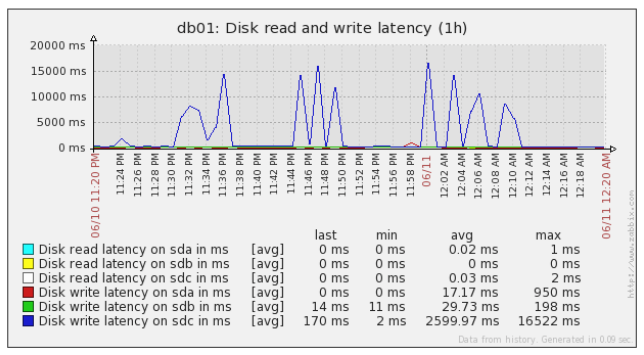
Events Before Problem
This is likely the most useful part. As the time approaches 11:54, there are periods of increased latency. There is also a marked increase in write operations, in general.Lastly, about 10 minutes before outage, postgres writes a sustained 30 MB/s of temp files.
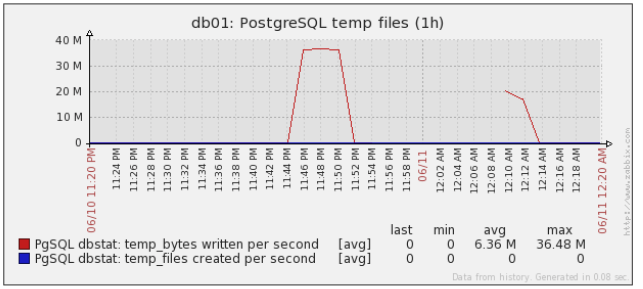
After investigating this, we found a query that was greatly exceeding work_mem. We've since optimized it, and hopefully, that will have a positive effect on the above.
We may not know until the next issue happens, though.
With a problem like this, I am not exactly positive how to proceed. I am really looking forward to hearing your thoughts, and opinions, if you can share them.
Thanks very much,
-Chris
Attachment
- read_write_ops.png
- transaction_times.png
- read_write_latency.png
- pgsql_connections.png
- temp_files.png
- tuples.png
- cpu_utilization.png
- pg_db_profile.txt
- postgresql.conf
- perf_example_vmstat
- perf_example_dmesg
- perf_example_ipcs
- perf_example_locks.csv
- perf_example_pginfo
- perf_example_ps_auxfww
- perf_example_iotop
- perf_example_strace.47700
- perf_example_backtrace.47700
- perf_example_stack.47700
- perf_example_status.47700
- perf_example_strace.46462
- perf_example_syscall.47700
- perf_example_backtrace.46462
- perf_example_stack.46462
- perf_example_status.46462
- perf_example_strace.29561
- perf_example_syscall.46462
- perf_example_backtrace.29561
- perf_example_stack.29561
- perf_example_status.29561
- perf_example_syscall.29561
- perf_example_strace.81372
- perf_example_backtrace.81372
- perf_example_stack.81372
- perf_example_status.81372
- perf_example_syscall.81372
- perf_example_vacuum
On 6/12/2014 12:57 PM, Christopher Nielsen wrote:
>
> With a problem like this, I am not exactly positive how to proceed.  I
> am really looking forward to hearing your thoughts, and opinions, if
> you can share them.

keep a shell session open with a superuser role (eg, postgres), and next
time its hammered, try SELECT * FROM PG_STAT_ACTIVITY

look for things that are waiting = t    and such.

also, if the server is 100% CPU bound, see what processes are using all
that CPU.   ps -auxw    should show the sql commands in addition to
'postgres' or 'postmaster'.   you can compare the PID shown in ps output
with the pid (or procpid if an older release) in pg_stat_activity, too.


--
john r pierce                                      37N 122W
somewhere on the middle of the left coast
On Thu, Jun 12, 2014 at 1:57 PM, Christopher Nielsen
<cnielsen@atlassian.com> wrote:

> Lately, though, about once a day now, for about a week, we have been experiencing periods of stalling.  When Postgres
stalls,we haven't been able to recover, without restarting the database, unfortunately.

Just the db and not the server right? Have you tried killing any
individual queries that seem to be problem / long running queries?

> Here is some background, about the issue.  We have found the following symptoms.
>
> During this performance issue, we found the following symptoms.
> Running queries do not return.

Even simple ones like "select 1;" ?
Or ones that are something like "select * from smalltable where id=123; ?

> The application sometimes can no longer get new connections.
> The CPU load increases
> There is no I/O wait.
> There is no swapping.

> Also, our database configuration, is attached to this email, as postgresql.conf, for reference, along with a profile
ofour hardware and tuning, as pg_db_profile.txt.

How much memory does your machine have? How much of that is shared buf
then? If it's got 8G and 6G shared_buffers I'd lower shared_buffers.
etc
What is your IO subsystem like? Is it a single 7200 RPM SATA drive, an
array of 16 15krpm disks under a caching raid controller? A 1TB
FusionIO card?
Just because linux SAYS there's wait doesn't mean there isn't one.
Sometimes the io wait numbers are zero while some kernel daemon uses
up all the bandwidth and you really are waiting.
Your charts show 35MB/s write. If that's all random, that's a LOT of
writes on anything but SSDs and even then it's a fair bit for a busy
db server if it's being done by 100 or more processes, which is what
this looks like.

> While the database was unavailable, we also collected a lot of data.  Looking through this info, a few things pop-out
tous, that may be problematic, or useful to notice.
>
> Disk I/O appears to be all write, and little read.
> In previous incidents, with the same symptoms, we have seen pg processes spending much time in s_lock
> That info is attached to this email also, as files named perf_*.
>
> Additionally, monitoring graphs show the following performance profile.
>
> Problem
>
> As you can probably see below, at 11:54, the DB stops returning rows.
>
> Also, transactions stop returning, causing the active transaction time to trend up to the sky.
>
>
> Consequences of Problem
>
> Once transactions stop returning, we see connections pile-up.  Eventually, we reach a max, and clients can no longer
connect.

You need to lower your max connections and institute connection
pooling yesterday. 500 connections and 256MB work mem are a recipe for
disaster. While a machine with a db pool in front of it can survive
such scenarios, lack of a pool and high work mem are killing your
machine.

I recommend pgbouncer. Dirt simple, fast, and will keep your incoming
connections limited to something your db can handle.
hi Scott,

On 13 June 2014 00:30, Scott Marlowe <scott.marlowe@gmail.com> wrote:
> Just the db and not the server right? Have you tried killing any
> individual queries that seem to be problem / long running queries?

We have tried to kill individual queries before and it did not have any effect.

>> During this performance issue, we found the following symptoms.
>> Running queries do not return.
>
> Even simple ones like "select 1;" ?
> Or ones that are something like "select * from smalltable where id=123; ?

SELECTs against pg_stat_activity, pg_stat_user_tables do work.

Haven't done a SELECT against the affected database during an outage
for a while now, will add that to our script to do next time.  I can't
remember offhand either.

> How much memory does your machine have? How much of that is shared buf
> then? If it's got 8G and 6G shared_buffers I'd lower shared_buffers.
> etc

256GB RAM - FWIW, we used to have shared_buffers set to 8G but found
two mailing list posts that seemed to suggest lowering this value
fixed similar issues at those sites.  So we've lowered it to 6G.
Still experienced two incidents since.

> What is your IO subsystem like? Is it a single 7200 RPM SATA drive, an
> array of 16 15krpm disks under a caching raid controller? A 1TB
> FusionIO card?

A Dell PERC H700 RAID card, utilizing the CacheCade functionality (SSD
read-cache) for PostgreSQL data only.

2x 146GB 15k SAS disks in RAID 1 for OS
2x 50GB SSD disks in RAID 1 for CacheCade
2x 146GB 15k SAS disks in RAID 1 for PostgreSQL transaction logs
10x 146GB 15k SAS disks in RAID1+0 for PostgreSQL data

> Just because linux SAYS there's wait doesn't mean there isn't one.
> Sometimes the io wait numbers are zero while some kernel daemon uses
> up all the bandwidth and you really are waiting.

OK - any ideas on how to further investigate/validate this?

> Your charts show 35MB/s write. If that's all random, that's a LOT of
> writes on anything but SSDs and even then it's a fair bit for a busy
> db server if it's being done by 100 or more processes, which is what
> this looks like.

It would appear that the specific writes in the graph was due to a
poorly written SQL query that used > 256MB of work_mem.  We've since
fixed that query and I only see a few (<5) temp files being created
per day now, and not close to when we have an incident.

Having said that, before an incident (again this morning), I can see
high disk latency (23,000 ms) on /pg_data disks (sdc) (and the graph
of temp_files is now empty during incidents).

This coincides with a checkpoint:

2014-06-13 08:13:49 GMT [81383]: [224-1] LOG:  checkpoint complete:
wrote 11065 buffers (1.4%); 0 transaction log file(s) added, 0
removed, 56 recycled; write=789.974 s, sync=9.996 s, total=799.987 s;
sync files=644, longest=2.055 s, average=0.015 s

iostat -mx 1 2 output:

Fri Jun 13 08:13:44 UTC 2014
avg-cpu:  %user   %nice %system %iowait  %steal   %idle
          20.31    0.00    3.13    2.21    0.00   74.36

Device:         rrqm/s   wrqm/s     r/s     w/s    rMB/s    wMB/s
avgrq-sz avgqu-sz   await  svctm  %util
sdb               0.00   501.00    0.00  275.00     0.00     2.68
19.99     1.30    4.72   3.30  90.80
sdc               0.00  9275.00    0.00 12141.00     0.00    83.52
14.09   142.56   11.75   0.08  99.70

..

Fri Jun 13 08:13:52 UTC 2014
avg-cpu:  %user   %nice %system %iowait  %steal   %idle
          19.10    0.00    2.99    0.04    0.00   77.87

Device:         rrqm/s   wrqm/s     r/s     w/s    rMB/s    wMB/s
avgrq-sz avgqu-sz   await  svctm  %util
sdb               0.00   226.00    0.00  264.00     0.00     1.40
10.85     0.01    0.05   0.05   1.40
sdc               0.00   744.00    0.00  302.00     0.00     4.09
27.71     0.03    0.10   0.10   3.00
sda               0.00   623.00    0.00  508.00     0.00     4.02
16.22     0.04    0.08   0.06   3.10
dm-0              0.00     0.00    0.00 1030.00     0.00     4.02
8.00     0.11    0.11   0.03   3.30
dm-1              0.00     0.00    0.00    0.00     0.00     0.00
0.00     0.00    0.00   0.00   0.00

Any thoughts on that?

Also, at the moment we're using ext4 as the FS for PostgreSQL.  We
were looking to switch to XFS as part of our upgrade to PostgreSQL
9.3.  What's your thoughts on this?

>> Once transactions stop returning, we see connections pile-up.  Eventually, we reach a max, and clients can no longer
connect.
>
> You need to lower your max connections and institute connection
> pooling yesterday. 500 connections and 256MB work mem are a recipe for
> disaster. While a machine with a db pool in front of it can survive
> such scenarios, lack of a pool and high work mem are killing your
> machine.

We have only 360 (max potential) connections coming to the database
from our application servers (see below for pgbouncer configuration).
And then a few more connections from our monitoring hosts.  In fact,
looking at the aggregate pgbouncer active server connections we're
only peaking at 120 connections under normal load conditions.  During
an incident I can see it ramp up and each client using all of their
available server connections, going up to a total of ~360 connections.

Given the fact that we have 256GB RAM in our server, is your statement
made about 500 connections @ 256MB work_mem still of a concern?  Even
say 400 connections at a work_mem size of 256MB?  Why would we not
want to use all of our RAM?

My calculation shows that we're only using:

shared_buffers + (max_connections * work_mem) +
(autovacuum_max_workers * maintenance_work_mem)
= 8.5GB + (500*256)MB + (6*1)GB
= 8.5GB + 128G + 6GB
= 142GB RAM.

> I recommend pgbouncer. Dirt simple, fast, and will keep your incoming
> connections limited to something your db can handle.

We already use pgbouncer on our application servers with these
configuration settings:

pool_mode = transaction
default_pool_size = 20
max_client_conn = 125
query_wait_timeout = 2
server_idle_timeout = 60

Jaco
On Fri, 13 Jun 2014 20:02:01 +0100 Jaco Engelbrecht <jengelbrecht@atlassian.com> wrote:
>
> This coincides with a checkpoint:

There's a lot going on here (as always with a busy server) but I suspected
a checkpoint problem earlier, and this statement and your additional
information makes me suspect even harder.

In your earlier email with the .conf file, I seem to remember that
you had checkpoint_segments set to 256 and checkpoint_timeout set to
30m.  It's obvious from reading this thread that you've already put
quite a bit of effort into resolving this.  My question: have you
tried _lowering_ the checkpoint settings?  If we assume that the
stall is related to checkpoint, and I'm remembering correctly on the
settings, then PostgreSQL might have as much as 4G of wal logs to
grind through to complete a checkpoint.  While not huge, if that's
trying to complete at the same time a lot of other work is going on,
it could cause stalls.  If you lower the chckpoint_segments and
checkpoint_timeout, it will cause _more_ disk activity overall, but
it will be spread out more.  Whether or not this helps with your
particular situation is dependent on whether your incidents are
caused by a spike in activity (in which case it might help) or
a cumulative effect of a lot of activity (in which case it will
probably make the situation worse).

Another thing that I may be misremembering from from your earlier
email: did you say that the load on the database was mostly write
(or am I misremembering that you said the OS graphs were showing
mostly write?)  The reason I'm asking is that we've seen problems
like you describe when trying to implement a high volume queue
in PostgreSQL: the continuous INSERT/SELECT/DELETE grind on the
single queue table was just more than PostgreSQL could keep up
with.  We moved that one portion of the application to Redis and
everything else just fell in line.  I'm stretching a bit to suppose
that you have a similar problem, but it's another data point for
you to consider.

>
> 2014-06-13 08:13:49 GMT [81383]: [224-1] LOG:  checkpoint complete:
> wrote 11065 buffers (1.4%); 0 transaction log file(s) added, 0
> removed, 56 recycled; write=789.974 s, sync=9.996 s, total=799.987 s;
> sync files=644, longest=2.055 s, average=0.015 s
>
> iostat -mx 1 2 output:
>
> Fri Jun 13 08:13:44 UTC 2014
> avg-cpu:  %user   %nice %system %iowait  %steal   %idle
>           20.31    0.00    3.13    2.21    0.00   74.36
>
> Device:         rrqm/s   wrqm/s     r/s     w/s    rMB/s    wMB/s
> avgrq-sz avgqu-sz   await  svctm  %util
> sdb               0.00   501.00    0.00  275.00     0.00     2.68
> 19.99     1.30    4.72   3.30  90.80
> sdc               0.00  9275.00    0.00 12141.00     0.00    83.52
> 14.09   142.56   11.75   0.08  99.70
>
> ..
>
> Fri Jun 13 08:13:52 UTC 2014
> avg-cpu:  %user   %nice %system %iowait  %steal   %idle
>           19.10    0.00    2.99    0.04    0.00   77.87
>
> Device:         rrqm/s   wrqm/s     r/s     w/s    rMB/s    wMB/s
> avgrq-sz avgqu-sz   await  svctm  %util
> sdb               0.00   226.00    0.00  264.00     0.00     1.40
> 10.85     0.01    0.05   0.05   1.40
> sdc               0.00   744.00    0.00  302.00     0.00     4.09
> 27.71     0.03    0.10   0.10   3.00
> sda               0.00   623.00    0.00  508.00     0.00     4.02
> 16.22     0.04    0.08   0.06   3.10
> dm-0              0.00     0.00    0.00 1030.00     0.00     4.02
> 8.00     0.11    0.11   0.03   3.30
> dm-1              0.00     0.00    0.00    0.00     0.00     0.00
> 0.00     0.00    0.00   0.00   0.00
>
> Any thoughts on that?
>
> Also, at the moment we're using ext4 as the FS for PostgreSQL.  We
> were looking to switch to XFS as part of our upgrade to PostgreSQL
> 9.3.  What's your thoughts on this?
>
> >> Once transactions stop returning, we see connections pile-up.  Eventually, we reach a max, and clients can no
longerconnect.
> >
> > You need to lower your max connections and institute connection
> > pooling yesterday. 500 connections and 256MB work mem are a recipe for
> > disaster. While a machine with a db pool in front of it can survive
> > such scenarios, lack of a pool and high work mem are killing your
> > machine.
>
> We have only 360 (max potential) connections coming to the database
> from our application servers (see below for pgbouncer configuration).
> And then a few more connections from our monitoring hosts.  In fact,
> looking at the aggregate pgbouncer active server connections we're
> only peaking at 120 connections under normal load conditions.  During
> an incident I can see it ramp up and each client using all of their
> available server connections, going up to a total of ~360 connections.
>
> Given the fact that we have 256GB RAM in our server, is your statement
> made about 500 connections @ 256MB work_mem still of a concern?  Even
> say 400 connections at a work_mem size of 256MB?  Why would we not
> want to use all of our RAM?
>
> My calculation shows that we're only using:
>
> shared_buffers + (max_connections * work_mem) +
> (autovacuum_max_workers * maintenance_work_mem)
> = 8.5GB + (500*256)MB + (6*1)GB
> = 8.5GB + 128G + 6GB
> = 142GB RAM.
>
> > I recommend pgbouncer. Dirt simple, fast, and will keep your incoming
> > connections limited to something your db can handle.
>
> We already use pgbouncer on our application servers with these
> configuration settings:
>
> pool_mode = transaction
> default_pool_size = 20
> max_client_conn = 125
> query_wait_timeout = 2
> server_idle_timeout = 60
>
> Jaco
>
>
> --
> Sent via pgsql-general mailing list (pgsql-general@postgresql.org)
> To make changes to your subscription:
> http://www.postgresql.org/mailpref/pgsql-general


--
Bill Moran <wmoran@potentialtech.com>
On Fri, Jun 13, 2014 at 1:02 PM, Jaco Engelbrecht
<jengelbrecht@atlassian.com> wrote:
> hi Scott,
>
> On 13 June 2014 00:30, Scott Marlowe <scott.marlowe@gmail.com> wrote:
>> Just the db and not the server right? Have you tried killing any
>> individual queries that seem to be problem / long running queries?
>
> We have tried to kill individual queries before and it did not have any effect.

Try killing them in groups. Do your various servers, doing different
jobs, connect with different usernames? For instance backups use one
name, etc. If so try killing the ones by a certain usename and see if
the problem resolves after that. Sorry for how hand-wavy that answer
is but I'm not sitting on a console watching, so I'm not sure what
you're seeing. If the apps all connect as the same usename then just
try killing the oldest, longest running queries first and see if you
can get it back on its feet that way.

>>> During this performance issue, we found the following symptoms.
>>> Running queries do not return.
>>
>> Even simple ones like "select 1;" ?
>> Or ones that are something like "select * from smalltable where id=123; ?
>
> SELECTs against pg_stat_activity, pg_stat_user_tables do work.
>
> Haven't done a SELECT against the affected database during an outage
> for a while now, will add that to our script to do next time.  I can't
> remember offhand either.

Worth a look. Just to see how bad it is.

>> How much memory does your machine have? How much of that is shared buf
>> then? If it's got 8G and 6G shared_buffers I'd lower shared_buffers.
>> etc
>
> 256GB RAM - FWIW, we used to have shared_buffers set to 8G but found
> two mailing list posts that seemed to suggest lowering this value
> fixed similar issues at those sites.  So we've lowered it to 6G.
> Still experienced two incidents since.

6G is still really high, esp if you write a lot. The more you write
the LOWER you want shared buffers, not higher. We have machines with
1TB RAM, we mostly read, and we still only have something like 2GB
shared_buffers.

>> What is your IO subsystem like? Is it a single 7200 RPM SATA drive, an
>> array of 16 15krpm disks under a caching raid controller? A 1TB
>> FusionIO card?
>
> A Dell PERC H700 RAID card, utilizing the CacheCade functionality (SSD
> read-cache) for PostgreSQL data only.
>
> 2x 146GB 15k SAS disks in RAID 1 for OS
> 2x 50GB SSD disks in RAID 1 for CacheCade
> 2x 146GB 15k SAS disks in RAID 1 for PostgreSQL transaction logs
> 10x 146GB 15k SAS disks in RAID1+0 for PostgreSQL data

OK good, then it's not likely you're getting hammered by the IO subsystem.

>> Just because linux SAYS there's wait doesn't mean there isn't one.
>> Sometimes the io wait numbers are zero while some kernel daemon uses
>> up all the bandwidth and you really are waiting.
>
> OK - any ideas on how to further investigate/validate this?

No it looks like IO isn't really the issue.

> Having said that, before an incident (again this morning), I can see
> high disk latency (23,000 ms) on /pg_data disks (sdc) (and the graph
> of temp_files is now empty during incidents).

OK so IO is getting overwhelmed slowly but it doesn't look like IO is
purely the issue.

What I think is happening is that you're getting too many heavy
connections at once, slowly bringing down performance, and then it
just eventually overwhelms the box with too many connections trying to
do too much at once.

> This coincides with a checkpoint:
>
> 2014-06-13 08:13:49 GMT [81383]: [224-1] LOG:  checkpoint complete:
> wrote 11065 buffers (1.4%); 0 transaction log file(s) added, 0
> removed, 56 recycled; write=789.974 s, sync=9.996 s, total=799.987 s;
> sync files=644, longest=2.055 s, average=0.015 s
>
> iostat -mx 1 2 output:
>
> Fri Jun 13 08:13:44 UTC 2014
> avg-cpu:  %user   %nice %system %iowait  %steal   %idle
>           20.31    0.00    3.13    2.21    0.00   74.36
>
> Device:         rrqm/s   wrqm/s     r/s     w/s    rMB/s    wMB/s
> avgrq-sz avgqu-sz   await  svctm  %util
> sdb               0.00   501.00    0.00  275.00     0.00     2.68
> 19.99     1.30    4.72   3.30  90.80
> sdc               0.00  9275.00    0.00 12141.00     0.00    83.52
> 14.09   142.56   11.75   0.08  99.70

I assume this is during a checkpoint

and this is after:

> Fri Jun 13 08:13:52 UTC 2014
> avg-cpu:  %user   %nice %system %iowait  %steal   %idle
>           19.10    0.00    2.99    0.04    0.00   77.87
>
> Device:         rrqm/s   wrqm/s     r/s     w/s    rMB/s    wMB/s
> avgrq-sz avgqu-sz   await  svctm  %util
> sdb               0.00   226.00    0.00  264.00     0.00     1.40
> 10.85     0.01    0.05   0.05   1.40
> sdc               0.00   744.00    0.00  302.00     0.00     4.09
> 27.71     0.03    0.10   0.10   3.00
>
> Any thoughts on that?

Looks normal if that's during / after a checkpoint. Lowering
checkpoint completion target may result in less checkpoint churn but
more io used by the bgwriter.

> Also, at the moment we're using ext4 as the FS for PostgreSQL.  We
> were looking to switch to XFS as part of our upgrade to PostgreSQL
> 9.3.  What's your thoughts on this?

I've had pretty good luck with ext4. I doubt it's the problem here.
XFS is a good file system. and worth looking into but I don't expect
it to fix this issue.

>>> Once transactions stop returning, we see connections pile-up.  Eventually, we reach a max, and clients can no
longerconnect.
>>
>> You need to lower your max connections and institute connection
>> pooling yesterday. 500 connections and 256MB work mem are a recipe for
>> disaster. While a machine with a db pool in front of it can survive
>> such scenarios, lack of a pool and high work mem are killing your
>> machine.
>
> We have only 360 (max potential) connections coming to the database
> from our application servers (see below for pgbouncer configuration).
> And then a few more connections from our monitoring hosts.  In fact,
> looking at the aggregate pgbouncer active server connections we're
> only peaking at 120 connections under normal load conditions.  During
> an incident I can see it ramp up and each client using all of their
> available server connections, going up to a total of ~360 connections.
>
> Given the fact that we have 256GB RAM in our server, is your statement
> made about 500 connections @ 256MB work_mem still of a concern?  Even
> say 400 connections at a work_mem size of 256MB?  Why would we not
> want to use all of our RAM?

That's WAY TOO many connections. Assuming you've got 16 to 32 cores,
you should be limiting inbound total connections to 2x that max. If
you benchmark your app against your db (you can use pgbench with
custom scripts to get something similar to your prod load) you should
get a graph that starts low throughput at 1 conn, builds up through
somewhere around 1x to 2x your cores, an then drops off after that.
The shape of the tail of that curve tells you how your db will behave
in overload. If it drops off real fast then limiting incoming
connections becomes more important. If it drops off real slow and
linearly then it's not as big of a deal.

Either way 400 connections is way too high. Limit your app servers to
something smaller so you get your inbound connections down to 1x to 2x
cores. Sometimes running a dedicated pgbouncer box (or pair etc) will
allow you to limit these connections without starving any one box. You
can also setup various pools for different jobs so each one is limited
in a different way. A read only client can probably have a 100 inbound
and not mess up the box if it isn't reading and sorting megabytes of
data etc.

Lastly, if your dataset is bigger than ram, you WILL be using all your
RAM even with small shared_buffers and work_mem because the OS will be
using that spare memory to cache. The OS is VERY good at caching large
chunks of data, and letting it use that spare memory is usually a good
thing. OTOH, if you've got a 20G db and 256G RAM Then go for it. Leave
enough spare memory to always have the db cached and you're good.

But if you're using pgbouncer wisely, and limiting incoming to say 40
connections instead of 400 then you can't overload your box with 256M
work_mem because the max is 10 or 20GIg or so. With 400 inbound
connections your sorts may be taking up spare ram and forcing the OS
to evict it's own caches etc, slowing things down even more since you
now have to go to drive to get all your data, not kernel fs cache.

> My calculation shows that we're only using:
>
> shared_buffers + (max_connections * work_mem) +
> (autovacuum_max_workers * maintenance_work_mem)
> = 8.5GB + (500*256)MB + (6*1)GB
> = 8.5GB + 128G + 6GB
> = 142GB RAM.

That's still a LOT of memory. But you're probably not using it all.

>> I recommend pgbouncer. Dirt simple, fast, and will keep your incoming
>> connections limited to something your db can handle.
>
> We already use pgbouncer on our application servers with these
> configuration settings:
>
> pool_mode = transaction
> default_pool_size = 20
> max_client_conn = 125
> query_wait_timeout = 2
> server_idle_timeout = 60

So you must have a lot of app servers to be seeing 400 inbound
connections. 20 or more? Each one allowing 20 connections is a LOT.

Let's say your peak throughput is at 32 connections. This is pretty
common with a 16 core machine with the number of drives you have.
Let's say that you can do 500 of your heaviest transactions per second
there, and that it goes down enough so that by the time you get to 64
connections, you're at 50% that, or 250. Given that slope, by the time
you get to 512 connections you're handling 20 or 30 transactions per
second.

Getting that number down to something closer to your best throughput
number is gonna make a huge difference. Keep in mind the other queries
on the app servers will just be in a wait state, but your db server
will still be clearing transactions at a much higher rate than if it's
being overloaded.
--

To understand recursion, one must first understand recursion.
Hi Bill,

On 13 June 2014 20:35, Bill Moran <wmoran@potentialtech.com> wrote:
> On Fri, 13 Jun 2014 20:02:01 +0100 Jaco Engelbrecht <jengelbrecht@atlassian.com> wrote:
>>
>> This coincides with a checkpoint:
>
> There's a lot going on here (as always with a busy server) but I suspected
> a checkpoint problem earlier, and this statement and your additional
> information makes me suspect even harder.
>
> In your earlier email with the .conf file, I seem to remember that
> you had checkpoint_segments set to 256 and checkpoint_timeout set to
> 30m.  It's obvious from reading this thread that you've already put
> quite a bit of effort into resolving this.  My question: have you
> tried _lowering_ the checkpoint settings?  If we assume that the
> stall is related to checkpoint, and I'm remembering correctly on the
> settings, then PostgreSQL might have as much as 4G of wal logs to
> grind through to complete a checkpoint.  While not huge, if that's
> trying to complete at the same time a lot of other work is going on,
> it could cause stalls.  If you lower the chckpoint_segments and
> checkpoint_timeout, it will cause _more_ disk activity overall, but
> it will be spread out more.  Whether or not this helps with your
> particular situation is dependent on whether your incidents are
> caused by a spike in activity (in which case it might help) or
> a cumulative effect of a lot of activity (in which case it will
> probably make the situation worse).

Thanks, we're going to look into that.

I checked our revision history to see if we changed any checkpoint
settings over the last year and we have not, however what I did notice
was that a few days before we first experienced this issue we
increased the wal_keep_segments from 256 to 1024 (and then later
further to 1536) in order to keep enough WAL records around for our
backups.

Sure enough, I just found a post at
http://www.postgresql.org/message-id/CAPVp=gbKVbNr1zQM_LKauNY-U1PHB++y=Xq26K-dXdDsffv_PQ@mail.gmail.com
describing a similar issue related to having wal_keep_segments set to
1024 (with a much lower checkpoint_segments set - 32) but no
resolution on the list.

Any thoughts on the wal_keep_segments we have set to 1024 currently?

> Another thing that I may be misremembering from from your earlier
> email: did you say that the load on the database was mostly write
> (or am I misremembering that you said the OS graphs were showing
> mostly write?)  The reason I'm asking is that we've seen problems
> like you describe when trying to implement a high volume queue
> in PostgreSQL: the continuous INSERT/SELECT/DELETE grind on the
> single queue table was just more than PostgreSQL could keep up
> with.  We moved that one portion of the application to Redis and
> everything else just fell in line.  I'm stretching a bit to suppose
> that you have a similar problem, but it's another data point for
> you to consider.

Yes, mostly writes.  We already use Redis for some aspects of the
site, but we'll look into what else we could move there.

Jaco
The cpu utilization increases to nearly 100%, in user space, and stays there, until the database is restarted.
postgres 1323 47.1 2.3 6667212 6087388 ? Rs 00:00 276:00 \_ postgres: bitbucket bitbucket 172.17.10.1(5114) SELECT
I see you have long-query logging enabled, what was this query doing? It seems like the oddball from your ps output, it was taking half your CPU. Or did you have to kill the db before it logged anything out. If so, while debugging something with a memory problem here we set up a cronjob to log out all running queries every minute, before the oom-killer would start killing stuff, maybe you could catch the culprit next time.
For the pids that you included strace outputs for, curious, why did you pick them? Were they using a lot of CPU? Except for the postmaster one (81372), I didn't see them in the ps output.