[pgadmin-hackers] [PlumAdmin][Weekly Design Update] - Mailing list pgadmin-hackers
| From | Shirley Wang |
|---|---|
| Subject | [pgadmin-hackers] [PlumAdmin][Weekly Design Update] |
| Date | |
| Msg-id | CAPG3WN7YxVO+n3qbDOWQBWY0rkscq1ar-5V-PJBSEPPZNsT_qw@mail.gmail.com Whole thread Raw |
| Responses |
Re: [pgadmin-hackers] [PlumAdmin][Weekly Design Update]
Re: [pgadmin-hackers] [PlumAdmin][Weekly Design Update] |
| List | pgadmin-hackers |
Hello all!
2.22.17 Weekly Update
Current Work
History : Enabling users to be able to see their full queries within the history panel
What we know
Users want to reuse queries when they are iterating upon previously run queries
When the changes are small, retyping queries is a painful and time consuming process
Users tend to use the text editor as their history, choosing not to delete each query after running it, or type out full queries in another application and copy/paste it into pgAdmin when they need to run it.
Current Design [WORK IN PROGRESS]
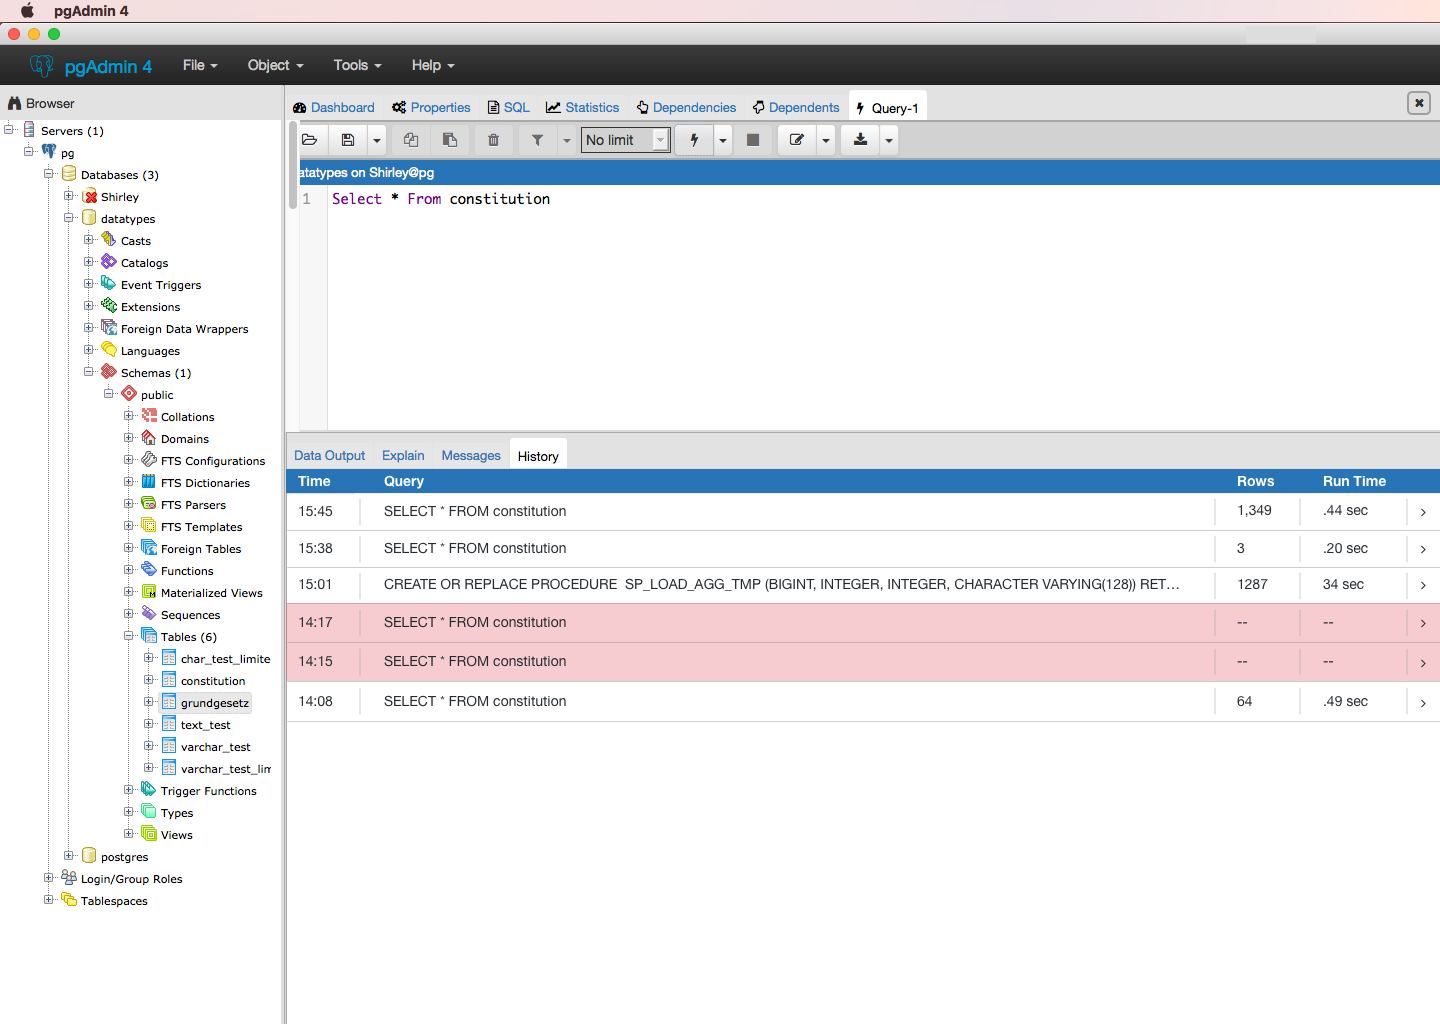
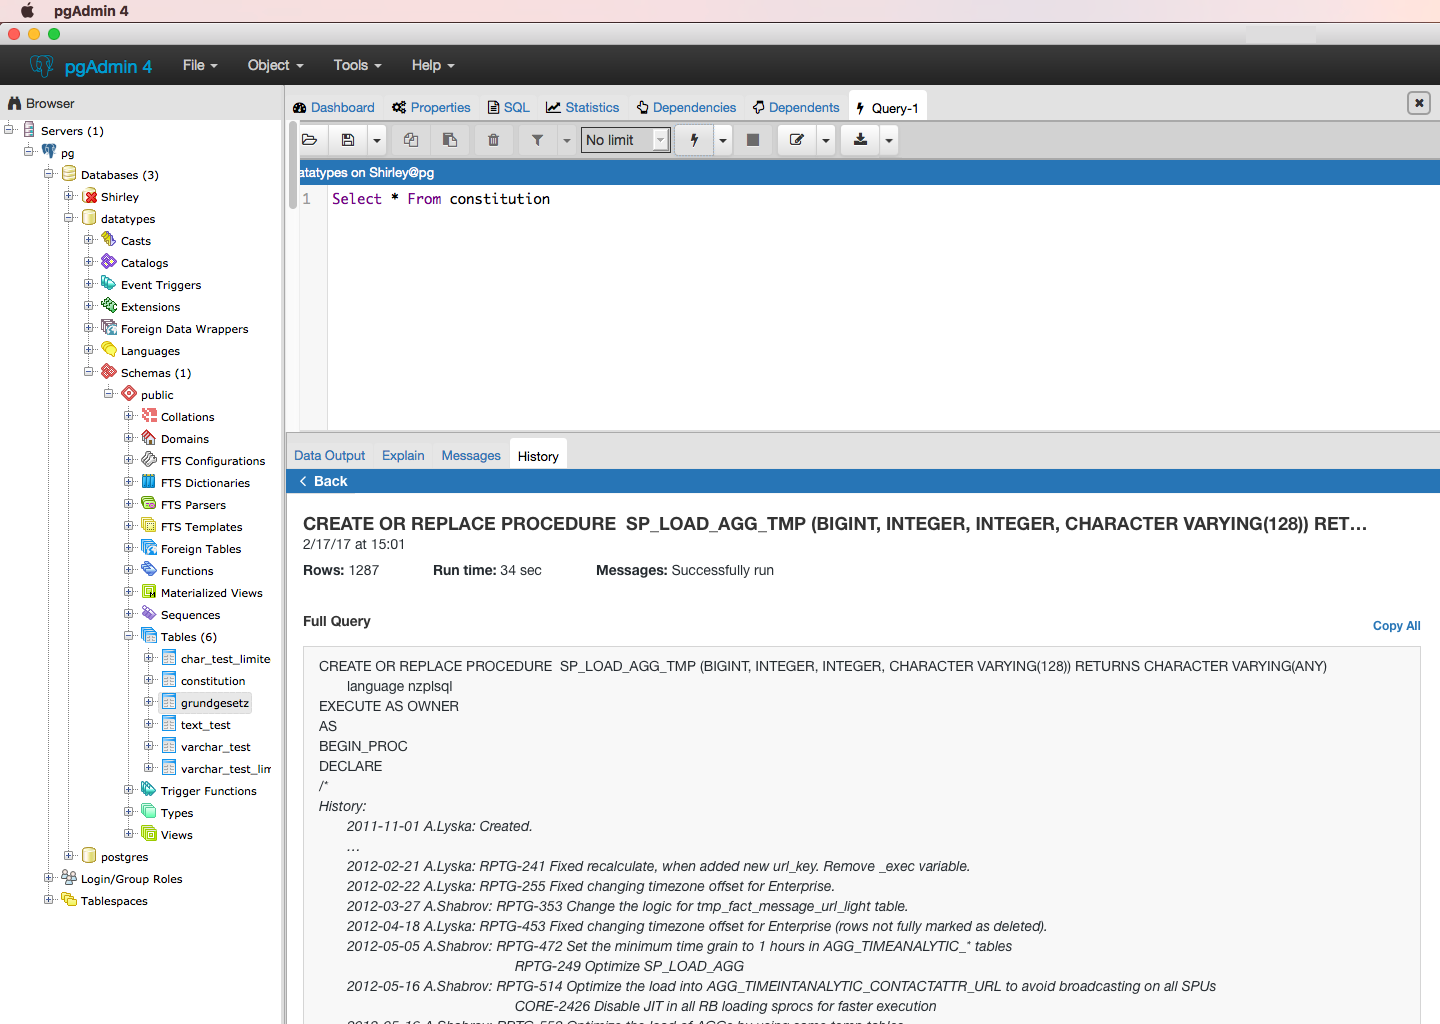
1. See history after running query

Columns should be fixed width. Red highlight indicates if query was able to run Users can click on each row to see details.
2. Expand history v1

Users expand/collapse each row by clicking on the drop down arrow to the left. Full query should appear, with the ability to scroll to see entire query.
Questions:
Is the drop down arrow affordance enough for users to know how to collapse/expand?
What happens if users scroll down a very long query and want to go back up?
3. Expand history v2

Panel slides to the left to show query details.
Questions:
Do users need to see query details in context of the other queries?
What we’re working to validate
Do users need to compare two previously run queries? (Is this an edge case we need to account for?)
What value does seeing time offer? If it’s to see how long ago I ran this query, how might we better display time to enable this?
What is the best way for displaying a 1000+ line query?
Autoformat: Enabling users to quickly organize unformatted code into something readable
What we know
Users need to quickly be able to organize it for scanning and reading.
Current Design [WORK IN PROGRESS]
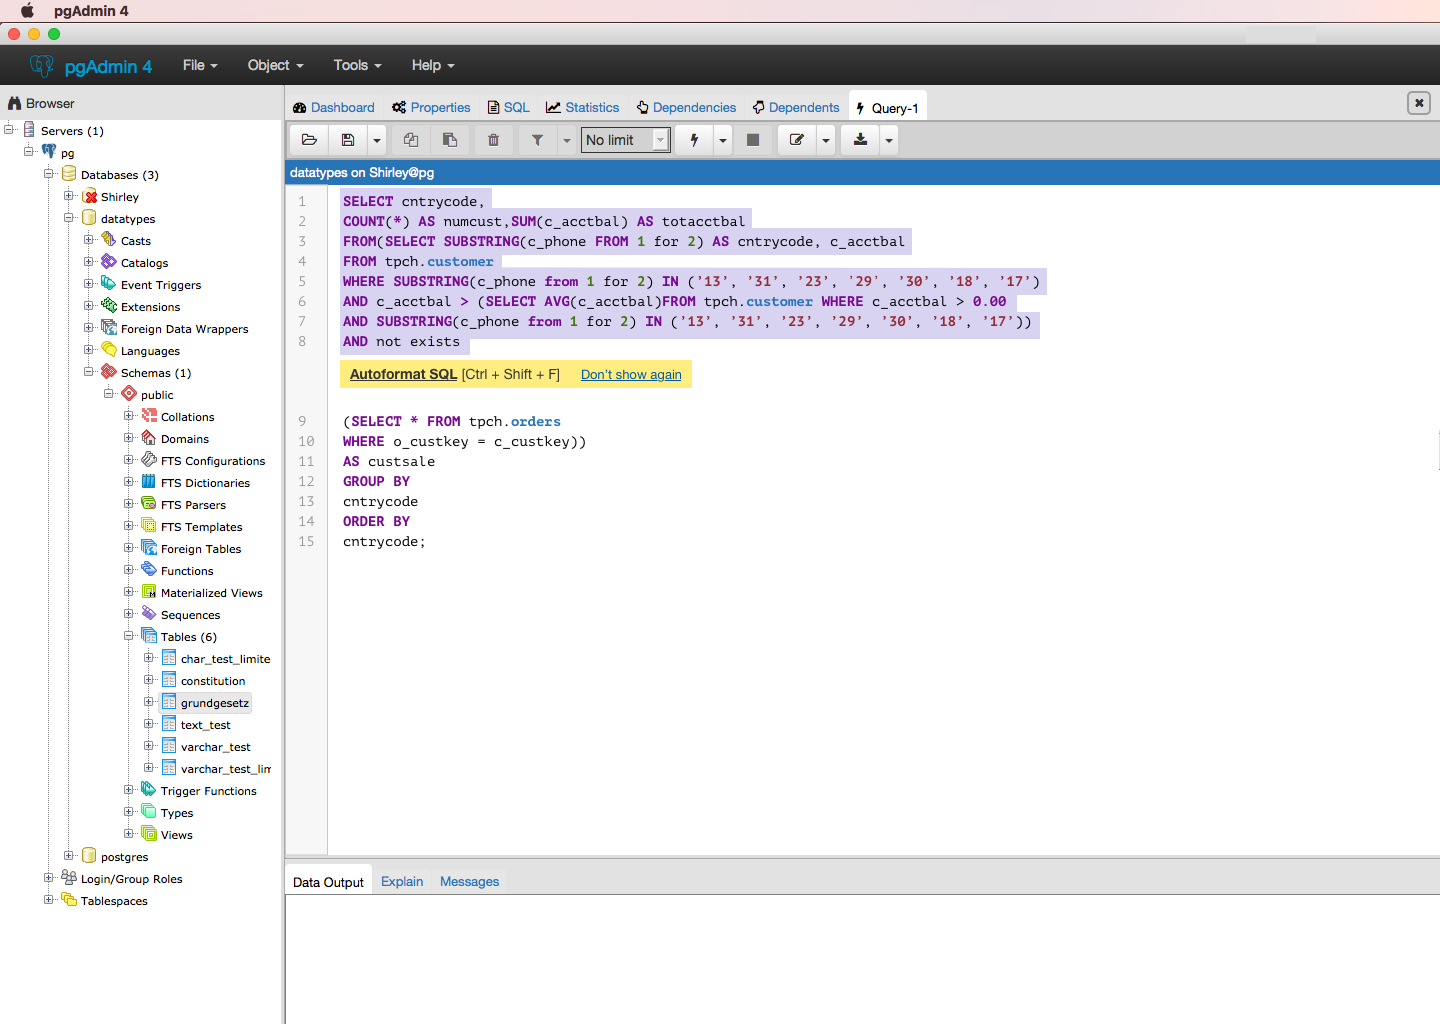
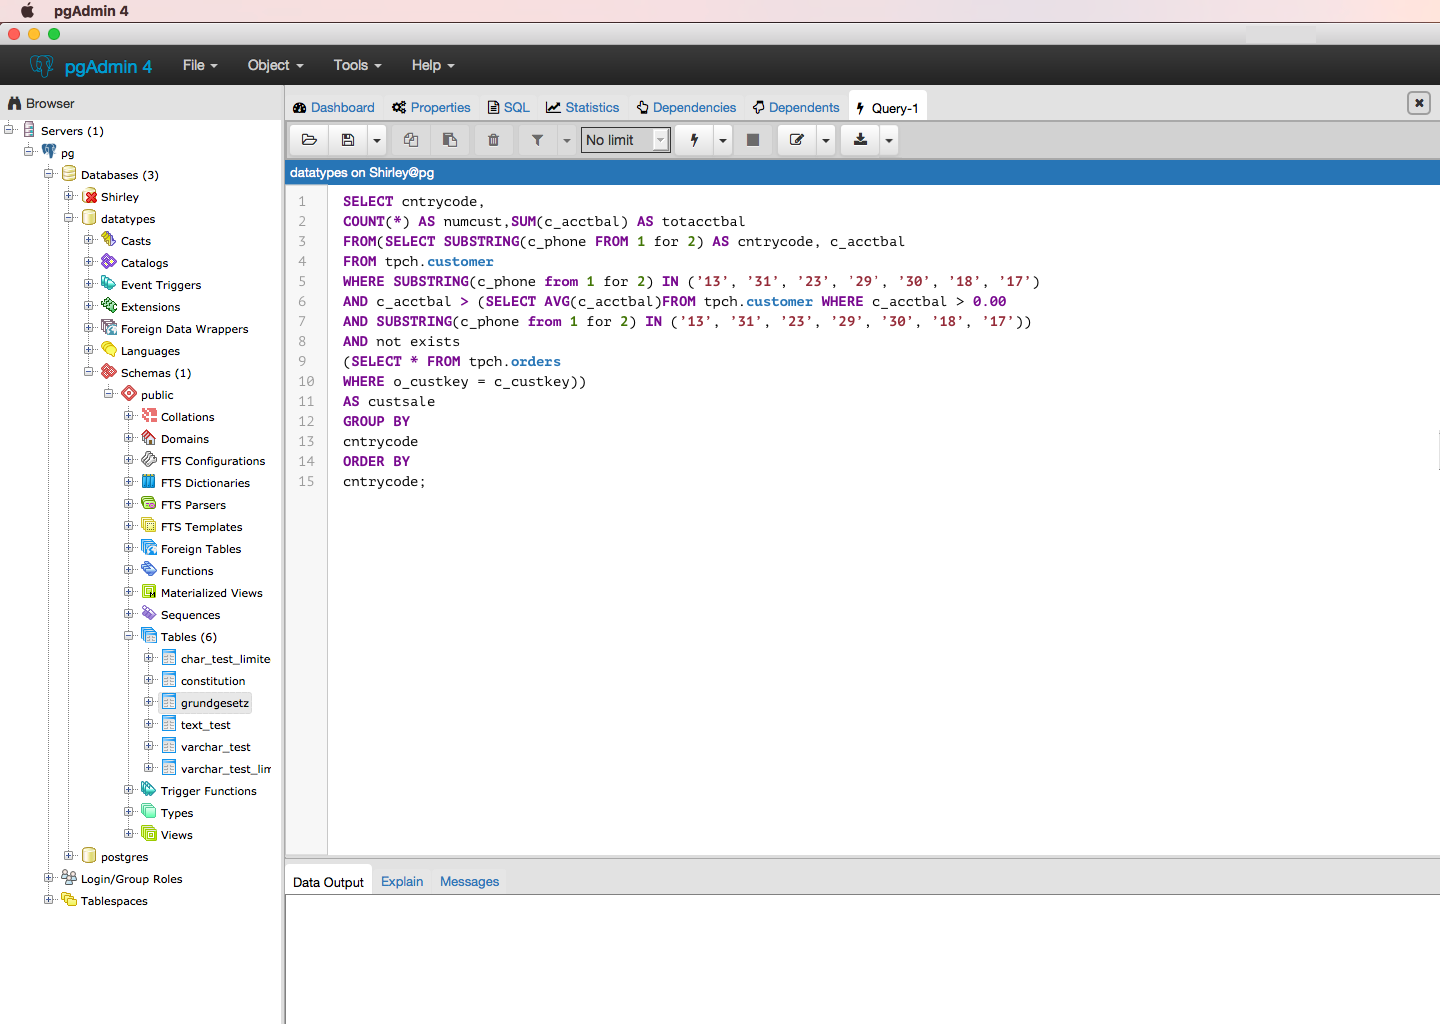
1. Place unformatted query into editor

2. Autoformat tip appears after highlighting text v1

Highlight would appear below selection of text. Users have option of clicking ‘Autoformat SQL’ or using the keyboard shortcut. If they no longer want to see the tip, they can select ‘Don’t show again’.
Yellow was chosen because it is differentiated enough from purple and blue to be noticeable by users. We wanted to introduce a new color to indicate that this pop up was different from the other notifications that appear.
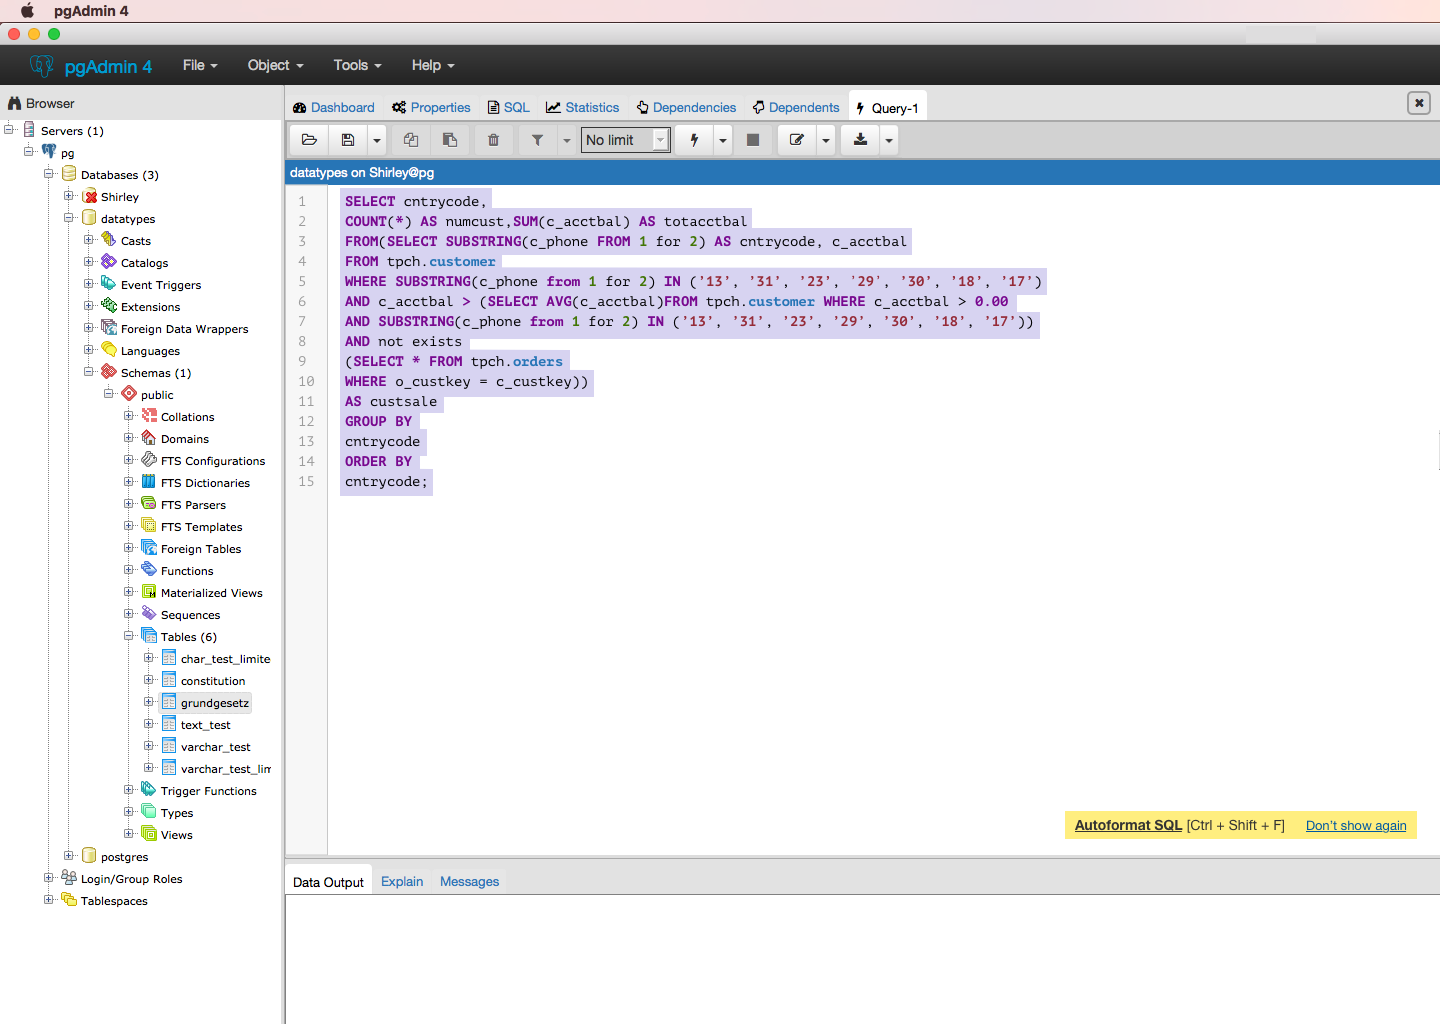
3. Autoformat tip appears after highlighting text v2

Same notification as v1, with the placement being in the bottom right corner.
What we’re working to validate
Users need to see how to autoformat after they highlight a section of text
Where autoformat function can be placed to be useful with minimal distraction
_______________________
Future work [Needs User Validation]
Redesign Dashboard: Enable Greenplum users to see only relevant info
What we know:
We assume that the graphs on the dashboard are not necessary for users of Greenplum to see
Dashboard elements are useful for other users and they need to view it
What we’re working to validate
If removing the graph will impact the experience negatively for Greenplum users
Starting up on pgAdmin: Upon opening pgAdmin, enable users to quickly get set up to begin querying databases
What we know
The current process for getting to the query editor tool is a multi-step task that involves the user clicking into the browser for the right table.
Most users have said their purpose for using pgAdmin is to write queries, so we want to get users to that point as fast as possible.
How we will validate
Interviews with pgAdmin users on their needs when opening pgAdmin
Testing wireframes
____________________
Potential Blockers
No established pool of users to talk to, very ad hoc
Unknown technical feasibility + constraints
Attachment
pgadmin-hackers by date: