[PERFORM] Fwd: Slow query from ~7M rows, joined to two tables of ~100 rows each - Mailing list pgsql-performance
| From | Chris Wilson |
|---|---|
| Subject | [PERFORM] Fwd: Slow query from ~7M rows, joined to two tables of ~100 rows each |
| Date | |
| Msg-id | CAOg7f83Z6Cixa97jfK4MwC_gZUSnghpq+Uo=qUOufhOyBDiq6Q@mail.gmail.com Whole thread |
| Responses |
[PERFORM] Re: Fwd: Slow query from ~7M rows, joined to two tables of ~100 rowseach
Re: [PERFORM] Fwd: Slow query from ~7M rows, joined to two tables of~100 rows each |
| List | pgsql-performance |
Dear pgsql-performance list,
I think I've found a case where the query planner chooses quite a suboptimal plan for joining three tables. The main "fact" table (metric_value) links to two others with far fewer rows (like an OLAP/star design). We retrieve and summarise a large fraction of rows from the main table, and sort according to an index on that table, and I'd like to speed it up, since we will need to run this query many times per day. I would really appreciate your advice, thank you in advance!
The following SQL creates test data which can be used to reproduce the problem:
drop table if exists metric_pos;create table metric_pos (id serial primary key, pos integer);insert into metric_pos (pos) SELECT (random() * 1000)::integer from generate_series(1,100);create index idx_metric_pos_id_pos on metric_pos (id, pos);drop table if exists asset_pos;create table asset_pos (id serial primary key, pos integer);insert into asset_pos (pos) SELECT (random() * 1000)::integer from generate_series(1,100);drop TABLE if exists metric_value;CREATE TABLE metric_value(id_asset integer NOT NULL,id_metric integer NOT NULL,value double precision NOT NULL,date date NOT NULL,timerange_transaction tstzrange NOT NULL,id bigserial NOT NULL,CONSTRAINT cons_metric_value_pk PRIMARY KEY (id))WITH (OIDS=FALSE);insert into metric_value (id_asset, id_metric, date, value, timerange_transaction)select asset_pos.id, metric_pos.id, generate_series('2015-06-01'::date, '2017-06-01'::date, '1 day'), random() * 1000, tstzrange(current_timestamp, NULL) from metric_pos, asset_pos;CREATE INDEX idx_metric_value_id_metric_id_asset_date ON metric_value (id_metric, id_asset, date, timerange_transaction, value);
This is an example of the kind of query we would like to speed up:
SELECT metric_pos.pos AS pos_metric, asset_pos.pos AS pos_asset, date, valueFROM metric_valueINNER JOIN asset_pos ON asset_pos.id = metric_value.id_assetINNER JOIN metric_pos ON metric_pos.id = metric_value.id_metricWHEREdate >= '2016-01-01' and date < '2016-06-01'AND timerange_transaction @> current_timestampORDER BY metric_value.id_metric, metric_value.id_asset, date
This takes ~12 seconds from psql. Wrapping it in "SELECT SUM(value) FROM (...) AS t" reduces that to ~8 seconds, so the rest is probably data transfer overhead which is unavoidable.
The actual query plan selected is (explain.depesz.com):
Sort (cost=378949.08..382749.26 rows=1520071 width=28) (actual time=7917.686..8400.254 rows=1520000 loops=1)Sort Key: metric_value.id_metric, metric_value.id_asset, metric_value.dateSort Method: external merge Disk: 62408kBBuffers: shared hit=24421 read=52392, temp read=7803 written=7803-> Hash Join (cost=3.31..222870.41 rows=1520071 width=28) (actual time=0.295..6049.550 rows=1520000 loops=1)Hash Cond: (metric_value.id_asset = asset_pos.id)Buffers: shared hit=24421 read=52392-> Nested Loop (cost=0.56..201966.69 rows=1520071 width=24) (actual time=0.174..4671.452 rows=1520000 loops=1)Buffers: shared hit=24420 read=52392-> Seq Scan on metric_pos (cost=0.00..1.50 rows=100 width=8) (actual time=0.015..0.125 rows=100 loops=1)Buffers: shared hit=1-> Index Only Scan using idx_metric_value_id_metric_id_asset_date on metric_value (cost=0.56..1867.64 rows=15201 width=20) (actual time=0.090..40.978 rows=15200 loops=100) Index Cond: ((id_metric = metric_pos.id) AND (date >= '2016-01-01'::date) AND (date < '2016-06-01'::date))Filter: (timerange_transaction @> now())Heap Fetches: 1520000Buffers: shared hit=24419 read=52392-> Hash (cost=1.50..1.50 rows=100 width=8) (actual time=0.102..0.102 rows=100 loops=1)Buckets: 1024 Batches: 1 Memory Usage: 12kBBuffers: shared hit=1-> Seq Scan on asset_pos (cost=0.00..1.50 rows=100 width=8) (actual time=0.012..0.052 rows=100 loops=1)Buffers: shared hit=1Planning time: 1.498 msExecution time: 8992.846 ms
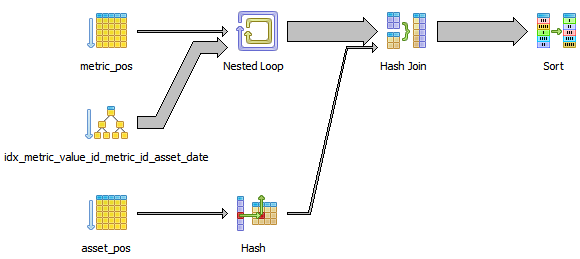
Or visually:
What I find interesting about this query plan is:
The records can already be read in order from idx_metric_value.... If this was selected as the primary table, and metric_pos was joined to it, then the output would also be in order, and no sort would be needed.
We should be able to use a merge join to metric_pos, because it can be read in order of id_metric (its primary key, and the first column in idx_metric_value...). If not, a hash join should be faster than a nested loop, if we only have to hash ~100 records.
I think that the joins should be fairly trivial: easily held in memory and indexed by relatively small integers. They would probably be temporary tables in our real use case. But removing them (and just selecting the IDs from metric_value) cuts 4 seconds off the query time (to 3.3 seconds). Why are they slow?
If I remove one of the joins (asset_pos) then I get a merge join between two indexes, as expected, but it has a materialize just before it which makes no sense to me. Why do we need to materialize here? And why materialise 100 rows into 1.5 million rows? (explain.depesz.com)
SELECT metric_pos.pos AS pos_metric, id_asset AS pos_asset, date, valueFROM metric_valueINNER JOIN metric_pos ON metric_pos.id = metric_value.id_metricWHEREdate >= '2016-01-01' and date < '2016-06-01'AND timerange_transaction @> current_timestampORDER BY metric_value.id_metric, metric_value.id_asset, dateMerge Join (cost=0.70..209302.76 rows=1520071 width=28) (actual time=0.097..4899.972 rows=1520000 loops=1)Merge Cond: (metric_value.id_metric = metric_pos.id)Buffers: shared hit=76403-> Index Only Scan using idx_metric_value_id_metric_id_asset_date on metric_value (cost=0.56..182696.87 rows=1520071 width=20) (actual time=0.074..3259.870 rows=1520000 lo ops=1)Index Cond: ((date >= '2016-01-01'::date) AND (date < '2016-06-01'::date))Filter: (timerange_transaction @> now())Heap Fetches: 1520000Buffers: shared hit=76401-> Materialize (cost=0.14..4.89 rows=100 width=8) (actual time=0.018..228.265 rows=1504801 loops=1)Buffers: shared hit=2-> Index Only Scan using idx_metric_pos_id_pos on metric_pos (cost=0.14..4.64 rows=100 width=8) (actual time=0.013..0.133 rows=100 loops=1)Heap Fetches: 100Buffers: shared hit=2Planning time: 0.761 msExecution time: 5253.260 ms
The size of the result set is approximately 91 MB (measured with psql -c | wc -c). Why does it take 4 seconds to transfer this much data over a UNIX socket on the same box? Can it be made faster? The data is quite redundant (it's sorted for a start) so compression makes a big difference, and simple prefix elimination could probably reduce the volume of redundant data sent back to the client.
Standard background info:
- PostgreSQL 9.6.2 on x86_64-pc-linux-gnu, compiled by gcc (GCC) 4.8.5 20150623 (Red Hat 4.8.5-4), 64-bit, compiled from source.
- shared_buffers = 15GB, work_mem = 100MB, seq_page_cost = 0.5, random_page_cost = 1.0, cpu_tuple_cost = 0.01.
- HP ProLiant DL580 G7, Xeon(R) CPU E7- 4850 @ 2.00GHz * 80 cores, hardware RAID, 3.6 TB SAS array.
Thanks again in advance for any suggestions, hints or questions.
Cheers, Chris.
Attachment
pgsql-performance by date: