On Tue, Dec 19, 2017 at 2:55 PM, Haisheng Yuan <hyuan@pivotal.io> wrote:
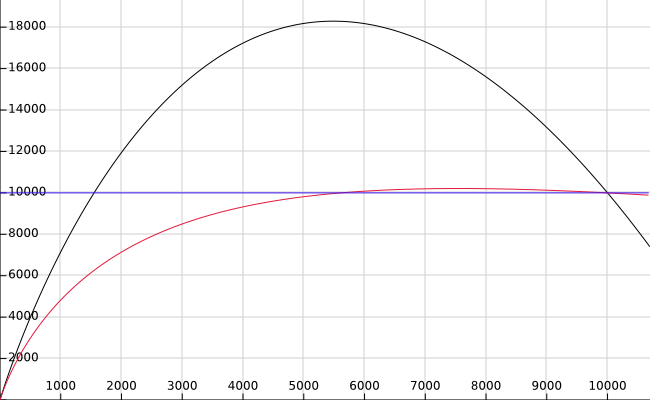
Below is the graph (credit to Heikki) that plots the total estimated cost of a bitmap heap scan, where table size is 10000 pages, and random_page_cost=10 and seq_page_cost=1. X axis is the number of pages fetche. I.e. on the left, no pages are fetched, and on the right end, at 10000, all pages are fetched. The original formula is in black, the new formula in red, and the horizontal line, in blue, shows the cost of a Seq Scan.
Thoughts? Any better ideas?
The parabola-shape curve we're getting at present is clearly wrong; approaching a horizontal line as an asymptote seems much better. However, shouldn't the red line level off at some level *above* the blue line rather than *at* the blue line? Reading the index pages isn't free, so a sequential scan should be preferred when we're going to read the whole table anyway.