Re: Proposal Dashboard design for system of pgadmin - Mailing list pgadmin-hackers
| From | Dave Page |
|---|---|
| Subject | Re: Proposal Dashboard design for system of pgadmin |
| Date | |
| Msg-id | CA+OCxow=uQ03Uzgo+=0VXFdGY27dhO8DsqKrHGcxH79SZeKEPw@mail.gmail.com Whole thread |
| In response to | Re: Proposal Dashboard design for system of pgadmin (Kunal Garg <gargkunal02@gmail.com>) |
| Responses |
Re: Proposal Dashboard design for system of pgadmin
|
| List | pgadmin-hackers |
Plan:-
To integrate a detailed view of system activity into the existing pgAdmin dashboard following a consistent design that matches the existing UI/UX and meets User Acceptance Testing Standards.
Proposed Layout Design:-
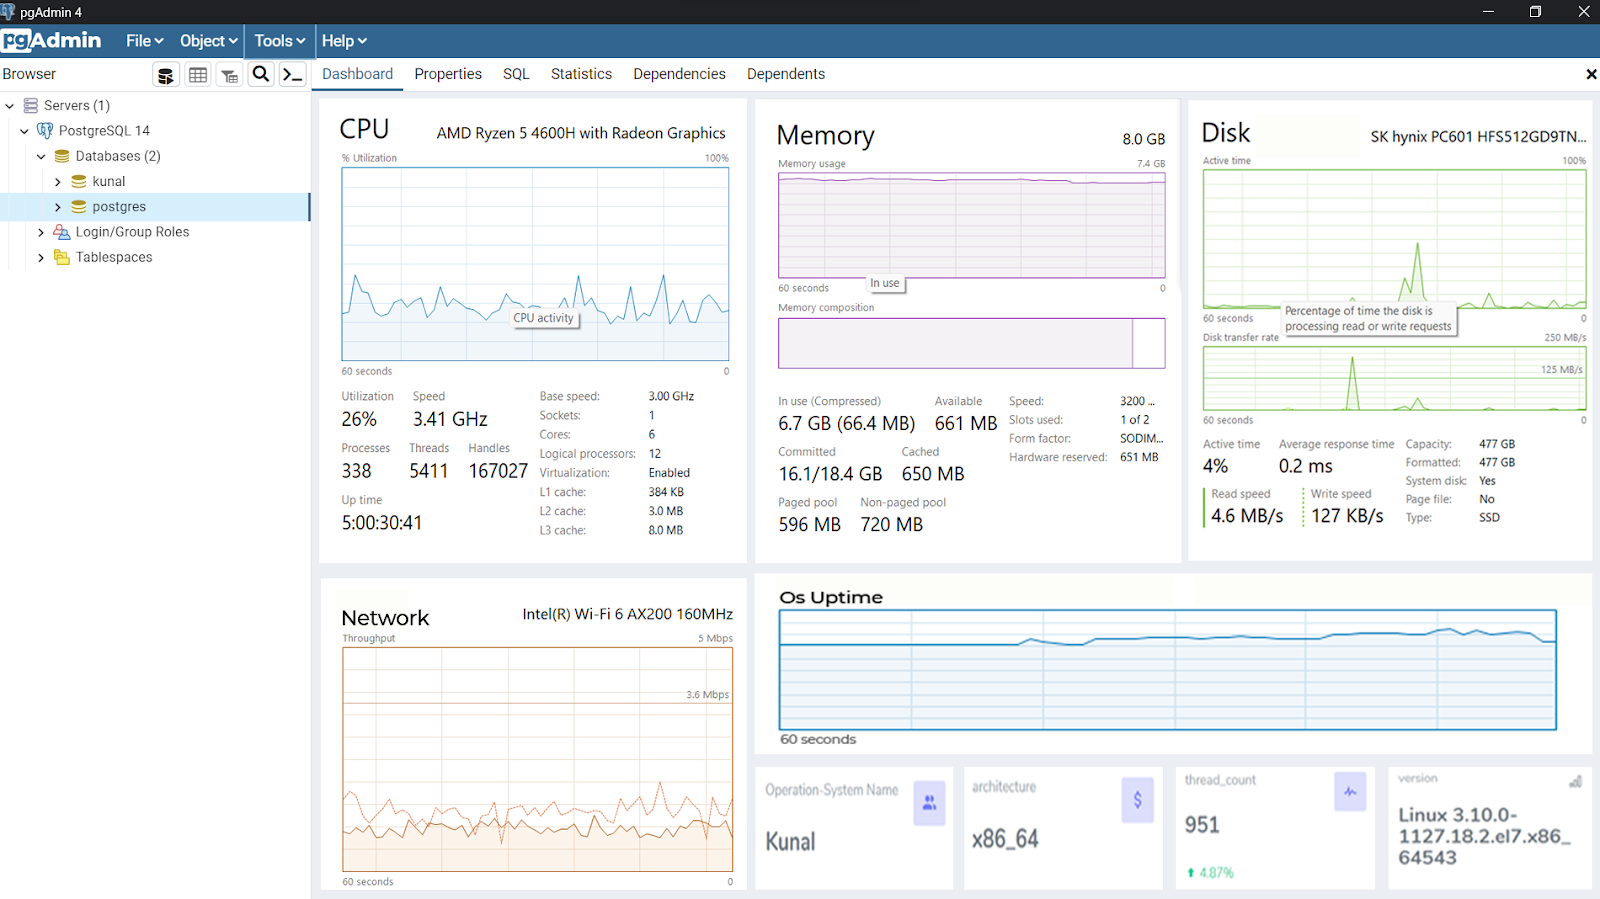
Data fetched from queries:-
Details of different queries will be shown on a given component/card as shown in the design.
Impact on the existing layout:-
Existing layout will remain the same for most of the part. Here are some options for showing the system stats dashboard option to the users.
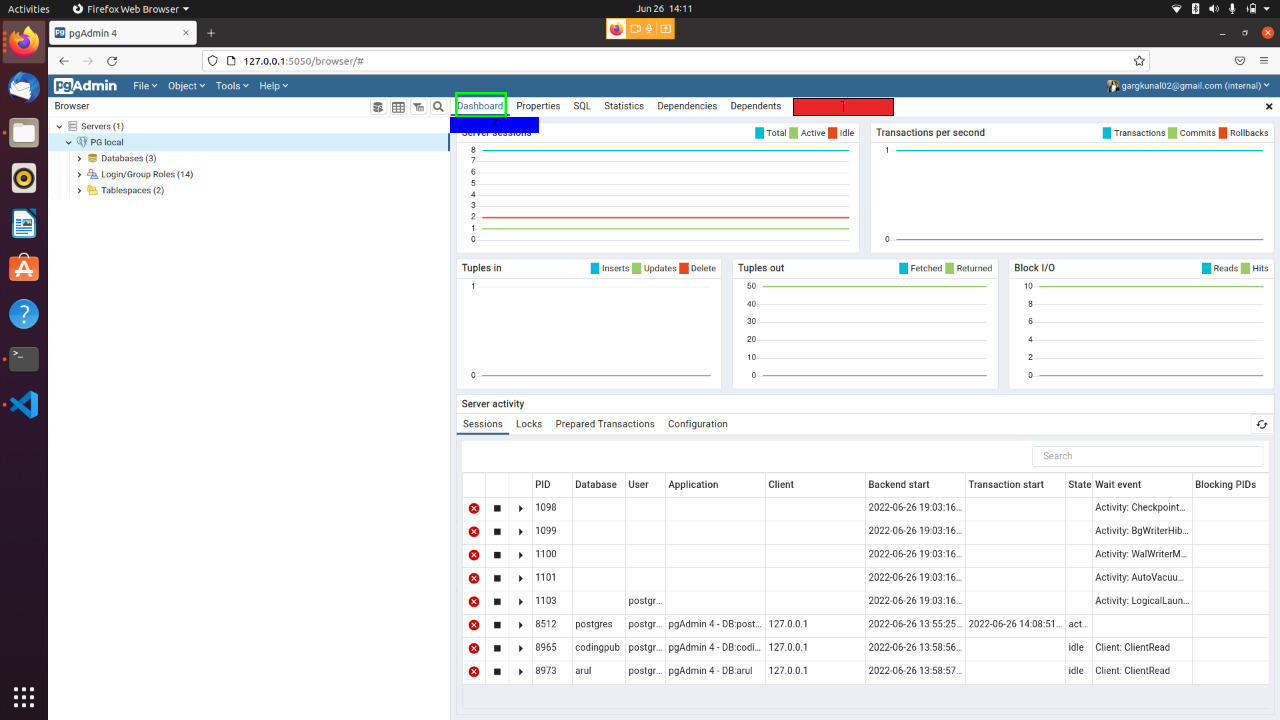
New button for system statistics on the Dashboard Navbar (refer to the red box in the image for the location of this button)
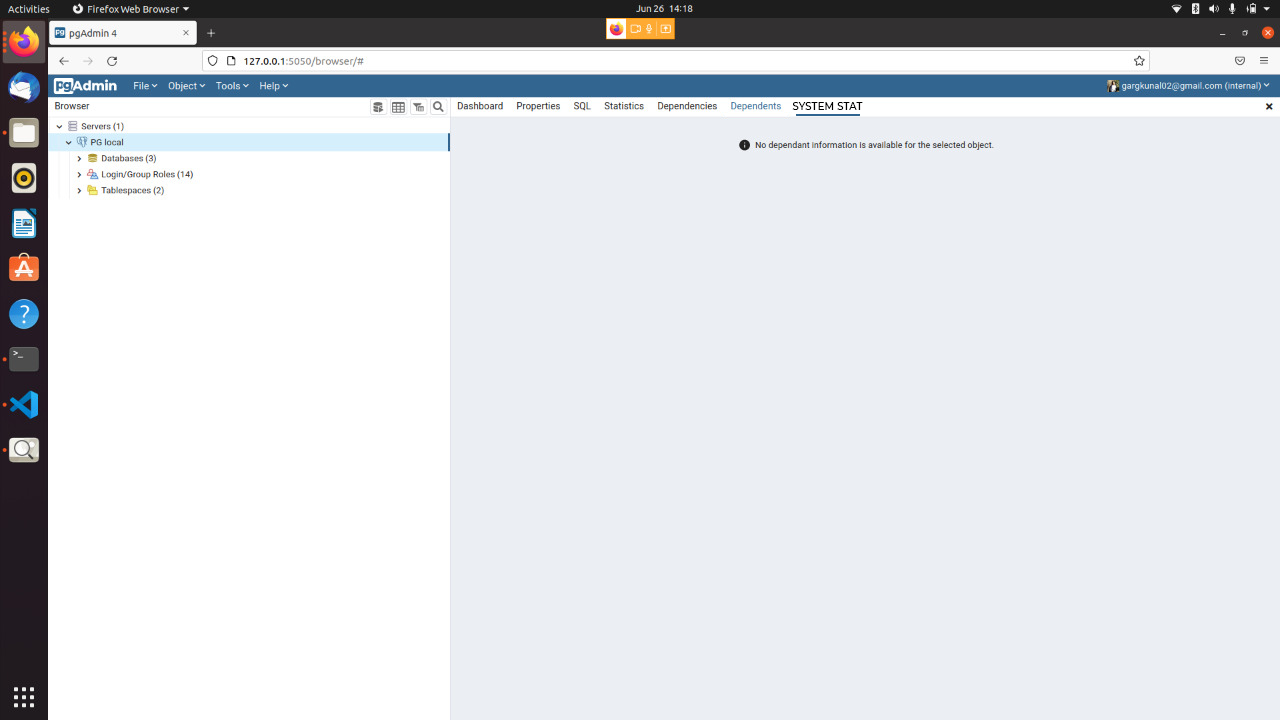
UI impact when the system_stats extension is not present in the PostgreSQL instance:
The page will open as usual with the following message,
“No system statistics information is available for the selected object”
On hovering over the Dashboard tab, a dropdown will come, giving the user an option to select either the already existing pgadmin dashboard or the system statistics dashboard. (refer to the green box in the image for the location of this button)
UI impact when the system_stats extension is not present in the PostgreSQL instance:
This will happen only when the user has not selected any server, then the dashboard will open as usual as shown in the image.
On Selecting the Dashboard tab, 2 new buttons will be displayed under the dashboard tab, clicking any one will show the respective dashboard. (refer to the blue box in the image for the location of this button)
UI impact when the system_stats extension is not present in the PostgreSQL instance:
This will happen only when the user has not selected any server, then the dashboard will open as usual as shown in the image
Note: The dashboards are contextual, they're dependent on the node selected on the left-hand side tree, that is, the values change as per the server node selected. Similarly, the system statistics dashboard will also be contextual and change with the selected server.
Filters available in the preferences:-
Under the files tab -> Preferences
In preferences there are multiple dropdowns for different parts of the dashboard, giving the user power to customize the dashboard as per their need by enabling or disabling certain graphs and changing the refresh rate of the graphs.
In the preferences tab, there is a drop-down by the name of “dashboard”, which gives 2 options for selecting “graphs” and “display”. A similar layout will be followed for the “system statistics” dashboard.
pgadmin-hackers by date: