Optimizing PostgreSQL queries: questions and answers
During our webinar on PostgreSQL query optimization, we found many of your questions interesting and helpful to the public, if properly answered. Get more useful links and working expert advice from Peter Petrov, our Database Engineer.
Q1:
Is there any Prometheus exporter, do you know any native options to monitor PostgreSQL with Prometheus?
A1:
You can use Postgres Exporter to collect various metrics from PostgreSQL and send them to Prometheus.
For more information, please, use the following links:
https://github.com/prometheus-community/postgres_exporter
Q2:
Can we monitor all queries from a certain IP within the pre-defined date range? I'd like to find out which query is loading the server...
A2:
You can use the pg_stat_activity view to monitor queries from a specific IP-address, something like that:
SELECT query_start
, now() AS CURRENT_TIME
, query
FROM pg_stat_activity
WHERE client_addr = 'your_ip_addr'
ORDER BY now() - query_start DESC;
Listing 1. Searching queries from the specified IP-address.
The query above allows us to find out the longest queries coming from the specific IP address. However, its text may not be complete. It’s highly recommended to use pg_stat_statements, pg_stat_kcache, and pg_profile to get the entire picture. These extensions and tools enable us to see the texts for all queries. You will be able to find out the specific part in your business application that is sending the heaviest statements.
Q3:
Which parameter do you recommend showing on the Grafana dashboard? Do you provide one?
A3:
There are many interesting metrics from the postgres_exporter such as:
- Connections statistics.
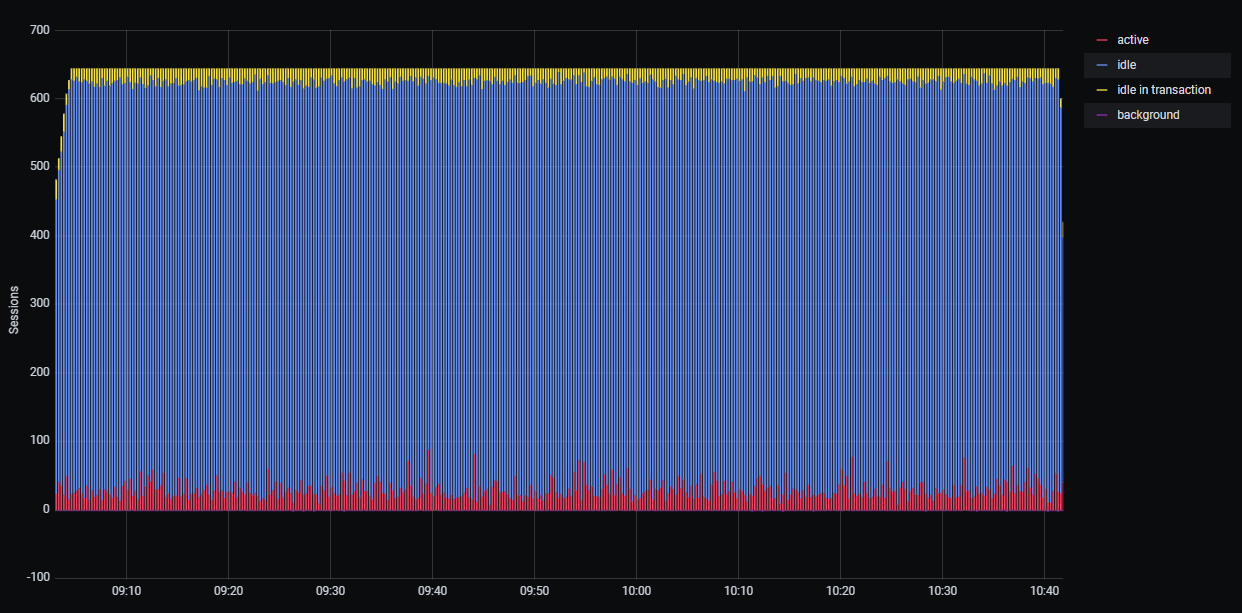
Picture 1. Connection statistics.
- Transactions and Queries per second.
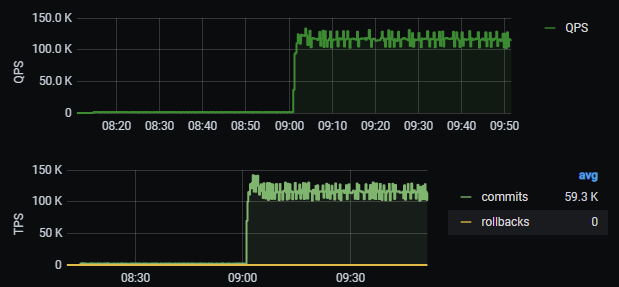
Picture 2. TPS and QPS.
- WAL size per transaction.
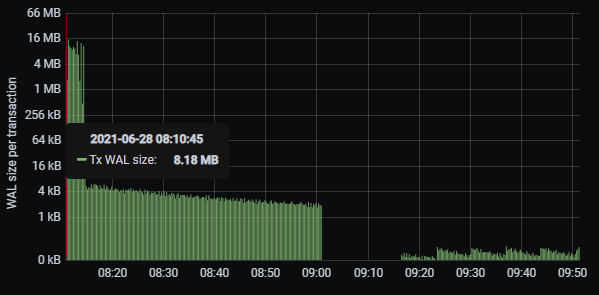
Picture 3. WAL generation statistics.
- Background workers such as autovacuum workers.
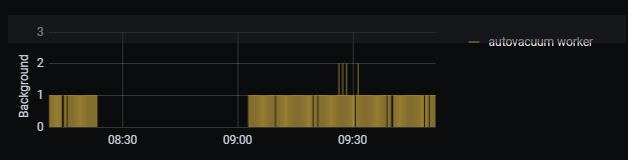
Picture 4. Background workers statistics.
- Lock statistics.
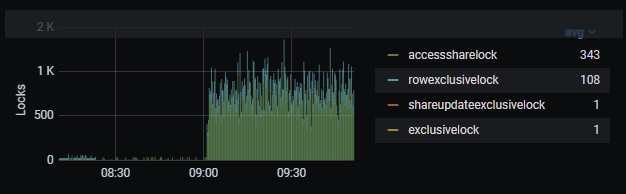
Picture 5. Locks statistics.
- shared_buffers usage statistics.
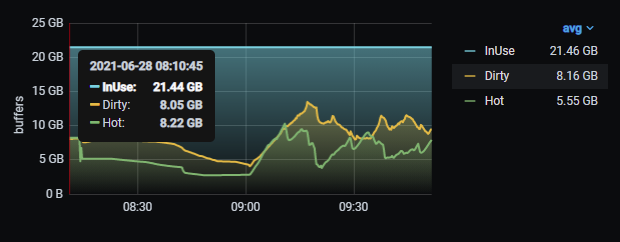
Picture 6. shared_buffers usage.
- Checkpoints statistics.
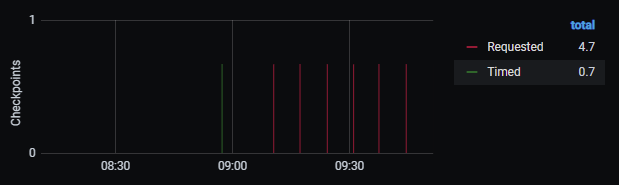
Picture 7. Checkpoints statistics
- Statistics on query execution.
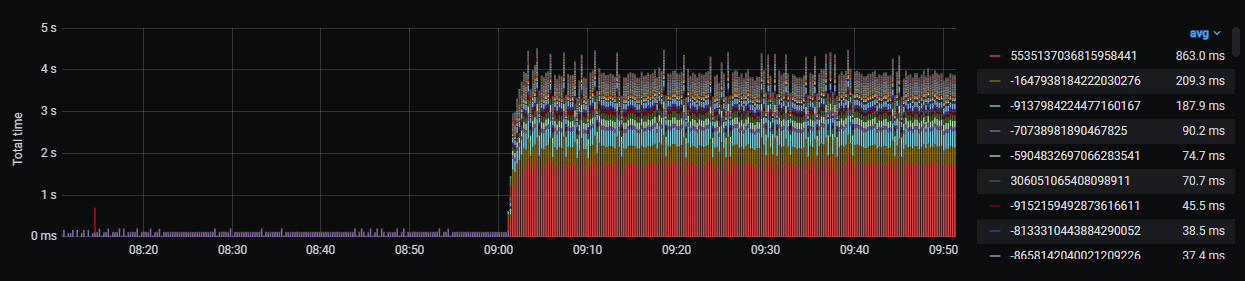
Picture 8. Statistics on query execution.
- Vacuum and bloat panel and many other metrics.
Q4:
Are you able to recommend some open-source and paid tools that show execution plans?
A4:
You can use the following open-source modules:
- auto_explain for writing the longest query plans to log file.
- pg_store_plans for collecting execution plans and parameters.
- https://explain.depesz.com/ for visualizing execution plans and discovering queries hotspots.
Our customers can also use the pgpro_stats module for collecting query plans. However, there are no parameter values inside the plan.
Q5:
Do you have some hands-on playground for doing exercise myself on my own database?
A5:
You can use our demo database which can be downloaded from our website:
https://edu.postgrespro.com/demo-big-en.zip
Another good source is the book “Postgres. The first experience”. It’s free and available on our website, just download it:
https://edu.postgrespro.ru/introbook_v6_en.pdf
Q6:
Can you provide or share any links to TPC tests?
A6:
Alas, all TPC tests were made during various customers audits, there is no way to publish them. However, you can build your own tests by using the JMeter tool. After its completion you’ll have something like that:
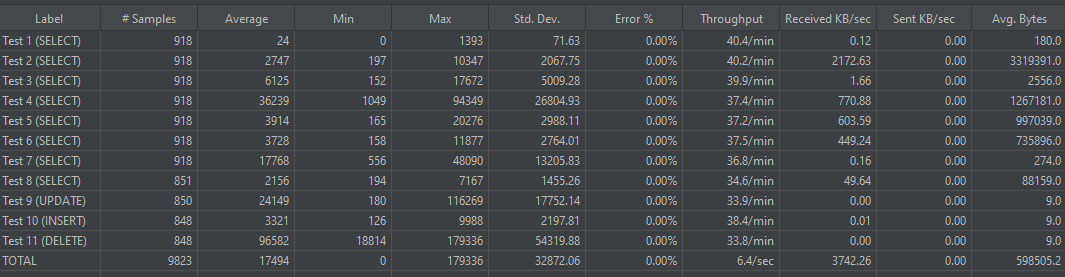
Picture 9. General statistics about stress-loading queries.
In the Average column, you will see queries that require optimization.
Q7:
Which metrics could tell me that the server is misconfigured?
A7:
You can use the “Checkpoint statistics” graph from Picture 7 to detect multiple requested checkpoints. If it is the case, you should adjust the max_wal_size and min_wal_size parameters in postgresql.conf file.
The “Background worker statistics” graph from Picture 4 can show us how many autovacuum workers are used for the database maintenance operations. In many cases, the parameter autovacuum_max_workers should be increased, the general formula is as follows:
autovacuum_max_workers = NCores/4..2 where NCores is the total number of CPU cores.
Also, make sure that autovacuum_vacuum_cost_limit is adjusted as well, the general formula is as follows:
autovacuum_vacuum_cost_limit = 200 * (autovacuum_max_workers / 3)
The graph “shared_buffers usage” from Picture 6 allows us to find out if there is enough memory to store the data inside the database cache. As a result, you may consider increasing the RAM and the shared_buffers setting as well.
There are also many metrics provided by the mamonsu agent. For more information on it, please, use the link below:
https://github.com/postgrespro/mamonsu
Q8:
During the query execution in PostgreSQL 11 it was found that its planning time takes 90%, however, the execution time takes only 10%. This query used partitioned tables. Is there any alternative for this issue or migration to the major version is required?
A8:
In PostgreSQL 12 and higher, there are many improvements of the partition_pruning mechanism which simplifies the query planning process, as well as the ability to check only a few partitions during the query’s execution time. So, we recommend you upgrade to the current major version of PostgreSQL.
Q9:
What is the difference between the EXISTS predicate and the IN operator in terms of performance?
A9:
While writing a query, you can suppose that EXISTS will provide better results since it can use all the logic and optimization for joining two tables whereas IN operator will result in using SubPlans. It’s quite interesting that starting from PostgreSQL 10 the planner may produce the same result for both options.
However, while considering NOT EXISTS and NOT IN scenarios it turns out that NOT IN leads to SubPlans that will create a bottleneck when dealing with large datasets. The NOT EXISTS clause, in its turn, will lead to anti joins without any SubPlans.
The EXISTS clause requires the planner to assess the unique row counts before the main join. If the dataset comes from the materialized CTE, then no statistics can be used for the assessment, therefore, it may lead to an incorrect plan. So, caution is advised in this case.
The IN operator can also be used while comparing a table column with the list of constants. Before PostgreSQL 14 there was a linear search that could lead to poor performance if dealing with many constants. Starting from PostgreSQL 14, a hash lookup will become available.
Q10:
How to monitor the vacuum process? Can I tune it somehow? What do you recommend?
A10:
The main thing here is that without the autovacuum the database tables are filled with old versions of rows and, as a result, they bloat. For example, pg_profile provides the sections allowing you to monitor the vacuum process for a certain period:
- Top DML tables.
- Top tables by updated/deleted tuples.
- Top growing tables.
- Top growing indexes.
- Top tables by vacuum operations.
- Top tables by analyze operations.
- Top tables by dead tuples ratio.
- Top tables by modified tuples ratio.
- Top indexes by estimated vacuum I/O load.
First, autovacuum_naptime should be decreased to 20 sec., since 1min might be too much.
The general formula for the autovacuum_max_workers is:
autovacuum_max_workers = NCores/4..2, where NCores is the total number of CPU cores.
Make sure that autovacuum_vacuum_cost_limit has been adjusted as well, the general formula for it is as follows:
autovacuum_vacuum_cost_limit = 200 * (autovacuum_max_workers / 3)
We recommend adjusting autovacuum_vacuum_scale_factor to 0.02. If the dead tuples ratio in a table is greater than 2%, then an autovacuum worker will process it.
It is also recommended to adjust autovacuum_analyze_scale_factor to 0.05. If the modified tuples ratio in a table is greater than 5%, an autovacuum worker will gather the statistics for the planner.
For PostgreSQL 13, you can adjust autovacuum_vacuum_insert_scale_factor to processes append-only tables to prevent the wraparound problem.
If the autovacuum_work_mem value equals -1, the maintenance_work_mem value will be used. As a start value, consider increasing it to 1GB.
The pg_stat_progress_vacuum view can show the vacuum’s work in real-time.
autovacuum_vacuum_scale_factor, autovacuum_analyze_scale_factor can be adjusted for the specific table by using ALTER TABLE tbl_name SET (param_name=param_value).
Avoid long queries and transactions (including idle transactions) as they prevent autovacuum from removing old rows. As a result, there will be many bloated tables with a heavy I/O workload.
Autovacuum works to clear dead rows from indexes and corresponding tables. The section named “Top indexes by estimated vacuum I/O load” from the pg_profile report can show how indexes influence the autovacuum process. There may be cases when it runs very long since there are many huge indexes that need to be cleaned. If it is the case, consider dividing tables into smaller partitions.
Perhaps, you will also find the following article helpful:
Q11:
Do you have a document on how to use pg_stat_kcache?
A11:
The links below contain the documentation you need:
https://powa.readthedocs.io/en/latest/components/stats_extensions/pg_stat_kcache.html
https://github.com/powa-team/pg_stat_kcache
Q12:
After creating an index on column/columns still, it's going through the sequential scan. How can it be bypassed?
A12:
It heavily depends on the query. Perhaps, it’s gathering 75% rows, therefore, there is no point in Index Scan usage due to a heavy random-access overhead. If the query needs a few columns, consider creating an INCLUDE index for the Index-Only Scan usage.
The core reason may be related to the fact that the index doesn’t include the filtering fields. Even if it does, perhaps, these fields are not in leading positions, therefore, such an index scan will be inefficient.
If the query uses a LIKE operator, make sure that you use the suitable operator class such as text_pattern_ops, varchar_pattern_ops, etc.
Q13:
During reading performance tests some writes in the database have been detected. What could be the reason for that and how could it be prevented?
A13:
Perhaps, the generation of the temporary files is involved here. When there is not enough internal backend memory for sorting a large dataset or keeping query results in CTE, PostgreSQL begins to load the data in the temporary files on the disk. Moreover, you can even face an infinite recursive query due to an incorrect termination clause. You can monitor such queries by using the pg_profile section “Top SQL by temp usage” and tune them.
Q14:
How does skip scan work in PostgreSQL? Does it match skip scan in Oracle?
A14:
PostgreSQL doesn’t support index skip scan natively, however, there is work in progress which you can see on the commitfest:
https://commitfest.postgresql.org/19/1741/
Index skip scan can be emulated using a recursive CTE. For more information, please, refer to the Postgres wiki:
https://wiki.postgresql.org/wiki/Loose_indexscan
Q15:
Do you have any documentation on how to enable the mentioned extensions?
A15:
The pg_stat_statements and auto_explain modules are included in the standard PostgreSQL distribution; therefore, their installation and configuration can be found in the official Postgres documentation:
https://www.postgresql.org/docs/13/pgstatstatements.html
https://www.postgresql.org/docs/13/auto-explain.html
The packages for the pg_stat_kcache module are provided in the PostgreSQL repositories.
The link for the RHEL 8.4 and PostgreSQL 13 is presented below:
For Debian packages, click the link below:
http://apt.postgresql.org/pub/repos/apt/pool/main/p/pg-stat-kcache/
The packages for the pg_wait_sampling module are also provided in the PostgreSQL repositories.
The link for the RHEL 8.4 and PostgreSQL 13 is presented below:
For Debian packages, click the link below:
http://apt.postgresql.org/pub/repos/apt/pool/main/p/pg-wait-sampling/
The installation process of the pg_profile module is covered in its detailed documentation that can be found on GitHub:
https://github.com/zubkov-andrei/pg_profile
Postgres Professional also strongly recommends the Oracle-to-Postgres Migrations webinar, which you can attend virtually and get more insights for hybrid Oracle and PostgreSQL installations.