[PATCH] Reduce EXPLAIN ANALYZE overhead for row counting - Mailing list pgsql-hackers
| From | Hironobu SUZUKI |
|---|---|
| Subject | [PATCH] Reduce EXPLAIN ANALYZE overhead for row counting |
| Date | |
| Msg-id | 64996009-156f-414c-84f2-bea2da55e29f@interdb.jp Whole thread Raw |
| Responses |
Re: [PATCH] Reduce EXPLAIN ANALYZE overhead for row counting
|
| List | pgsql-hackers |
Hi hackers,
I would like to propose an approach to reduce EXPLAIN ANALYZE overhead
for row counting.
# Introduction
A critical issue with EXPLAIN ANALYZE is its significant performance
overhead. Therefore, I focused solely on counting actual rows—i.e.,
where TIMING, BUFFERUSAGE, and WALUSAGE are all FALSE. Through several
iterations of optimization attempts, I managed to reduce this overhead
from 26.60% down to 1.64%. (Please see Appendix A for benchmarks.)
The optimization consists of three phases:
+ Phase 1
- Action / Approach: Simplification of ExecProcNodeInstr() and
InstrStopNode().
- Resulting Overhead: 8.13%
- Status: Ready for immediate review.
+ Phase 2
- Action / Approach: Direct instrumentation inside the ExecXXX()
family (e.g., ExecSeqScan, ExecIndexScan).
- Resulting Overhead: 3.95%
- Issue: Current implementation causes a 0.47% performance
degradation for normal SELECT queries.
- Status: Proof-of-Concept (PoC)
+ Phase 3
- Action / Approach: Memory optimization incl. PlanState changes and
bit-packing.
- Resulting Overhead: 1.64%
- Issue: Inherits the performance degradation issue found in Phase 2.
- Status: Proof-of-Concept (PoC). JIT unsupported.
If implemented, this feature offers substantial benefits:
+ Enhanced Monitoring: Enables frequent use of tools like auto_explain
to better identify performance issues.
+ Optimizer Improvement: Allows external extensions like Adaptive
Query Optimization (AQO) by PostgresPro to perform frequent,
low-impact training, leading to more accurate optimizers and
stimulating research.
+ Query Progress Observation: Makes it feasible to observe query
progress directly by snapshotting the executing plan and its actual
row counts.
## Immediate Focus: Phase 1 Readiness
The initial step, Phase 1, is a non-intrusive, production-ready
solution that delivers substantial performance gains -- reducing the
original overhead from 26.60% to 8.13% (over 69% reduction). Its
isolation and minimal code changes make it the most actionable
component for immediate adoption into the main branch.
# Detailed Design Specification
Profiler results indicate that InstrStartNode(), InstrStopNode(), and
ExecProcNodeInstr() are the primary sources of overhead (see Appendix
B).
My approach systematically eliminates these sources while utilizing
the existing Instrumentation Framework. (A major architectural
overhaul is outside the scope of this proposal.)
Note that preliminary results indicate that inlining these key
functions reduces overhead by several percentage points in non-target
cases (e.g., when BUFFERUSAGE or WALUSAGE are TRUE). Therefore, all
subsequent phases assume inlining is applied.
## Phase 1
### Approach: Simplifying ExecProcNodeInstr()
When ANALYZE is TRUE but other metrics are FALSE, we can skip
InstrStartNode() and reduce InstrStopNode() to just two operations:
incrementing tuplecount and setting running=true.
I introduced ExecProcNodeInstrRowCount() to execute only these minimal
statements:
```
static TupleTableSlot *
ExecProcNodeInstrRowCount(PlanState *node)
{
TupleTableSlot *result;
/* Skip calling InstrStartNode() */
result = node->ExecProcNodeReal(node);
/* Perform the essential steps from InstrStopNode() */
if (!TupIsNull(result))
node->instrument->tuplecount += 1.0;
node->instrument->running = true; /* Always true */
return result;
}
```
ExecProcNodeFirst() is extended to switch between ExecProcNodeInstr
and ExecProcNodeInstrRowCount based on the requested metrics.
(While this proposal focuses solely on counting actual rows,
optimization of other metrics can be achieved without conflicts by
employing conditional branching within ExecProcNodeFirst().)
### Results:
Overhead reduced to 8.13%. Crucially, this introduces no performance
degradation for normal (non-instrumented) execution.
## Phase 2
Phase 2 is a Proof-of-Concept (PoC) model.
### Approach: Direct Instrumentation in ExecXXX Functions
Phase 2 removes the wrapper function overhead by modifying every
ExecXXX function (e.g., ExecSeqScan, ExecIndexScan) to call a new,
inlined helper, ExecNodeRowcountEnd(), at the final step.
ExecSeqScan() Example:
```
// BEFORE
static TupleTableSlot *
ExecSeqScan(PlanState *pstate)
{
SeqScanState *node = castNode(SeqScanState, pstate);
return ExecScanExtended(&node->ss,
(ExecScanAccessMtd) SeqNext,
(ExecScanRecheckMtd) SeqRecheck,
NULL,
NULL,
NULL);
}
// AFTER
static TupleTableSlot *
ExecSeqScan(PlanState *pstate)
{
TupleTableSlot *result;
SeqScanState *node = castNode(SeqScanState, pstate);
result = ExecScanExtended(&node->ss,
(ExecScanAccessMtd) SeqNext,
(ExecScanRecheckMtd) SeqRecheck,
NULL,
NULL,
NULL);
return ExecNodeRowcountEnd(pstate, result);
}
```
ExecNodeRowcountEnd() Definition:
```
static pg_attribute_always_inline TupleTableSlot *
ExecNodeRowcountEnd(PlanState *node, TupleTableSlot *result)
{
Instrumentation *const instr = node->instrument;
if (!instr)
return result;
if (!instr->fast_path_instr)
return result;
/* count the returned tuples */
if (!TupIsNull(result))
instr->tuplecount += 1.0;
instr->running = true; /* Always true */
return result;
}
```
I added a boolean flag, fast_path_instr, to the Instrumentation
struct. This is set to TRUE only when counting actual rows is the sole
active metric.
```
typedef struct Instrumentation
{
/* true if we can bypass InstrStartNode and InstrStopNode */
bool fast_path_instr;
/* Parameters set at node creation: */
...
} Instrumentation;
```
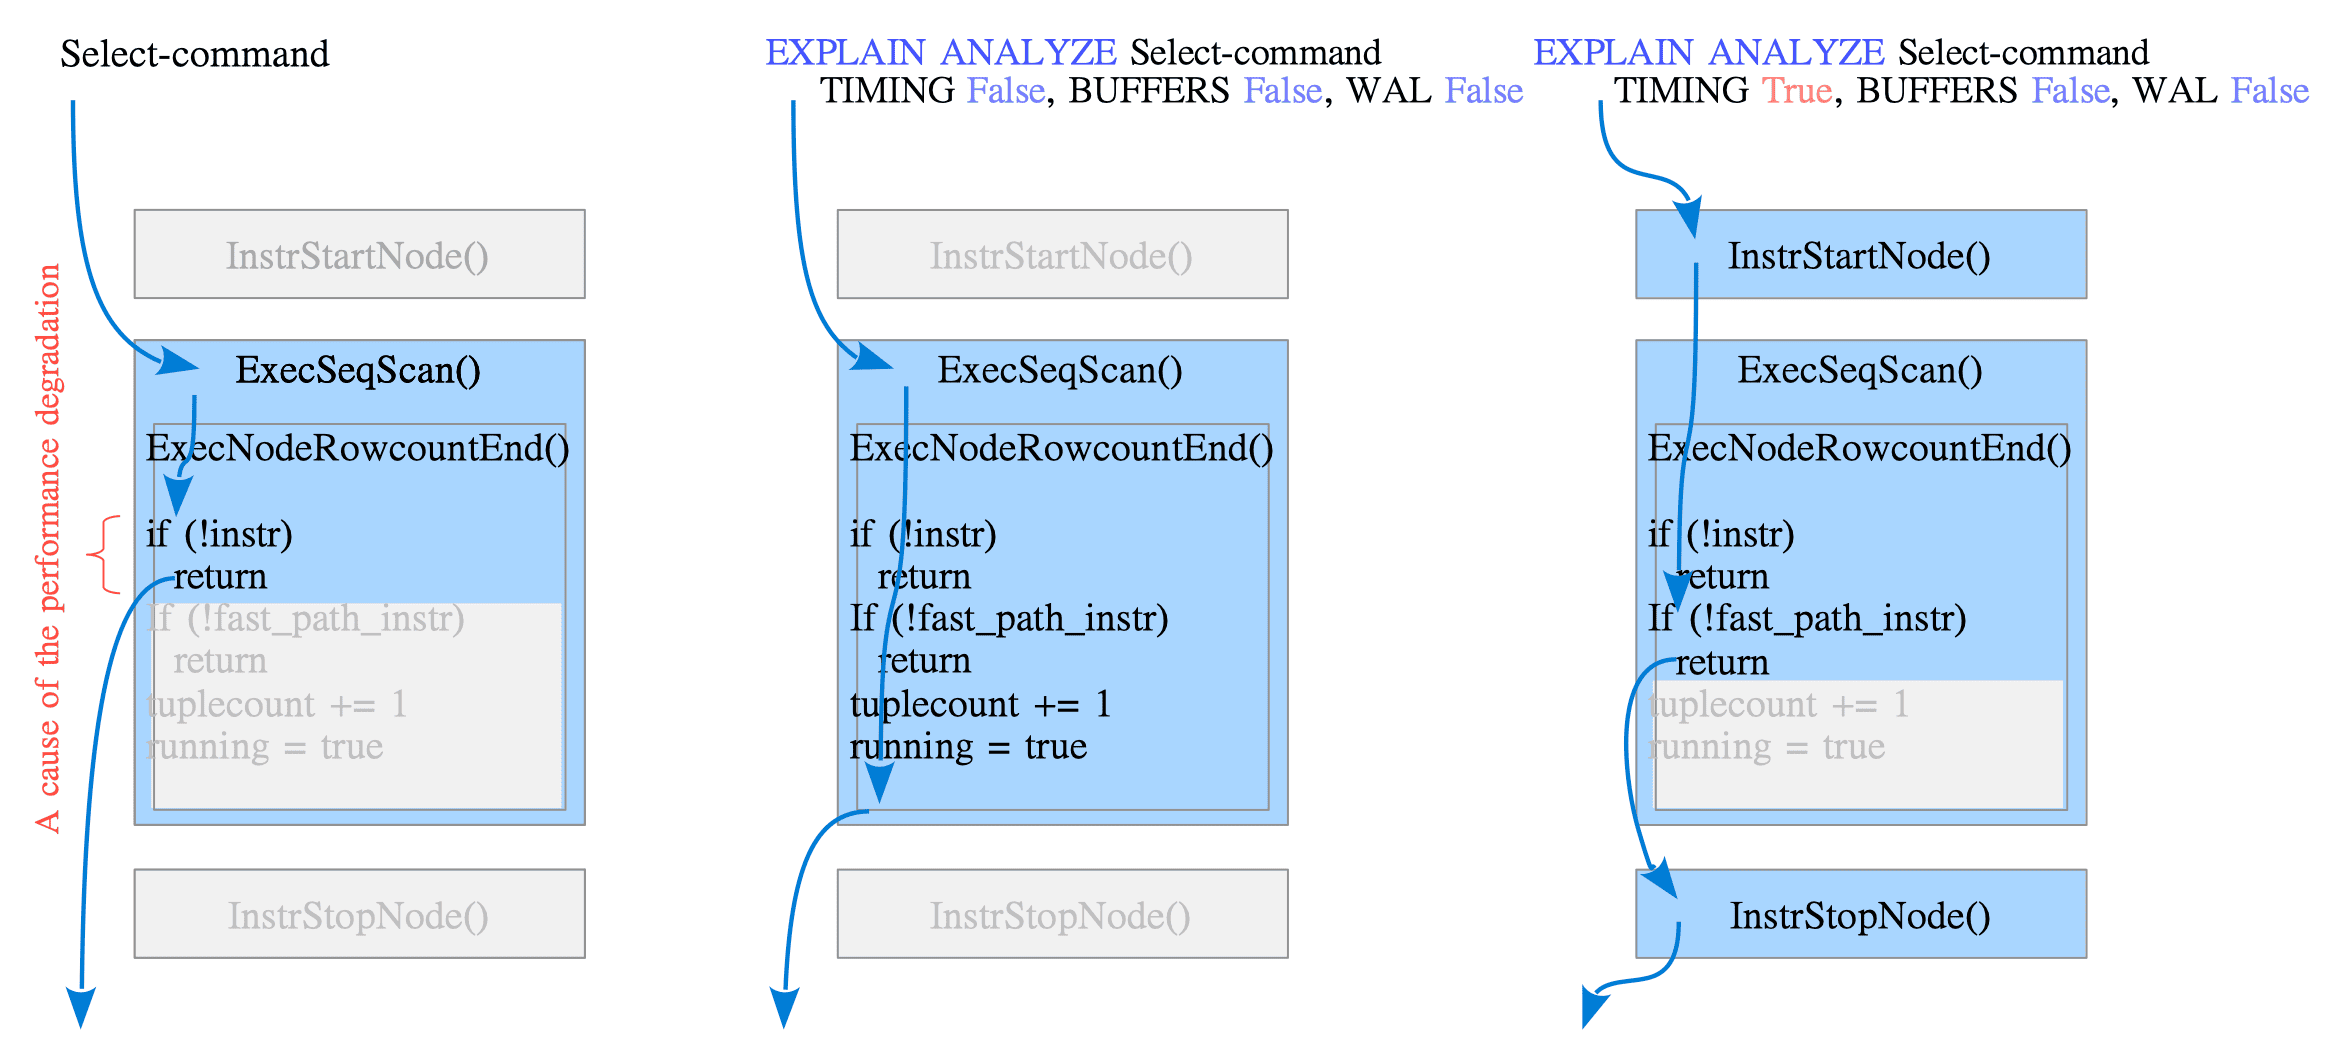
#### Execution Paths:
1. Standard SELECT: ExecNodeRowcountEnd is called but returns
immediately (if (!instr)).
+ Issue: The function call and check cause a performance degradation.
2. EXPLAIN ANALYZE (Fast Path): fast_path_instr is TRUE. Executes
minimal logic.
3. EXPLAIN ANALYZE (Full): Normal path. InstrStartNode runs,
ExecNodeRowcountEnd returns early (fast_path_instr is FALSE), then
InstrStopNode runs.
(See the attached figure: fast_path_instr.png)
### Results and Degradation Analysis:
Overhead reduced to 3.95%.
However, the non-instrumented baseline (Query-1) suffered a 0.47%
slowdown (approx. 0.57s increase) due to the unconditional call to
ExecNodeRowcountEnd. While code duplication (e.g., ExecSeqScan vs
ExecSeqScanWithInstr) could solve this, it is unmaintainable. I am
seeking a cleaner solution.
## Phase 3
Phase 3 is also a Proof-of-Concept (PoC) and Feasibility Study. It is
currently ad-hoc and does not support JIT.
The performance degradation observed here stems from the same reasons
as in Phase 2 (unconditional checks in the hot path).
### Approach: Reducing Register Loads
To further minimize overhead, I focused on memory and register
efficiency:
1. Consolidating Variables: tuplecount (bits 0-61), running (bit 62),
and fast_path_instr (bit 63) are packed into a single uint64 hot_instr.
2. Relocating the Variable: hot_instr is moved from Instrumentation to
PlanState.
Note: A 62-bit integer is sufficient for tuplecount as the double
mantissa limit is 53 bits.
PlanState Structure Modification:
```
typedef struct PlanState
{
...
/* bit 63: fast_path_instr, bit 62: running, bit 0-61: tuplecount */
uint64_t hot_instr;
Instrumentation *instrument; /* Optional runtime stats for this node */
WorkerInstrumentation *worker_instrument; /* per-worker instrumentation */
...
}
```
ExecNodeRowcountEnd() Implementation:
```
static pg_attribute_always_inline TupleTableSlot *
ExecNodeRowcountEnd(PlanState *node, TupleTableSlot *result)
{
uint64_t current = node->hot_instr;
if ((current & FAST_PATH_INSTR_MASK) == 0)
return result;
if (!TupIsNull(result))
/* Prevent overflow */
if ((current & TUPLECOUNT_MASK) != MAX_TUPLECOUNT)
current += 1; /* tuplecount++ */
current |= RUNNING_MASK; /* running = true */
/* store current */
node->hot_instr = current;
return result;
}
```
This reduces data loads from cache/memory to registers from five
(Phase 2) to two (Phase 3).
Specifically, we eliminated the need to load the address of the
Instrumentation struct. Additionally, by loading three pieces of data
simultaneously, we reduced the total number of load operations by
three.
### Results:
Overhead reduced to 1.64%.
As with Phase 2, a performance degradation in standard queries was
observed (1.11%). See Appendix A for a discussion on the variance of
these degradation metrics.
# Implementation Status
Independent patches corresponding to each phase are attached, along
with their current review status:
+ Phase 1 (Status: Ready for immediate review):
v1-0001-Introduce-ExecProcNodeInstrRowCount-for-reduced-A.patch
+ Phase 2 (Status: Proof-of-Concept (PoC)):
v1-0001-POC-for-direct-instrumentation-call-in-ExecXXX-no.patch
+ Phase 3 (Status: Proof-of-Concept (PoC)):
v1-0001-POC-for-bit-packing-instrumentation-into-PlanStat.patch
# Call for Feedback
Given that Phase 1 is non-intrusive and offers an immediate 69%
overhead reduction, I believe its stability makes this patch ready for
integration, and I primarily seek review for it in this thread.
I also welcome feedback on the following specific challenges:
+ General Idea: Thoughts on optimizing actual rows counting.
+ Phase 2 Implementation: Ideas to avoid the 0.47% performance
degradation in standard queries without code duplication.
+ Phase 3 Strategy: Comments on the hot_instr bit-packing approach and
PlanState modification.
Best regards,
Hironobu Suzuki
# Appendix
## A: Benchmark
To reproduce these results:
```
$ git clone https://github.com/s-hironobu/fast_explain_analyze.git
$ cd fast_explain_analyze
$ bash ./bench.sh setup
$ bash ./bench.sh benchmark
```
### A.1: Environment
|Component|Version|Note|
|-|:-|:-|
|CPU | M1 Max|ARM architecture|
|OS | macOS 15.5||
|Compiler |Apple clang version 17.0.0 | Target: arm64-apple-darwin24.5.0|
|PostgreSQL | 19dev | config options: --without-icu CFLAGS="-O3 -g"|
|postgresql.conf|Default settings, except: shared_buffers = 512MB,
max_parallel_workers_per_gather = 0, max_parallel_workers = 0| Disable
parallel queries.|
Note: Although the benchmark disables parallel queries, all patches
support them.
### A.2: Dataset
```
CREATE TABLE test1 (id int, data int);
CREATE INDEX test1_id_idx ON test1 (id);
CREATE TABLE test2 (id int PRIMARY KEY, data int);
CREATE TABLE test3 (id int PRIMARY KEY, data int);
INSERT INTO test1 (id, data) SELECT i, i % 51 FROM generate_series(1,
150000) AS i;
INSERT INTO test1 (id, data) SELECT i, i % 51 FROM generate_series(1,
5000) AS i;
INSERT INTO test2 (id, data) SELECT i, floor(random() * 50 + 1)::int
FROM generate_series(1, 50000) AS i;
INSERT INTO test3 (id, data) SELECT i, i FROM generate_series(1, 100000)
AS i;
ANALYZE;
```
### A.3: Queries
+ Query-1: Standard SELECT
+ Query-2: EXPLAIN ANALYZE with TIMING,BUFFERS,WAL=FALSE
```
-- Query-1
SELECT count(*) FROM test1 AS a, test2 AS b, test3 AS c WHERE a.id = c.id;
-- Query-2
EXPLAIN (ANALYZE TRUE, TIMING FALSE, BUFFERS FALSE) SELECT count(*) FROM
test1 AS a, test2 AS b, test3 AS c WHERE a.id = c.id;
```
### A.4: Results (Test3 size: 100,000 rows)
Query-1 and Query-2 were each executed 10 times. The results show the
average execution time (and variance) and the derived overheads.
+ Overhead Definition:
Overhead = 100 * (ExecutionTime(Query-2) - ExecutionTime(Query-1))/
ExecutionTime(Query-1)
Overhead based on Original = 100 * (ExecutionTime(Query-2) -
ExecutionTime(Original Query-1)) / ExecutionTime(Original Query-1)
| |Query-1 [sec] (Var.[$\text{sec}^{2}$])|Query-1 Degradation
[%]|Query-2 [sec] (Var. [$\text{sec}^{2}$])|Overhead [%]| Overhead based
on Original [%] |
|-|-:|-:|-:|-:|-:|
|Original |120.7846 (0.1260)|N/A |152.9188 (0.3539)|26.60|26.60|
|Phase 1 |120.7209 (0.0822)|N/A |130.6013 (0.0257)| 8.18| 8.13|
|Phase 2 |121.3559 (0.0007)|0.47|125.5515 (0.0039)| 3.46| 3.95|
|Phase 3 |122.1207 (0.1115)|1.11|122.7696 (0.1403)| 0.53| 1.64|
### A.5: Sensitivity Analysis
#### Test3 size: 35,000 rows
| |Query-1 [sec] (Var.[$\text{sec}^{2}$])|Query-1 Degradation
[%]|Query-2 [sec] (Var. [$\text{sec}^{2}$])|Overhead [%]| Overhead based
on Original [%] |
|-|-:|-:|-:|-:|-:|
|Original |45.3314 (0.0090)|N/A |58.4396 (0.0721)|28.92|28.92|
|Phase 1 |45.3670 (0.0115)|N/A |50.5628 (0.0133)|11.45|11.54|
|Phase 2 |45.8230 (0.0196)|1.08|48.4476 (0.0159)| 5.73| 6.87|
|Phase 3 |45.3970 (0.2161)|0.15|46.2231 (0.1641)| 1.82| 1.96|
#### Test3 size: 200,000 rows
| |Query-1 [sec] (Var.[$\text{sec}^{2}$])|Query-1 Degradation
[%]|Query-2 [sec] (Var. [$\text{sec}^{2}$])|Overhead [%]| Overhead based
on Original [%] |
|-|-:|-:|-:|-:|-:|
|Original |177.4159 (0.2237)|N/A |226.9384 (0.6501)|27.91|27.91|
|Phase 1 |176.2791 (0.1037)|N/A |192.8065 (0.3016)| 9.38| 8.67|
|Phase 2 |177.9841 (0.2546)|0.32|185.5116 (0.3097)| 4.23| 4.56|
|Phase 3 |178.8132 (0.2190)|0.78|181.2868 (0.4573)| 1.38| 2.18|
#### Discussion on Results
The measured results contain statistical variance due to environmental
factors. For example, the execution time for the original Query-1 is
slightly higher than that of Phase 1, which suggests measurement
noise.
Furthermore, the benchmark results are highly sensitive to the dataset
size and environmental factors. As demonstrated by reducing the size
of the test3 table from 100,000 rows to 35,000 rows, the Query-1
performance degradation in Phase 3 is sharply reduced from 1.11% to
0.15%.
Therefore, these benchmark figures should be interpreted not as
absolute performance metrics, but primarily as an indication of the
significant trend of overhead reduction achieved through the proposed
phases.
## B: Profiler Results
+ Measured on Ubuntu 24.04.
+ Test3 size: 35,000 rows
**Query-1:** SELECT
```
Each sample counts as 0.01 seconds.
% cumulative self self total
time seconds seconds calls s/call s/call name
27.38 34.05 34.05 4000040003 0.00 0.00 ExecInterpExpr
15.68 53.55 19.50 2000000001 0.00 0.00 ExecNestLoop
11.44 67.77 14.22 _init
7.95 77.66 9.89 2000010000 0.00 0.00
tuplestore_gettupleslot
7.02 86.39 8.73 2 4.37 54.90 ExecAgg
6.68 94.70 8.31 2000010000 0.00 0.00 tuplestore_gettuple
6.48 102.76 8.06 1999960000 0.00 0.00
ExecStoreMinimalTuple
5.13 109.14 6.38 2000050000 0.00 0.00 ExecMaterial
4.18 114.34 5.20 2000000001 0.00 0.00 fetch_input_tuple
...
```
**Query-2:** EXPLAIN ANALYZE (TIMING FALSE)
```
Each sample counts as 0.01 seconds.
% cumulative self self total
time seconds seconds calls s/call s/call name
21.24 36.39 36.39 4000040003 0.00 0.00 ExecInterpExpr
15.53 62.99 26.60 _init
12.08 83.69 20.70 2000000001 0.00 0.00 ExecNestLoop
8.44 98.15 14.46 2000010016 0.00 0.00
tuplestore_gettupleslot
6.01 108.44 10.29 4000215014 0.00 0.00 InstrStartNode
5.43 117.74 9.30 2000050000 0.00 0.00 ExecMaterial
5.32 126.86 9.12 4000215014 0.00 0.00 InstrStopNode
5.26 135.87 9.01 2000050000 0.00 0.00 tuplestore_ateof
4.13 142.94 7.07 4000215015 0.00 0.00 ExecProcNodeInstr
...
```
Attachment
pgsql-hackers by date: