executing "show track_activity_query_size" give me "1KB" the default value.
I will try to increase this setting but it require db restart...
In PGAdmin 3 (on oldest PG v9.4), in tool server state, I was using for that purpose, the button that launch the query editor for the selected session and the entire SQL command was displayed.
Le lundi 16 décembre 2019 à 15:57:47 UTC+1, Aditya Toshniwal <aditya.toshniwal@enterprisedb.com> a écrit :
Hi,
On Mon, Dec 16, 2019 at 7:30 PM Alain Dupeyron <adupeyron@yahoo.fr> wrote:
Hi Aditya,
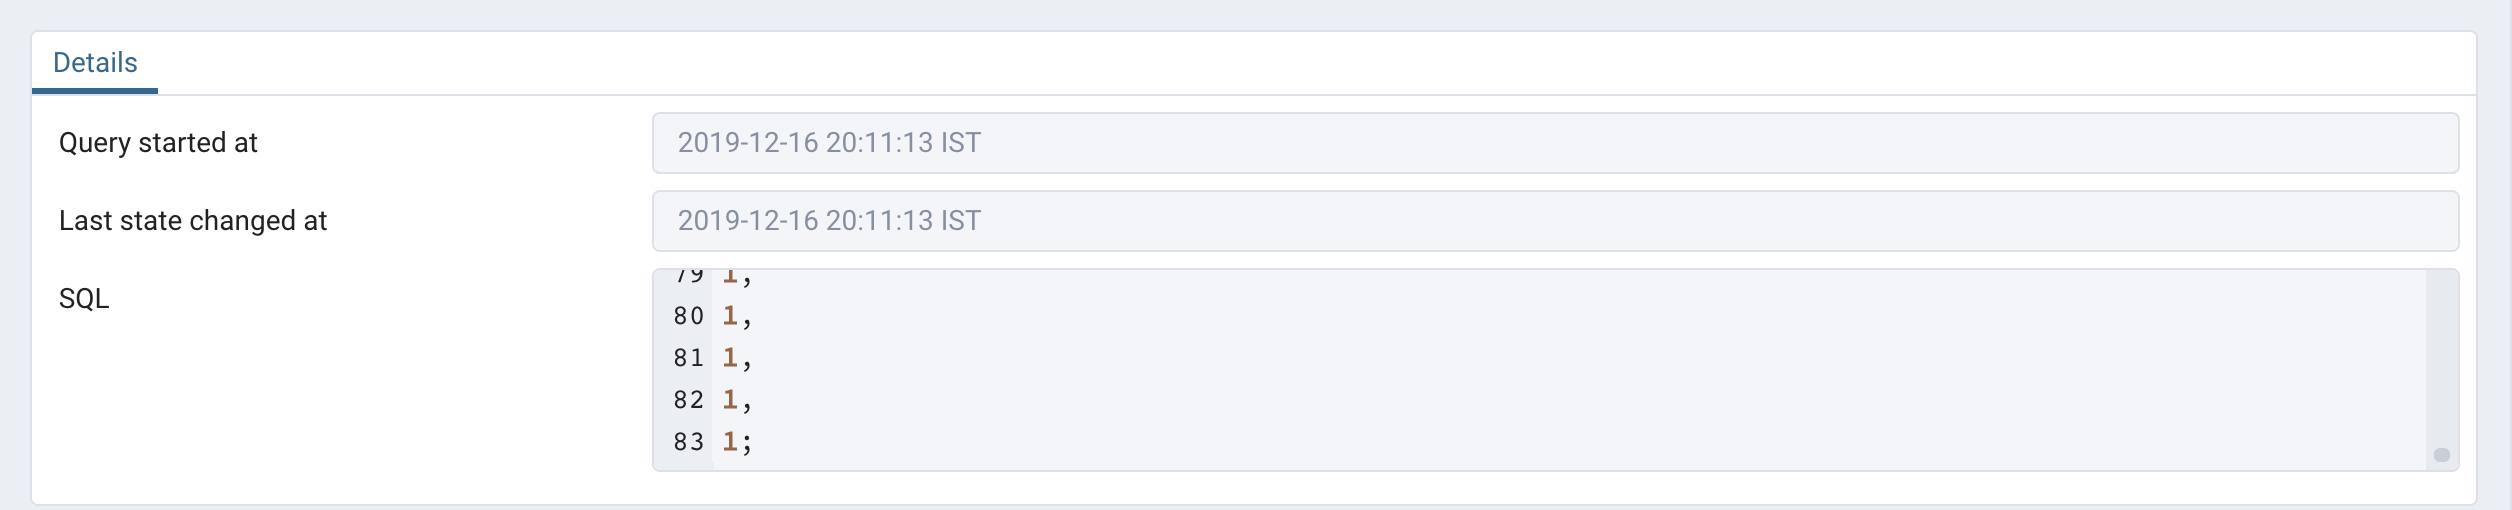
I have "very" long queries formatted on multilines. See screenshot below with 23 lines but SQL is truncated...
I have just updated to PGAdmin 4.16, SQL field seem to be longuer but still truncated in my case
OK. So I guess the param track_activity_query_size might be less for you DB. Refer - https://www.postgresql.org/docs/12/runtime-config-statistics.html pgAdmin uses pg_stat_activity to fetch the query. It depends on track_activity_query_size how much size of the query is tracked.
To check, execute show track_activity_query_size in query tool.
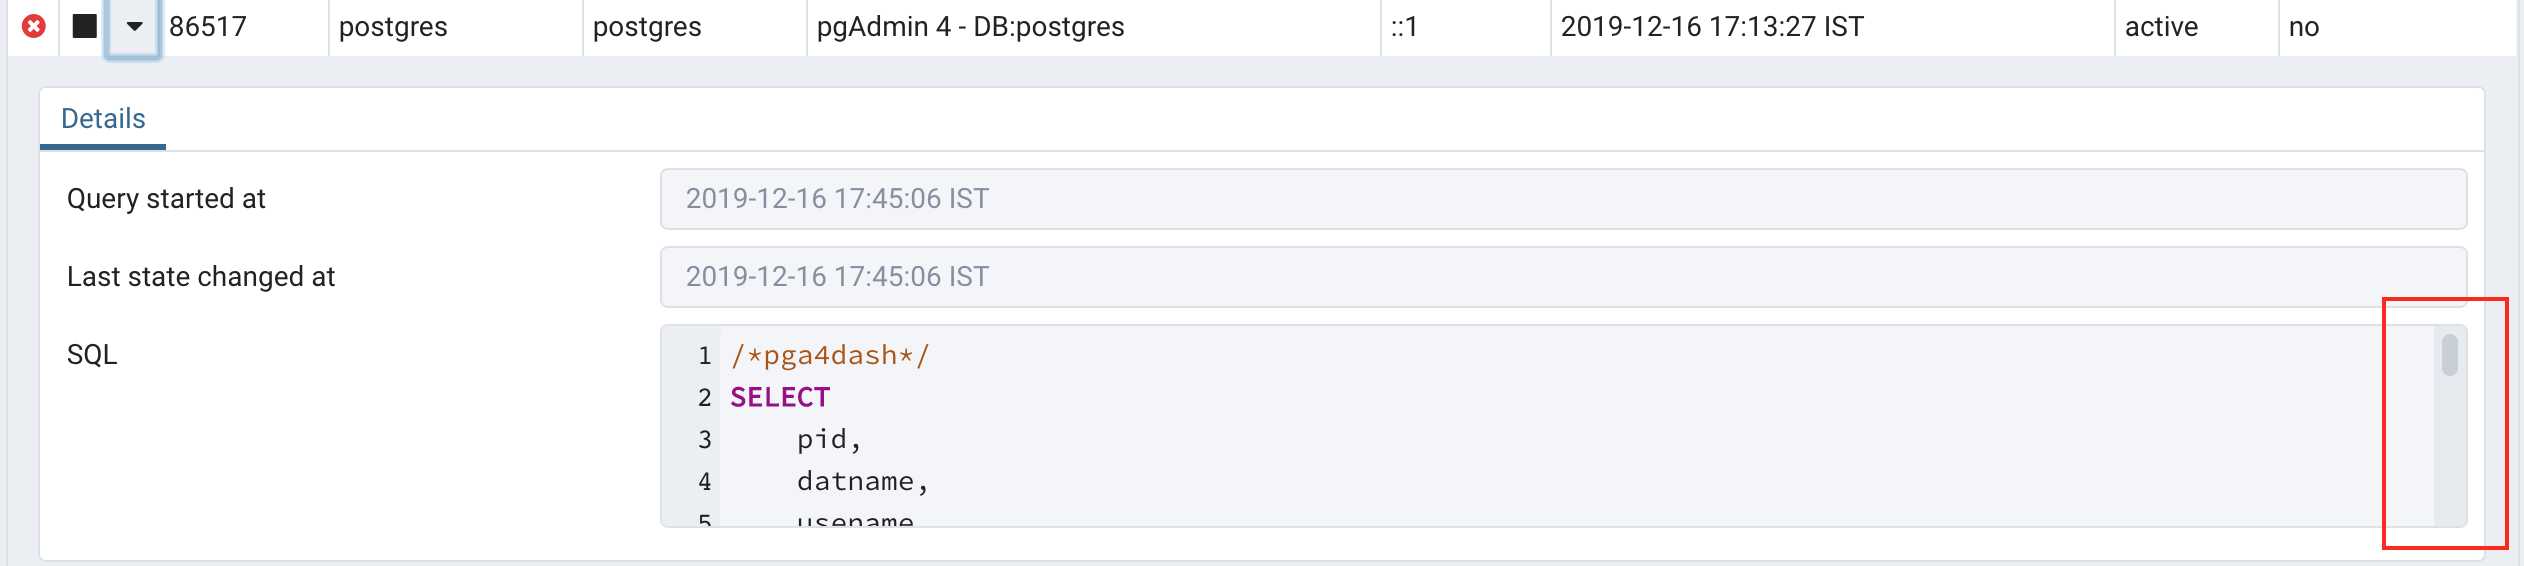
You can scroll it. Please check the screenshot below:
On Mon, Dec 16, 2019 at 3:32 PM Alain Dupeyron <adupeyron@yahoo.fr> wrote:
Hi,
In PG Admin 4, I use the dashboard, server activity to explore sessions on PG v12.1.
In the Details panel of the session, I can see the start of the SQL, but when it's a long text query on multiple lines, How can I access the entire SQL command ?
In PGAdmin 3 (on oldest PG v9.4), in tool server state, I was using for that purpose, the button that launch the query editor for the selected session with the entire SQL command.