Millions of Queries per Second: PostgreSQL and MySQL’s Peaceful Battle at Today’s Demanding Workloads

Anastasia Raspopina and Sveta Smirnova
January 6, 2017
This blog compares how PostgreSQL and MySQL handle millions of queries per second.

Anastasia: Can open source databases cope with millions of queries per second? Many open source advocates would answer “yes.” However, assertions aren’t enough for well-grounded proof. That’s why in this blog post, we share the benchmark testing results from Alexander Korotkov (CEO of Development, Postgres Professional) and Sveta Smirnova (Principal Technical Services Engineer, Percona). The comparative research of PostgreSQL 9.6 and MySQL 5.7 performance will be especially valuable for environments with multiple databases.
The idea behind this research is to provide an honest comparison for the two popular RDBMSs. Sveta and Aleksander wanted to test the most recent versions of both MySQL and PostgreSQL with the same tool, under the same challenging workloads and using the same configuration parameters (where possible). However, because both PostgreSQL and MySQL ecosystems evolved independently, with standard testing tools (pgbench and SysBench) used for each database, it wasn’t an easy journey.
The task fell to database experts with years of hands-on experience. Sveta has worked as Senior Principal Technical Support Engineer in the Bugs Verification Group of the MySQL Support Group at Oracle for more than eight years, and since 2015 has worked as a Principal Technical Services Engineer at Percona. Alexander Korotkov is a PostgreSQL major contributor, and the developer of a number PostgreSQL features – including the CREATE ACCESS METHOD command, generic WAL interface, lockfree Pin/UnpinBuffer, index-based search for regular expressions and much more. So we have a pretty decent cast for this particular play!
Sveta: Dimitri Kravtchuk regularly publishes detailed benchmarks for MySQL, so my main task wasn’t confirming that MySQL can do millions of queries per second. As our graphs will show, we’ve passed that mark already. As a Support Engineer, I often work with customers who have heterogeneous database environments in their shops, and want to know about the impact of migrating jobs from one database to another. So instead, I found the chance to work with the Postgres Professional company and identify both the strong and weak points of the two databases an excellent opportunity.
We wanted to test both databases on the same hardware, using the same tools and tests. We expected to test base functionality, and then work on more detailed comparisons. That way we could compare different real-world use case scenarios and popular options.
Spoiler: We are far from the final results. This is the start of a blog series.
OpenSource Databases on Big Machines, Series 1: “That Was Close…”
PostgreSQL Professional together with Freematiq provided two modern, powerful machines for tests.
Hardware configuration:
Processors: physical = 4, cores = 72, virtual = 144, hyperthreading = yes
Memory: 3.0T
Disk speed: about 3K IOPS
OS: CentOS 7.1.1503
File system: XFS
I also used a smaller Percona machine.
Hardware configuration:
Processors: physical = 2, cores = 12, virtual = 24, hyperthreading = yes
Memory: 251.9G
Disk speed: about 33K IOPS
OS: Ubuntu 14.04.5 LTS
File system: EXT4
Note that machines with smaller numbers of CPU cores and faster disks are more common for MySQL installations than machines with larger numbers of cores.
The first thing we needed to agree on is which tool to use. A fair comparison only makes sense if the workloads are as close as possible.
The standard PostgreSQL tool for performance tests is pgbench, while for MySQL it’s SysBench. SysBench supports multiple database drivers and scriptable tests in the Lua programming language, so we decided to use this tool for both databases.
The initial plan was to convert pgbench tests into SysBench Lua syntax, and then run standard tests on both databases. After initial results, we modified our tests to better examine specific MySQL and PostgreSQL features.
I converted pgbench tests into SysBench syntax, and put the tests into an open-database-bench GitHub repository.
And then we both faced difficulties.
As I wrote already, I also ran the tests on a Percona machine. For this converted test, the results were almost identical:
Percona machine:
OLTP test statistics:
       transactions:                        1000000 (28727.81 per sec.)
       read/write requests:                 5000000 (143639.05 per sec.)
       other operations:                    2000000 (57455.62 per sec.)
Freematiq machine:
OLTP test statistics:
       transactions:                        1000000 (29784.74 per sec.)
       read/write requests:                 5000000 (148923.71 per sec.)
       other operations:                    2000000 (59569.49 per sec.)
I started investigating. The only place where the Percona machine was better than Freematiq’s was disk speed. So I started running the pgbench read-only test, which was identical to SysBench’s point select test with full dataset in memory. But this time SysBench used 50% of available CPU resources:
PID  USER      PR  NI    VIRT    RES    SHR S  %CPU %MEM     TIME+ COMMAND
4585 smirnova  20   0  0,157t 0,041t   9596 S  7226  1,4  12:27.16 mysqld
8745 smirnova  20   0 1266212 629148   1824 S  7126  0,0   9:22.78 sysbench
Alexander, in turn, had issues with SysBench, which could not create a high load on PostgreSQL when prepared statements were used:
93087 korotkov  20   0 9289440 3,718g   2964 S 242,6  0,1   0:32.82 sysbench
93161 korotkov  20   0 32,904g  81612  80208 S   4,0  0,0   0:00.47 postgres
93116 korotkov  20   0 32,904g  80828  79424 S   3,6  0,0   0:00.46 postgres
93118 korotkov  20   0 32,904g  80424  79020 S   3,6  0,0   0:00.47 postgres
93121 korotkov  20   0 32,904g  80720  79312 S   3,6  0,0   0:00.47 postgres
93128 korotkov  20   0 32,904g  77936  76536 S   3,6  0,0   0:00.46 postgres
93130 korotkov  20   0 32,904g  81604  80204 S   3,6  0,0   0:00.47 postgres
93146 korotkov  20   0 32,904g  81112  79704 S   3,6  0,0   0:00.46 postgres
We contacted SysBench author Alexey Kopytov, and he fixed MySQL issue. The solution is:
- Use SysBench with options
--percentile=0 --max-requests=0
(reasonable CPU usage) - Use concurrency_kit branch (better concurrency and Lua processing)
- Rewrite Lua scripts to support prepared statements (pull request: https://github.com/akopytov/sysbench/pull/94)
- Start both SysBench and mysqld with the jemalloc or tmalloc library pre-loaded
- A fix for PostgreSQL is on the way. For now, Alexander converted a standard SysBench test into pgbench format and we stuck with it. Not much new for MySQL, but at least we had a baseline for comparison.
The next difficulty I faced was the default operating system parameters. To make the long story short, I changed them to the recommended ones (described below):
vm.swappiness=1
cpupower frequency-set --governor performance
kernel.sched_autogroup_enabled=0
kernel.sched_migration_cost_ns= 5000000
vm.dirty_background_bytes=67108864
vm.dirty_bytes=536870912
IO scheduler [deadline]
The same parameters were better for PostgreSQL performance as well. Alexander set his machine similarly.
After solving these issues we learned and implemented the following:
- We cannot use a single tool (for now)
- Alexander wrote a test for pgbench, imitating the standard SysBench tests
- We are still not able to write custom tests because we use different tools
But we could use these tests as a baseline. After work done by Alexander, we stuck with the standard SysBench tests. I converted them to use prepared statements, and Alexander converted them into pgbench format.
I should mention that I was not able to get the same results for the Read Only and Point Select tests as Dimitri. They are close, but slightly slower. We need to investigate if this is the result of different hardware, or my lack of performance testing abilities. The results from the Read-Write tests are similar.
Another difference was between the PostgreSQL and MySQL tests. MySQL users normally have many connections. Setting the value of the variable max_conenctions, and limiting the total number of parallel connections to thousands is not rare nowadays. While not recommended, people use this option even without the thread pool plugin. In real life, most of these connections are sleeping. But there is always a chance they all will used in cases of increased website activity.
For MySQL I tested up to 1024 connections. I used powers of two and multiplies of the number of cores: 1, 2, 4, 8, 16, 32, 36, 64, 72, 128, 144, 256, 512 and 1024 threads.
For Alexander, it was more important to test in smaller steps. He started from one thread and increased by 10 threads, until 250 parallel threads were reached. So you will see a more detailed graph for PostgreSQL, but no results after 250 threads.
Here are our comparison results.
Point SELECTs
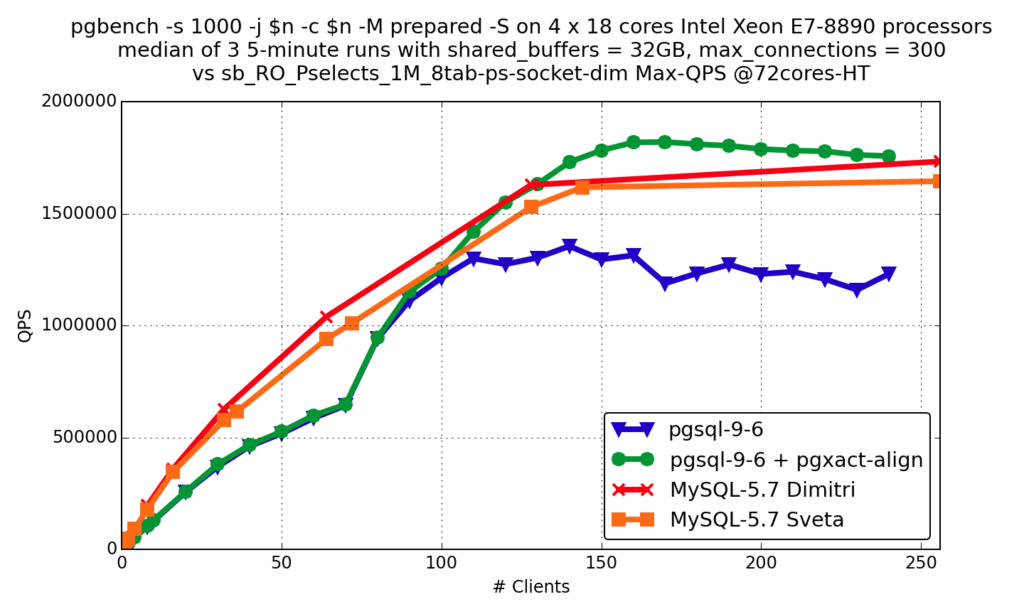
- pgsql-9.6 is standard PostgreSQL
- pgsql-9.6 + pgxact-align is PostgreSQL with this patch (more details can be found in this blog post)
- MySQL-5.7 Dimitri is Oracle’s MySQL Server
- MySQL-5.7 Sveta is Percona Server 5.7.15
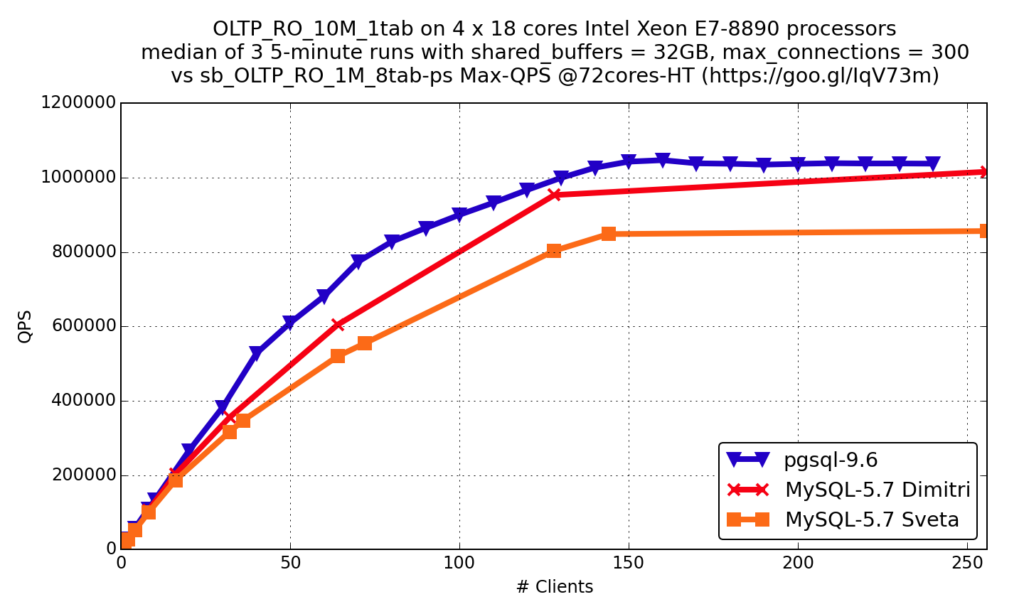
OLTP RO
OLTP RW
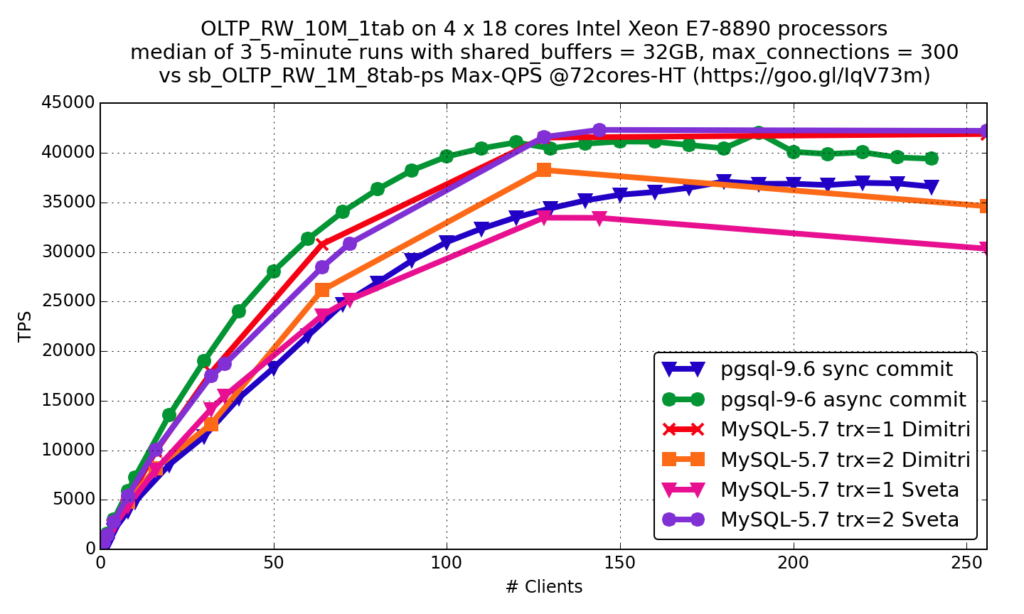
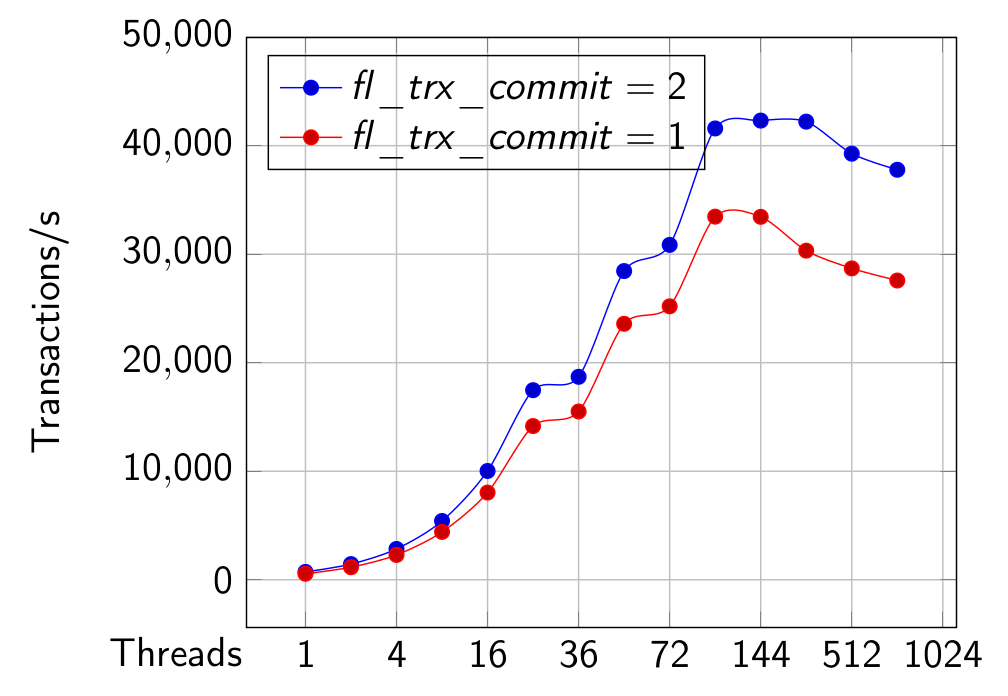
Sync commit in PostgreSQL is a feature, similar to innodb_flush_log_at_trx_commit=1 in InnoDB, and async commit is similar to innodb_flush_log_at_trx_commit=2.
You see that the results are very similar: both databases are developing very fast and work with modern hardware well.
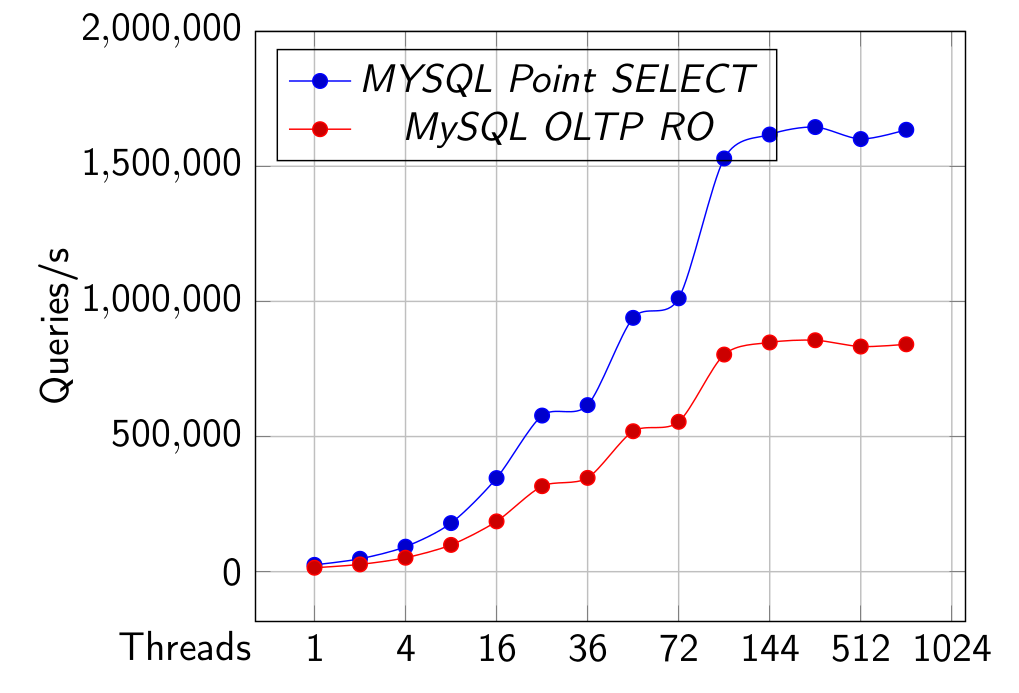
MySQL results which show 1024 threads for reference.
Point SELECT and OLTP RO
OLTP RW with innodb_flush_log_at_trx_commit set to 1 and 2
After receiving these results, we did a few feature-specific tests that will be covered in separate blog posts.
More Information
MySQL Options for OLTP RO and Point SELECT tests:
# general
table_open_cache = 8000
table_open_cache_instances=16
back_log=1500
query_cache_type=0
max_connections=4000
# files
innodb_file_per_table
innodb_log_file_size=1024M
innodb_log_files_in_group=3
innodb_open_files=4000
# Monitoring
innodb_monitor_enable = '%'
performance_schema=OFF #cpu-bound, matters for performance
#Percona Server specific
userstat=0
thread-statistics=0
# buffers
innodb_buffer_pool_size=128000M
innodb_buffer_pool_instances=128 #to avoid wait on InnoDB Buffer Pool mutex
innodb_log_buffer_size=64M
# InnoDB-specific
innodb_checksums=1 #Default is CRC32 in 5.7, very fast
innodb_use_native_aio=1
innodb_doublewrite= 1 #https://www.percona.com/blog/2016/05/09/percona-server-5-7-parallel-doublewrite/
innodb_stats_persistent = 1
innodb_support_xa=0 #(We are read-only, but this option is deprecated)
innodb_spin_wait_delay=6 #(Processor and OS-dependent)
innodb_thread_concurrency=0
join_buffer_size=32K
innodb_flush_log_at_trx_commit=2
sort_buffer_size=32K
innodb_flush_method=O_DIRECT_NO_FSYNC
innodb_max_dirty_pages_pct=90
innodb_max_dirty_pages_pct_lwm=10
innodb_lru_scan_depth=4000
innodb_page_cleaners=4
# perf special
innodb_adaptive_flushing = 1
innodb_flush_neighbors = 0
innodb_read_io_threads = 4
innodb_write_io_threads = 4
innodb_io_capacity=2000
innodb_io_capacity_max=4000
innodb_purge_threads=4
innodb_max_purge_lag_delay=30000000
innodb_max_purge_lag=0
innodb_adaptive_hash_index=0 (depends on workload, always check)
MySQL Options for OLTP RW:
#Open files
table_open_cache = 8000
table_open_cache_instances = 16
query_cache_type = 0
join_buffer_size=32k
sort_buffer_size=32k
max_connections=16000
back_log=5000
innodb_open_files=4000
#Monitoring
performance-schema=0
#Percona Server specific
userstat=0
thread-statistics=0
#InnoDB General
innodb_buffer_pool_load_at_startup=1
innodb_buffer_pool_dump_at_shutdown=1
innodb_numa_interleave=1
innodb_file_per_table=1
innodb_file_format=barracuda
innodb_flush_method=O_DIRECT_NO_FSYNC
innodb_doublewrite=1
innodb_support_xa=1
innodb_checksums=1
#Concurrency
innodb_thread_concurrency=144
innodb_page_cleaners=8
innodb_purge_threads=4
innodb_spin_wait_delay=12 Good value for RO is 6, for RW and RC is 192
innodb_log_file_size=8G
innodb_log_files_in_group=16
innodb_buffer_pool_size=128G
innodb_buffer_pool_instances=128 #to avoid wait on InnoDB Buffer Pool mutex
innodb_io_capacity=18000
innodb_io_capacity_max=36000
innodb_flush_log_at_timeout=0
innodb_flush_log_at_trx_commit=2
innodb_flush_sync=1
innodb_adaptive_flushing=1
innodb_flush_neighbors = 0
innodb_max_dirty_pages_pct=90
innodb_max_dirty_pages_pct_lwm=10
innodb_lru_scan_depth=4000
innodb_adaptive_hash_index=0
innodb_change_buffering=none #can be inserts, workload-specific
optimizer_switch="index_condition_pushdown=off" #workload-specific
MySQL SysBench parameters.
LD_PRELOAD=/data/sveta/5.7.14/lib/mysql/libjemalloc.so
 /data/sveta/sbkk/bin/sysbench
 [ --test=/data/sveta/sysbench/sysbench/tests/db/oltp_prepared.lua | --test=/data/sveta/sysbench/sysbench/tests/db/oltp_simple_prepared.lua ]
 --db-driver=mysql --oltp-tables-count=8 --oltp-table-size=10000000
--mysql-table-engine=innodb --mysql-user=msandbox --mysql-password=msandbox
 --mysql-socket=/tmp/mysql_sandbox5715.sock
--num-threads=$i --max-requests=0 --max-time=300
--percentile=0 [--oltp-read-only=on --oltp-skip-trx=on]
PostgreSQL pgbench parameters:
$ git clone https://github.com/postgrespro/pg_oltp_bench.git
$ cd pg_oltp_bench
$ make USE_PGXS=1
$ sudo make USE_PGXS=1 install
$ psql DB -f oltp_init.sql
$ psql DB -c "CREATE EXTENSION pg_oltp_bench;"
$ pgbench -c 100 -j 100 -M prepared -f oltp_ro.sql -T 300 -P 1 DB
$ pgbench -c 100 -j 100 -M prepared -f oltp_rw.sql -T 300 -P 1 DB
Features in MySQL 5.7 that significantly improved performance:
- InnoDB: transaction list optimization
- InnoDB: Reduce lock_sys_t::mutex contention
- InnoDB: fix index->lock contention
- InnoDB: faster and parallel flushing
- MDL (Meta-Data Lock) scalability
- Remove THR_LOCK::mutex for InnoDB: Wl #6671
- Partitioned LOCK_grant
- Number of partitions is constant
- Thread ID used to assign partition
- Lock-free MDL lock acquisition for DML
Anastasia: The initial findings of this research were announced at Percona Live Amsterdam 2016. More findings were added to the second version of the same talk given at Moscow HighLoad++ 2016. Hopefully the third iteration of this talk will be available at Percona Live Open Source Database Conference 2017 in Santa Clara. Stay tuned: the Percona Live Committee is working on the program!
Related:
| Shard-Query adds parallelism to queries November 15, 2010 In "Insight for Developers" | Percona Live featured talk with Stewart Smith: Why Would I Run MySQL or MariaDB on POWER Anyway? March 23, 2016 In "Percona Live" | Why MySQL could be slow with large tables? June 9, 2006 In "Insight for DBAs" |

Stacy (Anastasia Raspopina) works for Percona as a Marketing Specialist responsible for internal company communication, event management, promotional activities, content generation and other special projects.

Sveta joined Percona in 2015. Her main professional interests are problem solving, working with tricky issues, bugs, finding patterns which can solve typical issues quicker, teaching others how to deal with MySQL issues, bugs and gotchas effectively. Before joining Percona Sveta worked as Support Engineer in MySQL Bugs Analysis Support Group in MySQL AB-Sun-Oracle. She is author of book "MySQL Troubleshooting" and JSON UDF functions for MySQL.
Источник: www.percona.com