You have made different files tab-wise; it would be more manageable if you could put them under a subfolder OR start a name with system_state or something like that.
- While applying the patch, I got warnings; please fix those.
- Fix PEP-8 errors (yarn run pep8)
- Fix the linter errors. Run yarn run bundle:dev instead of yarn run webpacker so you will get the linter errors on every run.
- If the System Stat extension does not exist, display the appropriate message instead of blank graphs.
- For the first time, graphs start from the opposite side, and after the following API call, those get adjusted; please fix that.
- Please consider the refresh rate for the API calls (preferences settings > Dashboards > Refresh rates)
Thank you for the feedback. I have made all the changes as you have suggested, except for the issue where graphs are starting from opposite sides. I am using the same StreamingChart component that is already there. I just made a few changes to handle multiple Y-axes. I tried debugging it, but haven't found a solution yet. However, I also checked the pgAdmin4 desktop application, and I observed a similar behavior there. The initial graphs start from the opposite side and then get adjusted automatically, but the transition is a little faster there. Could you please help identify what might be causing this issue?
Because it is the default behaviour of streaming.You can add a prop reverse=true to StreamingChart and change the code ret.reverse();based on condition.
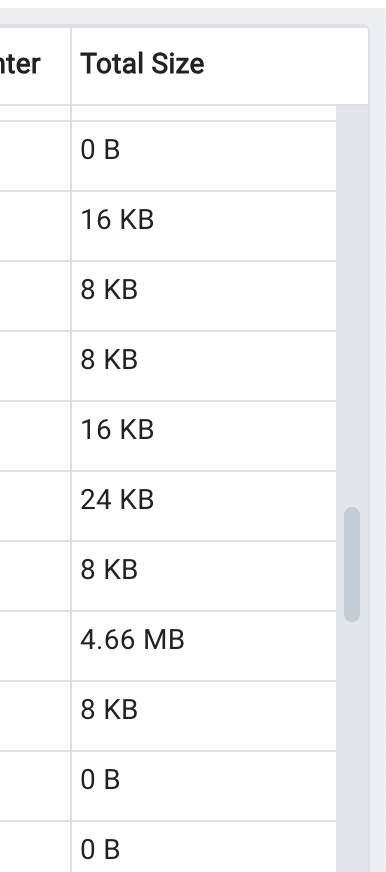
Unrelated to this, I think instead of showing disk sizes in bytes you can show them in a human readable format like below used in Statistics tab of Tables collection node.