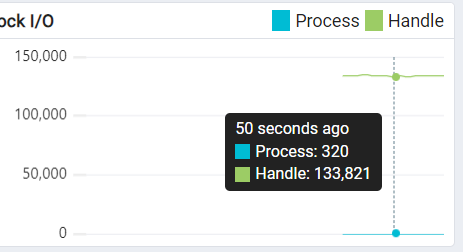
I tried combining the process and handle count in a single graph. But as you can see in the attached image, insights are not properly visible since the difference between the values is too large. Even when the process count is 320, without tooltips, it appears as zero. Can we draw separate graphs for both? Or do you think the current single combined version is fine?
