>> Oscillating plan changes may fit multimodal but I don't feel that's
>> typical. My experience has been it's either an extremely rare plan
>> difference or it's a shift from one plan to another over time.
>After all, all of avg, min, max and stdev are only numerical value for predicting model. There aren't the robustness
andstrictness such as Write Ahead Logging. It resembles a weather forecast. They are still better than nothing.
>It is needed a human judgment to finally suppose a cause from the numerical values. By the way, we can guess
probabilityof the value from stdev.
>Therefore we can guess easily even if there is an extreme value in min/max whether it is normal or not.
>>> What I've been gathering from my quick chat this morning is that
>>> either you know how to characterize the distribution and then the min
>>> max and average are useful on their own, or you need to keep track of
>>> an histogram where all the bins are of the same size to be able to
>>> learn what the distribution actually is.
Hello,
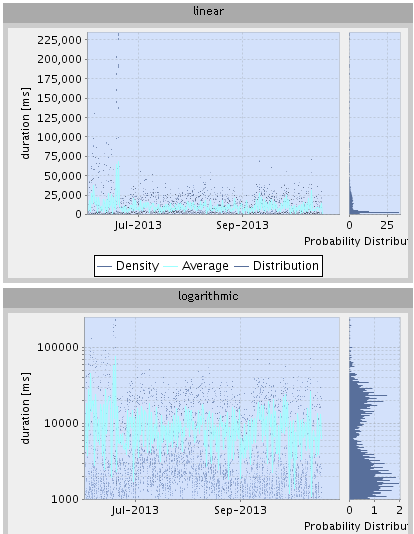
We have an in house reporting application doing a lot of response times graphing.
Our experience has shown that in many cases of interest (the one you want to dig in)
a logarithmic scale for histogram bins result in a better visualization.
attached an example from a problematic postgres query...
my 2 pences,
Marc Mamin