Battles in the ZFS Field
One of our company’s enterprise customers faced growth difficulties: the databases became huge, the needs changed, so the customer bought powerful NUMA servers and installed the ZFS file system they preferred (we call it “ZFS” for short, the official name is “OpenZFS”). Surprisingly, PostgreSQL performance degraded compared to the times before the servers were bought.
The customer’s Postgres databases were huge: each of the two databases was 180 TB in size. The stored data was collected from many other non-PostgreSQL databases. However, the company’s analysts use the PostgreSQL databases, so the solution is business-critical. ZFS compresses these databases by half, now each of them occupies 90 TB of disc space, but the overall performance hasn’t changed significantly. On the contrary, it slowed down. This is why our support team decided to do the database audit. Their findings looked interesting to us, that’s why we decided to share them with our blog readers. The tools we used to detect the issues have also been mentioned in this blog post.
The toolset
To do an audit, we normally use a set of open source and our own utilities. Upon the customer’s request, we can download a custom pg_diagdump.sh script that executes perf subcommands to return files with sampling data. We visualize the received information in FlameGraph.
The script can get the following data:
- the statistics on PostgreSQL processes performance pulled via perf;
- stacktrace of PostgreSQL processes and their locks;
- core dump of PostgreSQL processes done with gcore;
- information from pg_stat_statements, pg_stat_activity, pg_stat_all_tables.
In addition to this, we install in the database either pg_profile open source utility or PWR (pgpro_pwr), its variant with enhanced functionality, both authored by Andrey Zubkov. (Note. We do this when it complies with the customer’s security policies). pg_profile / pgpro_pwr accesses many system views including pg_stat_statements and works with pg_stat_kcache. This utility pulls the samples of current statistics at configurable time intervals (say, half an hour) and aggregates data that is displayed in multi-section reports.
The scale of the disaster
In our case, the Vacuum-related statistics section contained the most dreadful numbers:
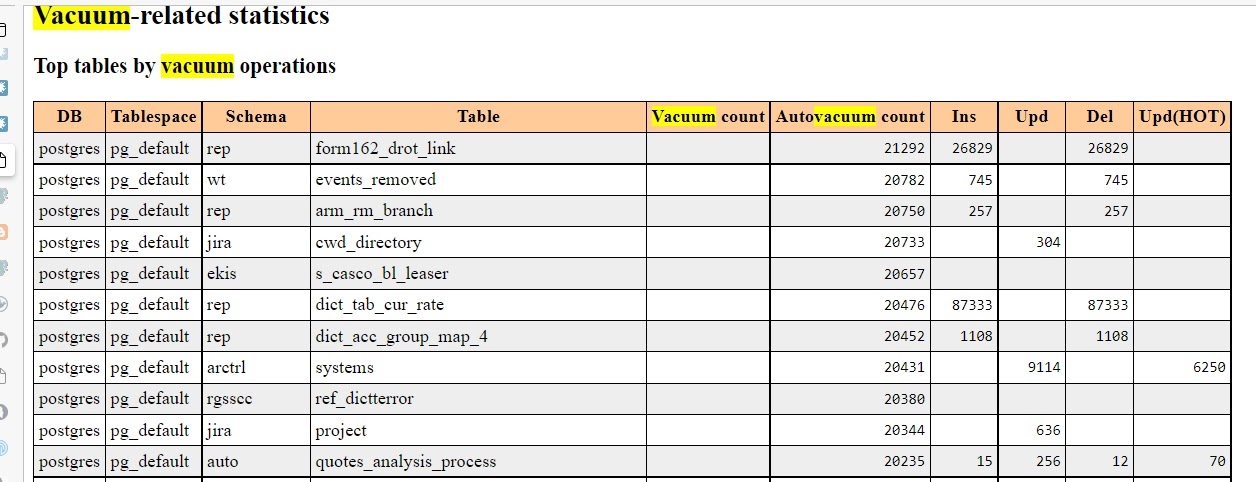
As you can see, the autovacuum process went through certain tables more than 20,000 times a day! (It this case, the report interval was set to half-day.) The number of autovacuum processes also reached the peak value. Many of the autovacuum processes came with the “to prevent wraparound” notice. To get more information about this notice, please read the essential blog post by Egor Rogov covering Autovacuum; you can also refer to this material — it mentions this notice. Of course, Postgres documentation also covers it.
The autovacuum configurations were quite unusual: the autovacuum_max_workers parameter that limits the number of parallel autovacuum processes, was set to 50, while its default value is 3. Sometimes this value could be set to, say, 10, but 50 was what our auditing team had never seen before. However, this 50 number appeared to be not enough either, the limit was reached: the pg_stat_progress_vacuum view displays the maximum of 50 rows. By the way, pg_profile reports have the Cluster settings during the report interval section where you can check the value of the autovacuum_max_workers parameter.
Getting back to our case, autovacuum_max_workers=50 is an obvious pathology. However, it’s not the reason, it’s a symptom. To find the reason, one needs to find long-running transactions and understand why they take that long. These long-running active transactions prevent autovacuum from vacuuming the “old” data. This is why autovacuum attempts to do it again and again as the maximum size of the table’s garbage still exceeds the admissible limit. This limit is calculated based on several parameters covered in the documentation.
In search of long-running transactions
pg_profile allows to check the average query execution time in the Top SQL by execution time section.
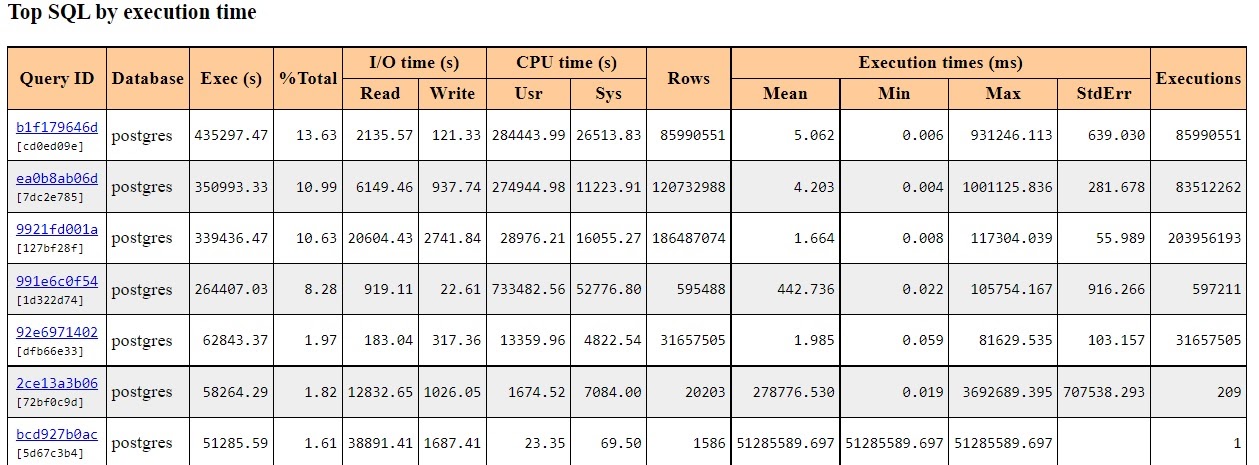
You can access full query text by clicking the link in the Query ID column. You won’t be able to see the parameters though. For example, WHERE x=1 and WHERE x=2 will be displayed as WHERE х=$1 — this is what they look like in the pg_stat_statements view. Actually, it’s the best way to view queries otherwise they would become a mess.
Here is what you need to do if you have to find long-lasting transactions in a particular moment, not on average:
SELECT *
FROM pg_stat_activity
WHERE state = 'active'
ORDER BY now() – xact_start DESC NULLS LAST;
This information can be found in the rows of the pg_stat_activity view. In particular, we tried to find the active transactions where the query is still being executed. Sometimes query processing was really long: the record transactions had been processed for 3 days already.
The reports also help detect the sessions with the idle in transaction state. This means that the transaction was active and hadn’t rolled back its changes, which prevents autovacuum from vacuuming the outdated rows in the table and in the corresponding index.
You may use a very similar query to find them:
SELECT *
FROM pg_stat_activity
WHERE state LIKE '%idle%'
ORDER BY now() – xact_start DESC NULLS LAST;
Some of these transactions were also hung for hours. At this stage, it also became possible to analyze the query’s text and figure out which application initiated this query, and make changes if appropriate.
You can also use other diagnostics options. It is worthwhile to understand "where", at what stage, in what function, the query spends time.
Analysis with perf top and perf with visualization in Flamegraph helped to detect the Linux kernel osq_lock() function that consumed almost 38% of CPU resources — it’s one of the reasons for the great consumption of the CPU System Time. Here you can see it:
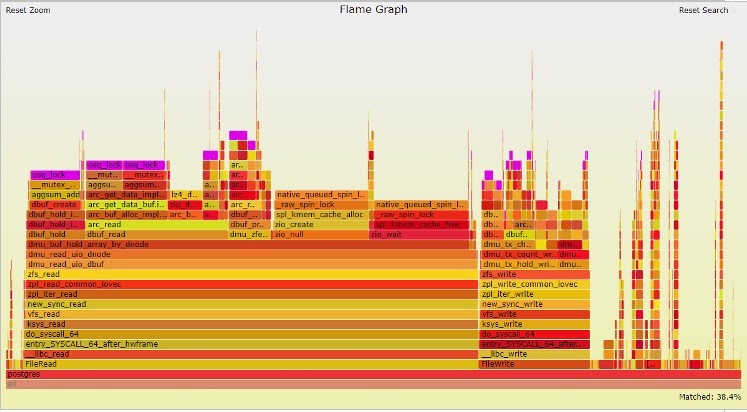
The osq_lock function is highlighted in purple. As you can guess, this function is related to locking mechanisms. In Linux kernel, osq stands for the “optimistic spin queue”.
Perpetrators and victims
The findings are really interesting. PostgreSQL was rather a victim than a perpetrator. The situation was caused by a lower layer OS function.
After running perf script (top, script are perf subcommands), it turned out that osq_lock was taken during the execution of the aggsum_add() function of a ZFS module. The group of functions called aggsum_* increase the counter values while tracking read or write operations.
So, let’s get back to the start. Our 180-TB databases occupied 90 TB of disc space after compression and were to be served by NUMA servers with 8 sockets (processors) with 8 x 24 = 192 physical cores. It’s a known fact that NUMA does not always work well or scale with Postgres. On a physical server, all 8 CPUs are located on the same motherboard, but the access to the remote memory is much slower compared to the local one.
To understand what’s happening, our colleagues went through the code of the aggsum_* functions. ZFS was optimized for NUMA servers, and, to put it simply, auxiliary bucket counters were added to each CPU to collect local data and then send it to the global read-write operations counter. It looked good enough but didn’t work fast enough. Why? Such a solution required locks on each CPU bucket counter and the lock on the global counter, too. A number of CPU processes competed for the global counter. The more processes we had, the slower interprocessor communications were, as the queues became longer. For those who like info from primary sources, the details can be found in the commentary for the aggsum.c file. So the processor did work, but it did no good, and from the Postgres viewpoint, the transactions remained idle, and autovacuum went to tables and indexes again and again.
It is great when you understand what affects performance, but then you need to do something about it. The simplest way out was to replace ZFS with another solution and find an alternative way of data compression. For example, in Postgres Pro Enterprise, we have a database-level data compression feature. However, such radical changes didn’t look good to the customer. Their IT team had reasons for using ZFS so they decided to keep it.
ZFS is more than just a file system enabling data compression. It works in accordance with the COW (Copy-On-Write) principle: a shared copy of a data area is used while reading, a new copy is created if the data changes. This copy can be rolled back to its previous state, so you can restore it without backups. Configuration and management can also be done. So in our case there was a need to understand how to do it for the ZFS-NUMA combination.
Slow queues unwilling to dissipate also explained the excess autovacuum activity. Due to the massive queues for getting the data from ZFS counters, query execution took much longer than expected, tables and indexes became large. Indexes have no visibility map, so autovacuum has to go through each block of each index. As we could see in our case, vacuuming could last for days.
Happy End
Our team scanned a number of forums and portals in search of a solution, and it was found: Alexander Motin from iXsystems witnessed a very similar behavior on a 40-core machine running FreeBSD, so he made a patch that removes the excessive operations with counters. It was committed to the master branch and available since ZFS 2.0+.
Our customer was running version 0.8. Actually, it wasn’t too old. When ZFS and OpenZFS versions got their numbering issues resolved, 1.x versioning was skipped, and the version numbering restarted from 2.0.
As a result, the advice for the customer was to upgrade to ZFS (2.1+). They upgraded both Linux and ZFS. Now everything works well, and there are no performance-related complaints. Of course, there is always something to be optimized and tuned in a system based on a combination of OpensZFS and PostgreSQL. The sky's the limit, and nuances are endless.
We thank Postgres Professional’s Michael Zhilin and Peter Petrov for sharing the technical details of this notable case.