PostgreSQL monitoring using Zabbix Agent 2: easy and extensible

Last year, the popular monitoring service Zabbix introduced Agent 2, designed to reduce the number of TCP connections and provide convenient extendability through plugins in Golang. In this article, I will discuss the main features of the Zabbix Agent 2 plugin for monitoring PostgreSQL, give tips on how to configure it, and explain by example how to customize the plugin.
What is the story behind the PostgreSQL monitoring plugin for Zabbix Agent 2?
In 2019 Zabbix announced the release of the new Agent 2. The Zabbix team created it from scratch in Golang. Each application requires a separate monitoring plugin. We at Postgres Professional have been using Zabbix for monitoring PostgreSQL for long years, that is why we decided to invest our experience in developing a PostgreSQL monitoring module for Agent 2.
How does DBMS monitoring work in Zabbix?
Let us start with a short introduction to the Zabbix monitoring strategy for beginners.
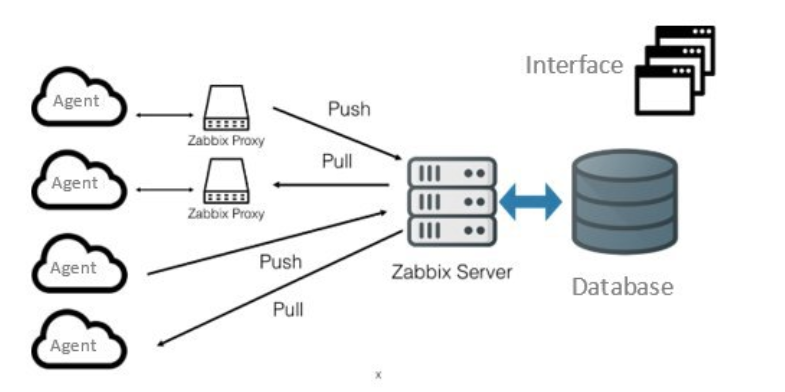
The structure we are interested in consists of two components:
- Zabbix Server, which stores, visualizes, and processes the collected data.
- Zabbix Agent, which is deployed on a monitoring target to monitor local resources and applications (hard drives, memory, processor statistics etc.).
Zabbix Server requires a template - an XML file - to monitor each application. It contains the metrics’ keys (unique IDs) and their processing parameters.
Zabbix Agent 2 provides the user with a monitoring tool out of the box. It is quick and easy to customize and possesses a good extendability.
So how does PostgreSQL plugin for Zabbix Agent 2 work?
There is the main function from which the handlers with a unique key for each metric are called. The handler collects data. It is a file in which a SQL query is specified and executed to get one or more metrics. A variable of int, float, or string type stores the results of the query execution. If it contains the values of several metrics, it will be converted to JSON. The metrics received by Zabbix Agent 2 are regularly sent to Zabbix Server.
The plugin and the handlers are located in this folder: /plugins/postgres.
Which features does the PostgreSQL monitoring module for Zabbix Agent 2 have?
- A constant connection to PostgreSQL.
- Monitoring for multiple PostgreSQL instances simultaneously.
- Options to monitor and check metrics in real-time via command line.
- One agent configuration file for configuring all plugin parameters.
- Keeping the state between checks.
- Very simple customization of how the existing metrics are collected.
- Ability to write new plugins according to your requirements.
The plugin has an official template, which is accessible here:
https://www.zabbix.com/integrations/postgresql#tab:official2
It has basic triggers and a complex screen that displays a combination of several charts. The plugin collects more than 95 metrics. The full list of all metrics can also be found on the Zabbix website.
In Zabbix Server web-interface you can easily customize the template and its components. What exactly can you set up?
- Change the time interval for how often the desired metrics are collected.
- Add a trigger for the metric.
- Add a macro or edit an existing one.
How to install and use the PostgreSQL plugin for Zabbix Agent 2?
- Create a PostgreSQL user for monitoring (<password> at your discretion):
CREATE USER 'zbx_monitor' IDENTIFIED BY '<password>';
GRANT EXECUTE ON FUNCTION pg_catalog.pg_ls_dir(text) TO zbx_monitor;
GRANT EXECUTE ON FUNCTION pg_catalog.pg_stat_file(text) TO zbx_monitor;
- Edit pg_hba.conf to allow connections from Zabbix agent:
# TYPE DATABASE USER ADDRESS METHOD
  host all zbx_monitor 127.0.0.1 md5
For more information, please read the PostgreSQL documentation here: https://www.postgresql.org/docs/current/auth-pg-hba-conf.html.
Now you need to specify the PostgreSQL connection parameters for Zabbix Agent 2. There are two ways to do this:
- to use macros for connection parameters,
- to create a session.
The first way is a little easier. It can suffice if you need to configure monitoring for one PostgreSQL instance:
- Set in the {$PG.URI} macro the system data source name of the PostgreSQL instance such as <protocol(host:port)> in the template.
- Set the macro with your username and password ({$PG.USER} and {$PG.PASSWORD}) in the template. You can also specify the macro {$PG.DATABASE}. This parameter is optional for most metrics. If it is not specified in the key, then the base name specified in the agent configuration file will be used. An example can be seen in Picture 1.
The official template already has all required macros in the parameters of all keys. Please note that the order of the parameters in the key is fixed.

The second way enables you to set the connection parameters to several PostgreSQL instances:
- Set the connection parameters for the session in the configuration file zabbix_agent2.conf in the section of the Postgres plugin:
Postgres.Sessions.<Session_name>.URI, Postgres.Sessions.<Session_name>.User, Postgres.Sessions.<Session_name>.Password - Instead of the
<Session_name>, you should specify a unique name for the new session (as shown in Picture 2).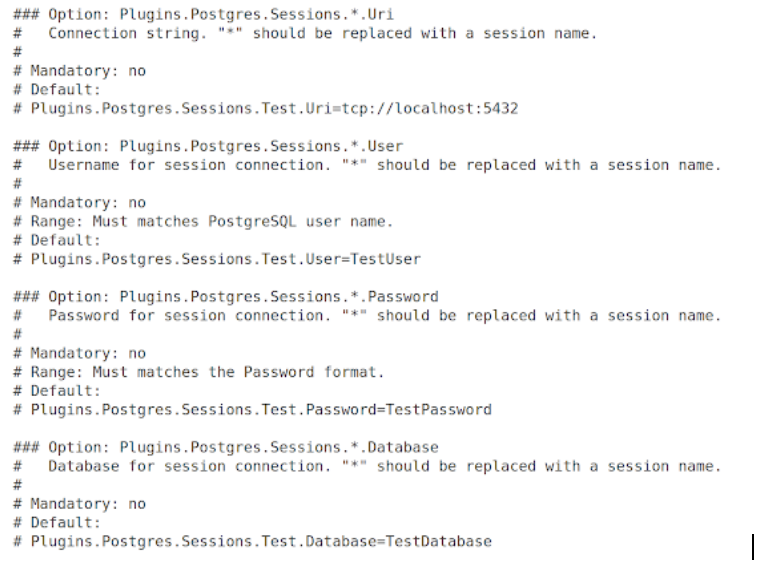
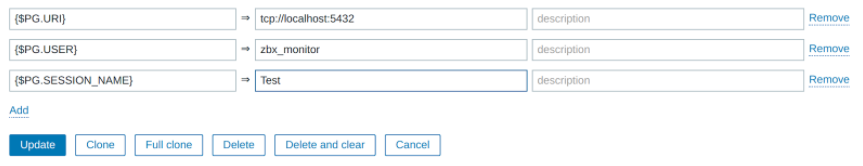
- Create a macro with the session name {$PG.<Session_name>} in the template (as shown in Picture 3).
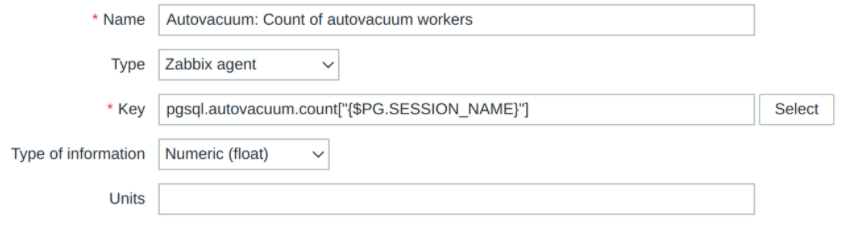
- Specify the macro as the only parameter for metrics in the template (as shown in Picture 4).
How to add new metrics to existing ones?
Let us explore how to use the plugin to collect more metrics. In our example, we’ll be adding an uptime metric.
To do this, you will need to create a new handler with a query, and then add its key to the main function.
- Let's create a file to get a new metric:
zabbix/src/go/plugins/postgres/handler_uptime.go
Import the postgres package and specify the key(s) of the metrics:
package postgres

const (
  keyPostgresUptime = "pgsql.uptime"
)
- Declare a handler with a query, do the same for the variable to store results:
func (p *Plugin) uptimeHandler(conn *postgresConn, params []string)(interface{}, error)
{
  var uptime float64
query := `SELECT date_part('epoch', now() - pg_postmaster_start_time());`
- Execute a query, check if there is an error. If everything is OK, the uptime variable will be returned with some result.
err := conn.postgresPool.QueryRow(context.Background(), query).Scan(&uptime)
  if err != nil {
 ...
}
return uptime, nil
- Finally, register a key for the new metric:
func init() {
  plugin.RegisterMetrics(&impl, pluginName,
  …
 keyPostgresUptime, "Returns uptime.",
  )
 }
Recompile the agent!
Other Related Resources:
Article by Vadim Ipatov - co-developer of Zabbix Agent 2:
https://blog.zabbix.com/developing-plugins-for-zabbix-agent-2/9682/
Template for our PostgreSQL monitoring plugin:
https://www.zabbix.com/integrations/postgresql#tab:official2
Zabbix Git. It is for those who want to see more real-world examples and have a look at all SQL queries for metrics:
https://git.zabbix.com/projects/ZBX/repos/zabbix/browse/src/go/plugins/postgres
What’s next?
The new version of the above-mentioned plugin for PostgreSQL monitoring will become available soon! It will feature new metric enabling users to collect results of custom queries from separate SQL files. This version will also include minor bug fixes and introduce the module’s architecture update.
Join Postgres Pro & Zabbix for a Meetup!
If you have any questions related to the monitoring plugin for Zabbix Agent 2, you can ask them directly at the upcoming PostgreSQL Monitoring Day with Zabbix & Postgres Pro. I will speak there discussing the enhancements of version 2 of this monitoring plugin. The community event featuring 5 sessions on Postgres monitoring will take place online on December 10, 2020, at 6 PM CET. Hope to see many of you there!